Indones Biomed J. 2013; 5(1): 37-42 DOI: 10.18585/inabj.v5i1.49
R E S E A R C H A R T I C L E
Correlation between Extracellular Heat Shock Protein 60 (exHSP60) and
Homeostatic Model Assessment of Insulin Resistance (HOMA-IR) in
Non Diabetic Men
Meiriza Djohari
1,2,, Suryani As’ad
3, Mansyur Arief
3, Andi Wijaya
1,41Postgraduate Program in Clinical Biochemistry, Hasanuddin University, Jl. Perintis Kemerdekaan Km.10. Makassar, Indonesia 2Prodia Clinical Laboratory, Jl. Cempaka No.80 ABC, Pekanbaru, Indonesia
3Faculty of Medicine, Hasanuddin University, Jl.Perintis Kemerdekaan Km 10, Makassar,Indonesia 4Prodia Clinical Laboratory, Jl. Cisangkuy No.2, Bandung, Indonesia
Corresponding author. E-mail: [email protected]
B
ACKGROUND: Adipose tissue expansion inobesity leads to abnormal adipocyte function, chronic low grade inflammation, primary reticulum stress, and mitochondrial stress. This induces mitochondrial unfolded protein response (UPRmt) that selectively upregulates mitochondrial chaperone protein. Heat shock Protein 60 (HSP60) is the primary chaperone in mitochondrial matrix. Inflammatory stress promotes HSP60 released from adipocytes and induces insulin resistance. In this study we attempted to investigate the correlation between exHSP60 and HOMA-IR in men with different ranges of waist circumference (WC).
METHODS: This study was an observational cross
sectional study carried out on 141 non diabetic men, aged 30-55 years old, who were divided into three groups based on WC; WC ≤ 90 cm, 90 cm < WC ≤ 100 cm and WC > 100 cm. Fasting plasma glucose, triglyceride, HDL-C, hsCRP, HSP60 serum and anti-HSP60 antibody, serum IL-1β serum, insulin, were examined. For statistical analysis, Kolmogorov-Smirnov and Spearman’s correlation analysis were conducted.
RESULTS: There were a significant correlation between
exHSP60 and HOMA-IR (r=0.281; p=0.041) in WC ≤ 90
cm group; and a negative significant correlation between exHSP60 and HOMA-IR (r=-0.508; p=0.007) in WC > 100
cm group.
CONCLUSION: This study showed that there was a
dynamic correlation between exHSP60 and HOMA-IR in WC ≤ 90 cm group compared with WC > 100 cm group. We
L
ATAR BELAKANG: Ekspansi jaringan lemakpada obesitas memicu terjadinya gangguan fungsi adiposit, inflamasi kronis tingkat rendah, stres primer pada retikulum endoplasma, dan stres mitokondria. Hal ini dapat memicu mitochondrial unfolded protein response (UPRmt) yang akan meningkatkan protein chaperone mitokondria. Heat shock Protein 60 (HSP60)
adalah chaperone utama pada matriks mitokondria. Stres akibat inflamasi dapat meningkatkan pelepasan HSP60 dari adiposit dan menyebabkan resistensi insulin. Maka pada penelitian ini kami mencoba untuk melihat korelasi antara exHSP60 dan HOMA-IR pada pria dengan ukuran lingkar pinggang (LP) yang berbeda.
METODE: Penelitian ini dilakukan dengan metode
observasi potong lintang melibatkan 141 pria usia 30-55 tahun yang dibagi menjadi tiga kelompok berdasarkan berdasarkan LP; LP ≤ 90 cm, 90 cm< LP ≤ 100 cm dan LP > 100 cm. Dilakukan pengukuran glukosa darah puasa, trigliserida, HDL-C, hsCRP, serum HSP60 and antibodi anti-HSP60, serum IL-1β, insulin. Pada analisa statistik, dilakukan analisa Kolmogorov-Smirnov dan Spearman’s correlation.
HASIL: Ditemukan korelasi signifikan antara exHSP60 dan
HOMA-IR (r=0,281; p=0,041) pada kelompok LP ≤ 90 cm;
dan korelasi negatif signifikan antara exHSP60 dan HOMA-IR (r=-0,508; p=0,007) pada kelompok LP > 100 cm.
KESIMPULAN: Penelitian ini menunjukkan korelasi yang
dinamis antara exHSP60 dengan HOMA-IR pada kelompok
Overweight and obesity are major risk factors for many diseases ranging from insulin resistance (IR), type 2 diabetes mellitus (T2DM), and atherosclerosis to nonalcoholic fatty liver disease (NAFLD). A chronic, low grade of inflammation often accompanies the excess lipid accumulation in adipose tissue and liver, shown by changes in both inflammatory cells and biochemical markers of inflammation.(1)
In 2010, Riset Kesehatan Dasar (RISKESDAS)
reported that prevalence of overweight in adults was 21.7%, increased when compared with RISKESDAS report in 2007 showing that the prevalence was only 18.8%. Meanwhile in worldwide, there are 1.6 billion adults recorded to be overweight and obese.(2,3)
Insulin resistance, which is marked by homeostatic model assessment of insulin resistance (HOMA-IR), suggested as a key player in the pathophysiology of obesity that is associated with T2DM.(4) The mechanism that links obesity to IR is not fully understood. Other studies have shown that the increase of free fatty acids (FFA) in obese subjects confirms the link of obesity with IR, but it is known that not all obese subjects with IR have higher level of FFA, and lower level of FFA doesn’t indicate any increase in insulin sensitivity.(5) This suggests that there must be another mechanism that links obesity with IR, e.g.
mitochondrial stress.
The root cause of obesity is energy imbalance, where calories intake is higher than the expended calories. This leads to storage of excess energy in adipocytes, which exhibits hyperplasia and hypertrophy, and is associated with abnormal adipocyte function, primary reticulum stress, and mitochondrial stress(6), mitochondrial stress will induce mitochondrial unfolded protein response (UPRmt) that selectively upregulates mitochondrial chaperone protein that can disrupt the homeostasis in mitochondria, leading to IR(7).
In the eukaryotic intracellular molecular networks, Heat Shock Protein 60 (HSP60) is the primary chaperone in the mitochondrial matrix.(8) In extracellular also found inverse correlation patterns between exHSP60 and HOMA-IR, and between anti-HSP60 antibody and HOMA-IR in non diabetic subjects.
KEYWORDS: obesity, insulin resistance, mitochondrial
stress, exHSP60, hsCRP, HOMA-IR
Indones Biomed J. 2013; 5(1): 37-42
LP ≤ 90 cm dibandingkan pada kelompok LP > 100 cm. exHSP60 dan antibodi anti-HSP60 dengan HOMA-IR memiliki pola korelasi yang berkebalikan pada subyek non diabetes.
KATA KUNCI: obesitas, reistensi insulin, stres
mitokondria, exHSP60, hsCRP, HOMA-IR
environment, extracellular HSP60 (exHSP60) takes its role as an autoantigen for both B cells and foreign cells. The upregulation of exHSP60 causes tissue damage which is released from dying cells, and activates B cells to produce anti-HSP60 antibody.(9)
A recent study has reported that inflammation stress promotes release of HSP60 from adipocytes and induces insulin resistance in sceletal muscles.(10) Kim, et al. found
that exHSP60 can activate nuclear factor κB (NFκβ) through toll like receptor 4 (TLR-4) and induces the production of Interleukin 1β (IL-1β), which upregulates acute phase reactant protein C reactive protein (CRP) from liver in large amount.(4,11) Anti-HSP60 antibody induced by B cells inhibits this mediation.
Many studies in the last decade showed the contribution of low grade inflammation in IR(12,13), where IL-1β and
CRP plays a role in promoting IR(14-16). In this study we attempted to investigate the correlation between exHSP60 and HOMA-IR in adult men with different ranges of waist circumference (WC).
Study design and subjects recruitment
This was an observational cross sectional study, conducted on 141 non diabetic men, aged 30-55 years old, divided into three groups based on their WC; WC ≤ 90 cm; 90 cm < WC ≤ 100 cm and WC > 100 cm. Our clinical study protocol was approved by the Health Research Ethics Committee, Faculty of Medicine, Hasanuddin University (No. UH11020042). The study subjects were asked to fill the questionnaire (medical history, exercises and smoking habit) and sign the informed consent. Fasting (10-12 hours) sera were obtained and kept at -20˚C. Anthropometric parameters (WC, blood pressure) and biomarkers (fasting plasma glucose (FG), HDL-C, triglyceride (TG), hsCRP, IL-1β, exHSP60, anti-HSP60 antibody, fasting insulin (FI)) were measured.
Biomarkers assay
FG (hexokinase, Dialine), TG (Glycerol-3-Phosphate Oxidase-Phenol Amino Phenazone (GPO-PAP), Dialine),
Introduction
Indones Biomed J. 2013; 5(1): 37-42 DOI: 10.18585/inabj.v5i1.49
HDL-C (Homogenous, Daiichi), hsCRP (chemiluminesence, Siemens), HSP60 serum and anti-HSP60 antibody (ELISA, Stressgen), IL-1β serum (ELISA, R&D system), FI (chemiluminiscent Immunometric Assay, Siemens), were measured. All assays were performed according to each
manufacturer’s instruction at Prodia Clinical laboratory, HOMA-IR = _______FI x FG 405
Table 1. Subjects’ Characteristics.
Median Min - Max Median Min - Max Median Min - Max
Age (years) 42 (30-54) 42 (30-54) 41 (32-53)
BMI (kg/m²) 25.400 (19.500-37) 25.900 (17.900-59,800) 25.200 (17-36.900)
WC (cm) 84 (69-90) 95 (91-100) 104 (101-126)
FG (mg/dl) 94 (69-125) 96 (73-119) 94 (59-122)
TG ( mg/dl) 111 (42-286) 128 (55-471) 124 (41-496)
HDL ( mg/dl) 40 (25-54) 39 (25-62) 37 (22-47)
FI (mU/l) 6 (2.400-26.400) 11.300 (4.400-27.300) 11.600 (4.300-23.300)
exHSP60 (abs) 0.061 (0.041-0.114) 0.060 (0.041-0.246) 0.059 (0.040-0.102)
anti-HSP60 antibody (ng/ml) 46.930 (17.480-250) 52.620 (20.340-250) 51.030 (23.540-240.370)
IL-1β (pg/ml) 0.057 (0.056-0.745) 0.056 (0.029-10.779) 0.056 (0.056-0.474)
hsCRP (mg/l) 1 (0.2-8.1) 1.300 (0.100-8.400) 2.900 (0.600-9.400)
HOMA-IR 1.410 (0.540-5.800) 2.560 (1.030-7.620) 2.730 (0.860-5.760) GROUP
CHARACTERISTICS WC ≤ 90 cm 90 cm < WC ≤ 100 cm WC > 100 cm
Indonesia. Controls were included for each run of the assays to show that all results are in the acceptable ranges. HOMA models to determine IR and insulin secretion were calculated using the formula (17):
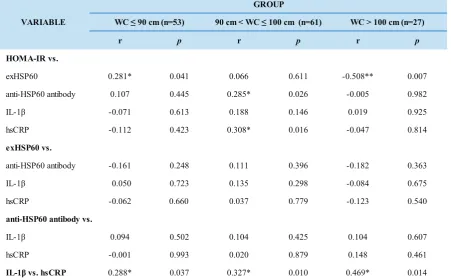
Table 2. Spearmen’s Correlation Analysis in Different WCs.
*= significant correlation with confidence level 95%; ** = significant correlation with confidence level 99%
r p r p r p
HOMA-IR vs.
exHSP60 0.281* 0.041 0.066 0.611 -0.508** 0.007
anti-HSP60 antibody 0.107 0.445 0.285* 0.026 -0.005 0.982
IL-1β -0.071 0.613 0.188 0.146 0.019 0.925
hsCRP -0.112 0.423 0.308* 0.016 -0.047 0.814
exHSP60 vs.
anti-HSP60 antibody -0.161 0.248 0.111 0.396 -0.182 0.363
IL-1β 0.050 0.723 0.135 0.298 -0.084 0.675
hsCRP -0.062 0.660 0.037 0.779 -0.123 0.540
anti-HSP60 antibody vs.
IL-1β 0.094 0.502 0.104 0.425 0.104 0.607
hsCRP -0.001 0.993 0.020 0.879 0.148 0.461
IL-1β vs. hsCRP 0.288* 0.037 0.327* 0.010 0.469* 0.014 WC > 100 cm (n=27) VARIABLE
GROUP
Subjects’ characteristics are shown in Table 1. Table 2 shows significant correlation between HOMA-IR and exHSP60 in WC ≤ 90 cm group (r=0.281; p=0.041); significant negative
correlation between HOMA-IR and exHSP60 in WC > 100 cm group (r=-0.508; p=0.007); significant correlation
between HOMA-IR and anti-HSP60 in 90 cm < WC ≤ 100 cm group (r=0.285; p=0.026);significant correlation
between HOMA-IR and hsCRP (r=0.308; p= 0.016) in 90
cm < WC ≤ 100 cm group; meanwhile IL-1β and HsCRP were significantly correlated in all groups.
Statistical Analysis
Statistical analysis was performed with the SPSS version 13.0 for Windows. Normal distribution of variables was assessed using the Kolmogorov-Smirnov. Associations between variables were analyzed using Spearman’s correlation analysis, using significance level at p<0.05.
Figure 1. Scatter analysis of exHSP60 and HOMA-IR.
Figure 2. Scatter analysis of anti-HSP60 antibody and HOMA IR.
Figure 1 shows correlation between exHSP60 and HOMA-IR and Figure 2 shows correlation between anti-HSP60 antibody and HOMA-IR. This shows that there
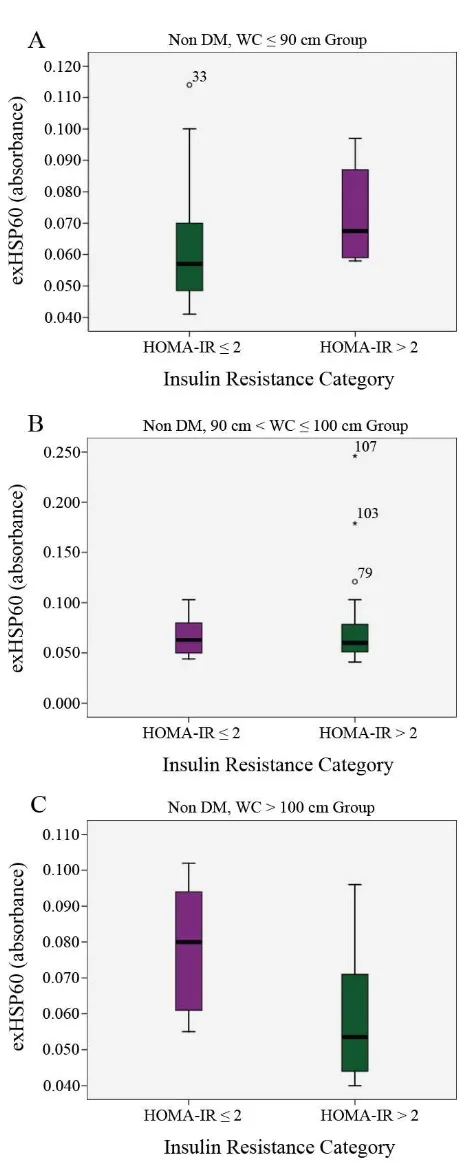
Figure 3. The correlation between exHSP60 with HOMA-IR. HOMA-IR of WC ≤ 90 cm (A), 90 cm < WC ≤
100 cm (B) and WC > 100 cm (C) groups were categorized
in ≤ 2 and > 2. Each HOMA-IR category of all groups was analysed in its corelation with exHSP60.
Indones Biomed J. 2013; 5(1): 37-42 DOI: 10.18585/inabj.v5i1.49
were inverse correlation between exHSP60 and anti-HSP60 antibody to HOMA-IR.
Figure 3 shows the dynamic correlation of exHSP60 with HOMA-IR in nondiabetic subjects in each group, indicating that in obese (WC > 100 cm) group, exHSP60 was higher at HOMA-IR ≤ 2 compared with HOMA-IR > 2. Higher WC tended to increase exHSP60 in subjects with HOMA-IR ≤ 2.
Discussion
Obesity, which is known as enlargement of adipose tissue to store excess energy intake, is developed by two mechanisms: hyperplasia (increase number of cells) and hypertropy (increase size of cells).(18) Hyperplasia and hyperthrophy of adipose tissues are associated with adipose function abnormality such as reticulum endoplasmic stress and mitochondrial stress.(6) Adipose tissue in obesity plays a role as inflammatory source that exhibits low grade inflammation, and together with oxidative stress and hypoxia induce mitochondrial stress.(19) HSP60 is the primary molecular chaperone dominating the mitochondrial matrix, on which some studies have shown clearly that HSP60 is induced by unfold protein response in UPRmt.(20,21,22) Zhao, et al. have found that accumulation of unfold protein
in mitochondrial matrix can upregulate genes which encode mitochondrial stress proteins like HSP60.(23) HSP60 acts both as self and foreign autoantigen to B cells, suggesting that activation of exHSP60 can act as a ligand to stimulate TLR and B cells receptors and produce HSP60 antibody. (24-27)
In this study we found that there was a dynamic correlation, although not significant, between exHSP60 and anti-HSP60 antibody in group of WC ≤ 90 cm (r=-0.161,
p=0.248), 90 cm < WC ≤ 100 cm (r=0.111, p= 0.396) and
WC > 100 cm (r=-0.182, p=0.363). Results also showed
that there was a dynamic correlation between exHSP60 and HOMA-IR in group of WC ≤ 90 cm (r=0.281, p=0.041),
90 cm < WC ≤ 100 cm (r=0.066, p=0.611), WC > 100 cm
(r=-0.508, p=0.007). This suggest that adipogenesis reduced
the number of dead adipocytes that occurred in WC > 100 cm group, through the mechanism of hyperplasia instead of hypertrophy, which would affect to the decreased production of HSP60.(28,29)
Figure 1 and 2 show that there was an inverse correlation of exHSP60 and anti-HSP60 antibody with HOMA-IR, in accordance with the role of antibody on antigen that blocks the interaction between exHSP60 and its receptor.(11) Figure 1 shows that increase of HOMA-IR was followed by increase of exHSP60, and Figure 3 shows
that increased WC could increase exHSP60 in subjects with HOMA-IR ≤ 2. This can be explained by referring to the study of Simar et al. that reported HSP could promote
insulin signaling by reduction of kinase stress activation. In monocytes, induction of HSP was associated with inhibiton of c-Jun N-terminal kinase (JNK) and inhibitor of kB kinase (IKKβ) which decreased serine phosphorylation of insulin receptor substrate 1 (pIRS-1).(30) An opposite opinion was suggested by Marker et al. who mentioned that HSP60 played
a role as a mediator in the development of insulin resistance by several mechanisms such as directly by affecting pIRS-1 or indirectly by increasing proinflammatory(pIRS-10), but our study has shown no significant correlation between exHSP60 and IL-1β as a proinflammatory biomarker, or between exHSP60 and hsCRP, a low grade inflammation biomarker. We suggest that further studies should be carried out to explore the answer to these questions.
Conclusion
This study showed that there was a dynamic correlation between exHSP60 and HOMA-IR in WC ≤ 90 cm group compared with WC > 100 cm group, and there was no significant correlation in all groups between exHSP60 with IL-1β and hsCRP. We also found inverse correlation patterns between exHSP60 and HOMA-IR, and between anti-HSP60 antibody and HOMA-IR in non diabetic subjects
We thank The Prodia Education and Research Institute for the invaluable supports given.
4. Tilg H, Moschen AR. Inflammatory Mechanisms in the Regulation of Insulin Resistance. Mol Med. 2007; 14: 222-31.
5. Boden G. Obesity and Free Fatty Acids (FFA). Endocrinol Metab Clin North Am. 2008; 37: 635-47.
6. De Ferranti S, Mozaffarian D. The Perfect Storm: Obesity, Adipocyte Dysfunction and Metabolic Consequences. Clin Chem. 2008; 54: 945-55.
7. Hu F, Liu F. Mitochondrial Stress; A Bridge between Mitochondrial Dysfunction and Metabolic Disease. Cell Signal. 2011; 23: 1528-33.
8. Hartl FU, Hayer-Hartl M. Molecular Chaperones in Cytosol: From Nascent Chain to Folded Protein. Science. 2002; 295: 1852-8.
9. Quintana FJ, Cohen IR. The HSP60 Immune System Network. Trends Immunol. 2011; 32: 89-95.
10. Marker T, Sell H, Zillessen P, Glode A, Kriebel J, Ouwens DM, et al.
Heat shock protein 60 as a mediator of adipose tissue inflammation and insulin resistance. Diabetes. 2012; 61: 615-25.
11. Kim SC, Stice JP. Chen L, Jung JS, Gupta S, Wang Y, et al. Extracelullar
heat shock protein 60, cardiac myocytes, and apoptosis. Circ Res. 2009; 105: 1186-95.
12. Wellen KE, Hotamisligil GS. Inflammation, stress and diabetes. J Clin Invest. 2005; 115: 1111-9.
13 Hotamisligil GS. Inflammation and Metabolic Disorders. Nature. 2006; 444: 860-7.
14. Lagathu C, Yuan-Charvet L, Bastard JP, Maachi M, Quignard-Boulange A, Capeau J, et al. Long-term treatment with interleukin-1 beta
induces insulin resistance in murine and human adipocytes. Diabetolgia. 2006; 49: 2162-73.
15. Pradhan AD, Manson JE, Rifai N, Buring JE, Ridker PM. C-reactive protein, interleukin 6 and risk of developing type 2 diabetes mellitus. JAMA. 2001; 286: 327-34.
16. Barzilay JI, Abraham L, Heckbert SR, Cushman M, Kuller LH, Resnick HE, et al. The relation of markers of inflammation to the
development of glucose disorders in the elderly (the Cardiovascular Health Study). Diabetes. 2001; 50: 2384-9.
17. Matthews DR, Hosker JP, Rudenski AS, Naylor BA, Treacher DF, Turner RC. Homeostasis model assessment: insulin resistance and beta-cell fuction froma fasting plasma glucose and insulin concentrations in man. Diabetologia. 1985; 28: 412-9.
18. Jo J, Gavrilova O, Pack S, Jou W, Mullen S, Sumner AE, et al.
Hyperyhrophy and/or Hyperplasia: Dynamics of Adipose Tissue Growth. PLoS Comput Biol. 2009; 5: e1000324.
19. Tripathi YB, Pandey V. Obesity and endoplasmic reticulum (ER) stresses. Front immunol. 2012; 3: 240.
20. Corydon TJ, Hansen J, Bross P, Jensen TG. Down-regulation of HSP60 expression by RNA impairs folding of medium-chain acyl-CoA dehydrogenase wild-type and disease-associated proteins. Mol Genet Metab. 2005; 85: 260-70.
21. Martin J. Molecular Chaperones and Mitochondrial Protein Folding. J Bienerg Biomembr. 1997; 29: 35-43.
22. Yoneda T, Benedetti C, Urano F, Clark SG, Harding HP, Ron D. Compartment specifiic perturbation of protein handling activates genes encoding mitochondrial chaperones. J Cell Sci. 2004; 117: 4055-66.
23. Zhao Q, Wang J, Levichkin IV, Stasinopoulos S, Ryan MT, Hoogenraad MJ. A Mitochondrial Stress Response in Mammalian Cells. EMBO J. 2002; 21: 4411-9.
24. Quintana FJ, Solomon A, Cohen IR, Nussbaum G. Induction of IgG3 to LPS via Toll-Like Receptor 4 Co-Stimulation. PLoS ONE. 2008; 3: e3509.
25. Herlands RA, Christensen SR, Sweet RA, Hershberg U, Shlomchik MJ. T Cell Independent and Toll Like Receptor Dependent Antigen Driven Activation of Autorective B Cells. Immunity. 2008; 29: 249-60.
26. Cohen-Sfady M, Nussbaum G, Pevsner-Fischer M, Mor E, Carmi P, Zanin-Zhorov A, et al. Heat Shock Protein 60 Activates β Cells via
The TLR4-MyD88 Pathway. J Immunol. 2005; 175: 3594-602. 27. Cohen-Sfady M, Pevsner-Fischer M, Margalit R, Cohen IR. Heat
Shock Proten 60 via MyD88 Innate Signaling, Protects β Cells From Apoptosis, Spontaneous and Induced. J Immunol. 2009; 183: 890-6.
28. Gupta S, Knowlton AA. HSP60 Traficking in Adult Cardiac Myocytes: role of the exosomal pathway. Am J Physiol Heart Circ Physiol. 2007; 292: 3052-6.
29. Trayhurn P. Adipocyte biology. Obes Rev. 2007; 8 (Suppl 1): 41-4. 30. Simar D, Jacques A, Caillaud C. Heat shock proteins induction reduces