IMPLEMENTATION AND TESTING
5.1 Implementation
This project uses PHP Language with an array as a data structure. Array is
used in every process in this project, starting from storing data as well as
calculation.
The first step in the system, the user enters the data to be tested (data is a
txt file). The input file is a collection of questionnaire data to be tested.
1. <b>Masukkan File yang ingin Diuji </b><br/>
2. <input type='file' name='filename' id="filename" required=""> 3. <br>
4. $myfile = $_FILES['filename']['name'] ;
Line 1-3 is the code to retrieve input data entered by the user. While the
fourth line is used to store data entered by the user. 5. $coba = new TXTFile();
6. $dataTesting= $coba->loadTXT($myfile); 7. $TestingData = explode("\n",$dataTesting);
First line is to call the TXTFile class. The second line is to call the
loadTXT function on the TXTFile class. The loadTXT function will import data
from the input file. And then the last line is to save each sentence questionnaire
from user input by using the explode function to split the text.
After getting all sentences from user input, the next process is to break the
sentence into a word and then perform the preprocessing stage. Perform this stage
in training data and test data. 8. $kataAwal = [];
9. for ($i=0; $i < count($data); $i++) {
10. $kataAwal[$i] = explode(" ",$data[$i]);
11. }
Line 8 is used to create a new array variable to hold the result of splitting
the sentence into words. The nine line is used to perform the looping function as
much as the amount of data sentences. Line 10 is used to store the result of
breaking a sentence into a word.
12. $preproses = $this->preproses($kata); 13. $stemming = stemming($preproses);
14. $pecahKal[$kalimat][$baris]= $stemming;
After getting the word contained in the sentence. The next step is the
preprocessing stage On the line 12, the word will be processed in the preproses
function. In the preproses function there are 3 stages : cleansing, case folding and
stopword removal. In line 13, the word will be processed in the stemming
function. To get the root from the previous preprocess. In the last line, save the
result of preprocessing into new array (2 dimensional array).
After the data is processed at the stemming stage then the next step is to
give weight on each document with TF-IDF.
15. $kataDokTra = []; 16. $kataDokTes = []; 17. $dokumenke = 0;
18. foreach ($pecahKalTra as $key => $kalimat) {
19. $kataDokTra[$no][$dokumenke]=this->cekKataDokumen($kata, $kalimat);
20. $dokumenke++; 21. }
22.
23. foreach ($pecahKalTes as $key => $kalimat) {
24. $kataDokTes[$no][$dokumenke]=$this->cekKataDokumen($kata, $kalimat);
25. $dokumenke++; 26. }
Lines 18 through 21 are used to find the frequency of word occurrences in
training documents in each document (TF). each word will be compared by using
cekKataDokumen function. The result will be saved in a new array.
While lines 23 to 26 are the same as the previous process, the only
difference in the data being processed is the test data.
27. $Dokumen = count($pecahKalTes) + count($pecahKalTra); 28. $Ddf[$no] = $Dokumen / $Df[$no];
29. $Ddf[$no] = round($Ddf[$no],3); 30.
On lines 27 - 29 will search for the total number of occurrences of word in
all processed documents. Line 31-32 will calculate the idf value of each word in
the document. 33. $no = 0;
34. foreach ($kataStem as $value1) { 35. $kolomke = 0;
36. foreach ($kataWTes[$no] as $value2) {
37. $nilaiIDFTes[$kolomke] = $nilaiIDFTes[$kolomke] + $value2;
44. foreach ($kataStem as $value1) { 45. $kolomke = 0;
46. foreach ($kataWTra[$no] as $value2) {
47. $nilaiIDFTra[$kolomke]= $nilaiIDFTra[$kolomke] + $value2;
48. $kolomke++;
49. }
50. $no++; 51. }
Then calculate the sentence weight of the TF-IDF result where line 34-41
calculates the sentence weight of the test data and lines 44-51 calculates the
sentence weight of the training data.
After getting the weight on every sentences. The next step is to calculate
the level of similarity between documents. Where the test data will be compared
the similarity level with the training document. 52. $kolomke = 0;
53. foreach ($kataWTes[$no] as $key => $nilaiKataW) {
54. foreach ($kataWTra[$no] as $key => $nilaiKataBaru) { 55. $nilaiWBaru[$no][$kolomke] = $nilaiKataBaru *
$nilaiKataW;
56. $nilaiWBaru[$no][$kolomke] = round($nilaiWBaru[$no] [$kolomke],3);
57. $kolomke++;
58. }
On line 53-59 will calculate each document in test data multiplied by each
document in training data according to Cosine Similarity formula. 60. $no = 0;
61. foreach ($kataStem as $key => $value1) { 62. $kolomke = 0;
63. foreach ($nilaiWBaru[$no] as $key => $value2) {
64. $nilaiWT[$kolomke] = $nilaiWT[$kolomke] + $value2;
65. $kolomke++;
66. }
67. $no++; 68. }
While the above coding will calculate the total multiplication of test data
with training data. Where will be obtained the total weight.
69. $kolomke = 0;
70. foreach ($kataWTes[$no] as $key => $nilaiKataW) { 71. $vectorTes[$no][$kolomke] = pow($nilaiKataW,2);
77. foreach ($kataWTra[$no] as $key => $nilaiKataW) { 78. $vectorTra[$no][$kolomke] = pow($nilaiKataW,2); 79. $vectorTra[$no][$kolomke] = round($vectorTra[$no]
[$kolomke],3); 80. $kolomke++;
81. }
Lines 70 - 81 are used to calculate the length of vector test documents and
training documents based on the Cosine Similarity formula.
82. $no = 0;
83. foreach ($kataStem as $key => $value1) { 84. $kolomke = 0;
85. foreach ($vectorTes[$no] as $key => $value2) {
86. $vectorWTes[$kolomke] = $vectorWTes[$kolomke] + $value2;
87. $akarWTes[$kolomke] = round(sqrt($vectorWTes [$kolomke]) ,3);
94. foreach ($kataStem as $key => $value1) { 95. $kolomke = 0;
97. $vectorWTra[$kolomke] = $vectorWTra[$kolomke] + $value2;
98. $akarWTra[$kolomke] = round(sqrt($vectorWTra [$kolomke]),3);
99. $kolomke++;
100. }
101. $no++; 102. }
The above code is used to calculate the total results of the length of vector
data training and data testing.
103. for($i=0; $i<count($pecahKalTes); $i++){
The above code are used to obtain results from Cosine Similarity processes
between test documents and training documents. The calculation results will be
saved into the new array.
The next process is to classify the opinions contained in the questionnaire
with the K-Nearest Neighbors algorithm with values already obtained from the
132. }
133. }
134. }
Determine the value of K or how much data the results of Cosine
Similarity taken. Then determine the data that has the highest level of similarity at
the top level. Then look for opinions that are contained from the results of Cosine
Similarity data.
If more negative then the test data will be negative, so also if more positive
then test data is positive. When the positive and negative data are equal, it will be
determined with the highest Cosine Similarity value.
The above code has the function to separate if the number of values of K is
even or odd. If odd, then the data will be tested with the odd class function and if
even it will be tested with even class function. The data will be stored in a new
array.
135. $akurasi = $prosesKNN->KNNKesimpulan($KNN,$opiniTesting); 136. $file = "DataHasil_KNN.txt";
137. $du = count($dataTesting); 138. $dtra = $jumData;
139. $filename = $myfile;
140. $getData = $filename.";".$du.";".$dtra.";".$nilaiK.";". $posi.";".$nega.";".$waktu.";".$akurasi."\n"; 141. $coba = new TXTFile();
142. $coba->saveAddTXT($file,$getData);
The above code is used to store the results of the classification of the
system that has occurred. Line 135 is used to obtain system accuracy. Row 136 is
used to hold the data to be stored. Rows 141-142 are used to store classification
The first time, the user will input the file to be used as test data (test data in
the form of txt file). After the input file, the user is directed to enter the amount of
training data and the number of K values for the system calculation.
After the user input the file and enter the value. The system will perform
the process automatically. And will display the result of the classification process
of the input entered.
Illustration 5.1: Homepage System
On the ‘Hasil Proses’ tab, you can see the results of the system
classification. Where the data entered will display opinions / responses contained
in the questionnaire data.
On the ‘Akurasi’ tab of the ‘Hasil Proses’, the user can see the results of
system accuracy with K-Nearest Neighbor algorithm. And can see the amount of
positive data and negative data.
Illustration 5.3: Results of system classification
5.2 Testing
To perform testing on the research, test data will be classified manually
from the opinion contained. So it can be compared with training data. After that
searched the value of accuracy from the comparison of opinion data test and
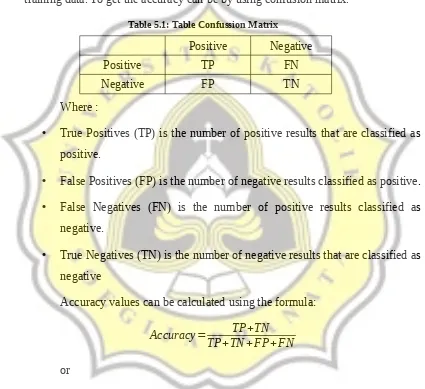
training data. To get the accuracy can be by using confusion matrix.
Table 5.1: Table Confussion Matrix
Positive Negative
Positive TP FN
Negative FP TN
Where :
• True Positives (TP) is the number of positive results that are classified as
positive.
• False Positives (FP) is the number of negative results classified as positive.
• False Negatives (FN) is the number of positive results classified as
negative.
• True Negatives (TN) is the number of negative results that are classified as
negative
Accuracy values can be calculated using the formula:
Accuracy= TP+TN TP+TN+FP+FN
or
5.2.1 First Testing
In the first test, the author try to test the effect of the value of K in the
calculation of the system.
Test Data : 20 Data
Data Training : 200 Data (100 positive opinions and 100 negative opinions)
Test data are same and training data used is the total of all the amount of
training data. It aims to make the data valid and unchanged.
Test results as follows:
Illustration 5.5: Table Number of K values
Illustration 5.6: Chart K Value 1 2 3 4 5 6 7 8 9 10 65
70 75 80 85 90
From the first testing results with different K values will produce different
levels of accuracy. The value of K tested from 1 - 10. From the calculation results,
the accuracy of the system successfully obtained ranges from 70% to 90%. From
the above table it can be concluded that the difference in the number of K values
will affect the results of system accuracy and the use of the best value of K is the
value of K with the number of 2, 4, 5, and 7 which has an accuracy of 85% with
the ratio of positive and negative opinions 55:45. The reason for not choosing the
values of K8 and 9, is the unbalanced comparison of negative and negative
opinions. Where is the comparison of positive and negative opinions 60:40.
5.2.2 Second Testing
In the second test, the author tries to test the influence of the amount of
training data used in the system calculation.
Test Data : 20 Data
Value of K : 3
Test data and value of K used the same. It aims to keep the data valid and
unchanged.
Illustration 5.8: Chart Effect of amount of training data 10 20 30 40 50 60 70 80 90 100 150 200 0
10 20 30 40 50 60 70 80 90
Accuracy (%)
Illustration 5.9: Chart Duration of Process Time 10 20 30 40 50 60 70 80 90 100 150 200 0
20 40 60 80 100 120
From the second testing result to know the effect of difference of amount
of training data on result of system accuracy. It can be seen that the amount of
different training data will affect the results of accuracy and time used in the
calculation system. Training data tested between 10 - 200 data. The value of
accuracy increases with the increase in the amount of training data being tested
because the more training data is used, the more varied the words contained
therein. The length of time required to process is also influenced by the amount of