251
Reducing Inequality of Opportunities
in West African Urban Labor Markets:
What Kinds of Policy Matter?
Laure Pasquier-Doumer
African labor markets are compartmentalized into segments with diff erent structures and mechanisms in terms of wages, job prospects, and job security (Brilleau, Roubaud, and Torelli 2005; Kuépié, Nordman, and Roubaud 2009; see chapter 6 of this book). For on understanding of the dynamics of the African labor market, it is therefore vital to understand what determines access to the diff erent segments.
Th e more labor market positioning depends on social origin, the less the prin-ciple of equal opportunities defi ned by Rawls (1971) is respected. Th is principle reads as follows: “Assuming there is a distribution of natural assets, those who are at the same level of talent and ability, and have the same willingness to use them, should have the same prospect of success regardless of their initial place in the social system” (p. 104). In addition to meeting a social justice goal, equality of opportunity in the labor market fulfi lls an economic effi ciency function. Indeed, the World Development Report 2006: Equity and Development (World Bank 2005) identifi es the reduction of unequal opportunities as a core development policy issue. Reducing inequalities of opportunity in the labor market improves the allocation of human capital, directing it to where its returns are highest.
Th e economic and sociological literature fi nds a number of mechanisms at work behind the intergenerational transmission of labor market position. Par-ents’ occupational status can directly aff ect their children’s occupational status through the transmission of physical capital, human capital, and social capital. In a credit-constrained environment, the inheritance of physical capital increases access to socioeconomic groups that require an initial investment (Banerjee and Newman 1993). Human capital can take various forms. One is knowledge of a trade (know-how). Another is information, including knowl-edge of a professional environment, knowlknowl-edge of the optimal actions to take
within it, and knowledge of one’s ability to work in certain occupations. Trans-mission of this human capital can lead individuals to choose the same occupa-tion as their parents (Galor and Tsiddon 1997; Hassler and Mora 2000; Sjögren 2000). Parents also build social capital in the course of their work, in particular a social network and professional values that they can pass on to their children, making it easier for them to enter the profession in question (Lin, Vaughn, and Ensel 1981).
Parents’ occupational status can also indirectly infl uence their children’s position in the labor market by aff ecting the children’s level of education. Many studies show that social origin is decisive in the acquisition of education, par-ticularly as a result of capital market imperfections and the intergenerational transmission of abilities (see Haveman and Wolfe [1995] for a review of the literature on this subject). Parents’ occupational status can condition both the resources they have available to educate their children and their children’s moti-vation to study and the returns expected from that education.
Th e purpose of this chapter is twofold. First, it compares the extent of inequality of labor market opportunities in seven West African commercial capitals: Abidjan, Bamako, Cotonou, Dakar, Lomé, Niamey, and Ouagadougou. Th e extent of inequality of opportunities is defi ned here as the net association between individuals’ labor market positions and their fathers’ positions, irrespec-tive of structural labor market eff ects. Th is comparison identifi es the character-istics of the cities with the highest levels of inequality of opportunity, providing a basis for assessing theories explaining these diff erences.
Second, for each city, the chapter estimates the extent to which the eff ect of fathers’ occupational status is direct or indirect (through education). Th e public policy implications are extremely diff erent in the two cases. In the fi rst case, opportunity leveling policies need to focus directly on the labor market. In the second case, they need to focus upstream, on the education system.
Comparative studies of the inequality of opportunities and social mobility take a quantitative sociology approach, seeking to evaluate which factors explain cross-country diff erences. Because data are thin on the ground, there are almost no comparative studies of developing countries. Most studies look at devel-oped countries (Erikson and Goldthorpe 1992). Only a few include develop-ing countries in their databases (Grusky and Hauser 1984; Ganzeboom, Luijkx, and Treiman 1989), and the studies that do include them apply the same social stratifi cation used for developed countries. As numerous authors show, this stratifi cation does not consider the particularity of labor markets in developing countries, where the informal sector predominates (Benavides 2002; Pasquier-Doumer 2005). Specifi c studies of developing countries are therefore needed to take account of the labor market structure in these countries.
Although Africa has the largest income inequalities in the world aft er Latin America (World Bank 2005), to our knowledge, only three comparative studies
of the dynamics of these inequalities have been conducted in Africa (Bossuroy and Cogneau 2008; Cogneau and others 2007; Cogneau and Mesplé-Somps 2008). All draw on the same data, from representative surveys of fi ve African countries: Côte d’Ivoire, Ghana, Guinea, Madagascar, and Uganda. Th e fi rst two studies look at social mobility; the third focuses on inequality of income opportunity. All run up against a comparability problem, because diff erent sur-veys use diff erent occupational classifi cations, forcing the authors to aggregate occupations into just two groups, agricultural and nonagricultural activities. Lack of comparability is a major problem in most comparative studies of this kind, as Björklund and Jäntti (2000) show.
Th e 1-2-3 survey data (described in box O.1 in the overview) off er both highly detailed information on fathers’ occupational status and excellent com-parability. Th ey can therefore be used to conduct a detailed analysis of the inequality of opportunities, incorporating a number of labor market aspects, including institutional sector and socioeconomic group.
Th is chapter is organized as follows. Th e fi rst section describes the data. Th e second section compares the degree of inequality of opportunities in access to institutional sectors in seven cities. Th e third section examines the role of edu-cation in inequality of opportunities. Th e last section draws some conclusions.
The Data
Th is study examines the commercial capitals of the seven French-speaking countries in the West African Economic and Monetary Union (WAEMU): Benin, Burkina Faso, Côte d’Ivoire, Mali, Niger, Senegal, and Togo. Benin, Côte d’Ivoire, Senegal, and Togo are coastal countries, with a higher level of wealth on the whole than the landlocked countries of Burkina Faso, Mali, and Niger. Th e human development index draws an even sharper distinction between the two groups of countries (see annex table 8A.1).
Th e data used for each country are drawn from Phase 1 of the 1-2-3 surveys conducted in the commercial capitals of the WAEMU countries in 2001 and 2002. Th e surveys indicate the level of education of each respondent’s mother and father, along with the father’s socioeconomic group, business type, and business sector when the respondent was 15.1 It is rare to fi nd such detail on the father’s occupational status in developing countries. Th e wording of the ques-tions and the response opques-tions are identical in all surveys, making a robust and highly detailed comparison possible. Most studies on unequal opportunities have to make a trade-off between detail and comparability.
Th e data do not paint a representative picture of the labor market struc-ture for the entire generation of fathers, as they include the occupational status only of fathers whose children were working in one of the seven West African
commercial capitals at the time of the survey. Nevertheless, they allow for anal-ysis and cross-country comparison of the professional trends of families cur-rently living in the main urban centers. In particular, they reveal the strength of the association between the labor market situation of these cities’ inhabit-ants and their fathers—the measure of inequality of opportunities used in this study.2
Inequality of Opportunities across Cities
Th is section evaluates the extent to which one’s father’s institutional sector access conditions one’s own access to an institutional sector. Th e more conditioned the access is, the higher the degree of inequality of opportunities. Th e section then compares cities on the basis of this criterion, in order to understand what dif-ferentiates cities with the least inequality of opportunities from other cities.
Th e defi nition of institutional sectors used here is designed to refl ect the phenomenon of labor market segmentation (see chapter 6 of this book) in the WAEMU capitals, distinguishing between the formal and informal sector. Indi-viduals are considered part of the informal sector if they work in an unreg-istered business. We do not know whether the business in which the father worked was registered or not. We therefore consider fathers to have worked in the informal sector if they worked in a very small business, an association or other nonprofi t institution, a household, or self-employment. We then separate public and semi-public workers from private sector workers to test the assump-tion that access to the public sector is more condiassump-tioned by social origin than is access to the formal private sector. Th e three sectors considered are therefore the public and semi-public sector, the formal private sector, and the informal sector.
Inequality of opportunities is defi ned as the link between the respondent’s institutional sector and his or her father’s institutional sector, irrespective of the distributions of respondents and fathers. Th is link captures net social mobility, also known as social fl uidity. Social fl uidity measures the change in the relative chances of individuals from diff erent social origins attaining a given social sta-tus. An odds ratios analysis compares cities by level of social fl uidity.
Odds ratios refl ect the outcome of competition to enter one rather than another sector by individuals whose fathers worked in diff erent institutional sectors. More precisely, they represent the relative inequality between two indi-viduals whose fathers worked in sector i and sector i’ in their chances of attain-ing group j’ rather than j. Th e odds ratio is defi ned as
OR n n n n n n n n i i j j ij i i j i j ij i j i j ij − −’’= ’ ’ ’= ’ ’ j’ ’ ’ / / (8.1)
where nijis the number of observations in the cell (i, j) of the transition matrix,
where row i represents the fathers’ three institutional sectors and column j the respondents’ institutional sectors. Th e odds of attaining sector j’ rather than j are ORi i
j j−−’’
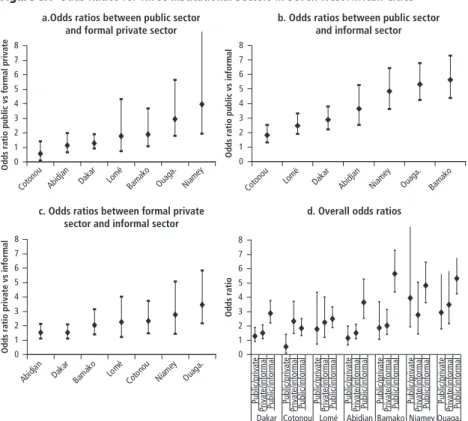
times higher for an individual whose father worked in sector i’ than for an individual whose father worked in sector i. An odds ratio of 1 indicates that having a father in sector i’ secures no comparative advantage over hav-ing a father in sector i when it comes to entering j’. Th e further the odds ratio is from 1, the lower the social fl uidity between two institutional sec-tors. Th e particularity of odds ratios is that they provide a measurement of the statistical association between two variables regardless of the mar-ginal distributions. Figure 8.1 presents the odds ratios for the seven cities.
Comparison of the fi rst three panels of fi gure 8.1, summarized in the last panel, reveals that in most cities, the transition between the public sector and the informal sector is the least socially fl uid: the social distance between these sectors is generally much larger than the social distance between the public sec-tor and the formal private secsec-tor or between the formal private secsec-tor and the informal sector. In most cities, the social distance between the formal private sector and the public sector is roughly the same as the social distance between the formal private sector and the informal sector. In Bamako, for example, an individual whose father worked in the public sector is about six times more likely to enter the public sector than an individual whose father worked in the informal sector and twice as likely as an individual whose father worked in the formal private sector; an individual whose father worked in the formal private sector is about twice as likely to work in the formal private sector as one whose father worked in the informal sector. Th e social distances between the formal private sector and the informal sector are not signifi cantly diff erent across cities, with the exception of Ouagadougou, where the social distance is signifi cantly larger than in Abidjan or Dakar.
In terms of social fl uidity between the public sector and the formal private sector, two contrasting groups of cities are found: Niamey and Ouagadougou post signifi cantly higher social rigidity than Cotonou, Abidjan, and Dakar. In Niamey, having a father who worked in the public sector increases the chance that an individual works in the public sector by four times as much as having a father in the formal private sector. Th is ratio is a mere 1.1 in Abidjan, indicating virtual equality of opportunities of entering the formal private sector among individuals of public sector and private sector “origin.” Lomé and Bamako stand at the boundary between the two groups.
Th e same groups are found when looking at fl uidity between the public sector and the informal sector, except in Bamako, which joins the group of least fl uid cities. In Cotonou, Lomé, and Dakar, the odds ratio averages 2.4; in Niamey, Ouagadougou, and Bamako, it averages 5.3.
Uniform diff erence log-multiplicative (unidiff ) modeling, developed by Erik-son and Goldthorpe (1992) and Xie (1992), is used to summarize these fi ndings and propose an ordering of the cities covering all three dimensions. Th is model-ing provides a composite measure of how the association between two qualita-tive variables—the respondent’s sector and the father’s sector—diff ers depending on a third variable, the city, regardless of the categories of the two qualitative variables considered. Th is composite measure is called the b, or intensity, param-eter.3 Th e change in the intensity parameter therefore represents the intercity variation in social inequalities in access to an institutional sector.
Th e parameter value for Dakar is set at 1. A parameter above (below) 1 repre-sents a stronger (weaker) intensity of unequal opportunities. All the odds ratios between Dakar and the other city considered and for the three institutional
d. Overall odds ratios
Odds ratio 0 1 2 3 4 5 6 7 8 Public/private
Private/informal Public/informal Public/private Private/informal Public/informal Public/private Private/informal Public/informal Public/private Private/informal Public/informal Public/private Private/informal Public/informal Public/private Private/informal Public/informal Public/private Private/informal Public/informal Dakar Cotonou Lomé Abidjan Bamako Niamey Ouaga.
a.Odds ratios between public sector and formal private sector
0 1 2 3 4 5 6 7 8
Cotonou Abidjan Dakar Lomé Bamako Ouaga. Niamey
Odds ratio public vs formal private
b. Odds ratios between public sector and informal sector
0 1 2 3 4 5 6 7 8
Odds ratio public vs informal
Cotonou Lomé Dakar Abidjan Niamey Ouaga. Bamako
c. Odds ratios between formal private sector and informal sector
0 1 2 3 4 5 6 7 8
Odds ratio private vs informal
Abid jan Daka r Bama ko Lom é Coto nou Niame y Ouaga .
Figure 8.1 Odds Ratios for Three Institutional Sectors in Seven West African Cities
Sources: Based on Phase 1 of the 1-2-3 surveys of selected countries in the West African Economic and Monetary Union (WAEMU) conducted in 2001/02 by the Observatoire économique et statistique d’Afrique Subsaharienne (AFRISTAT); Développement, Institutions et Mondialisation (DIAL); and national statistics institutes.
Note: Figures are for individuals 35 and older. For each city, the median, represented by a diamond, corresponds to the odds ratio. The lower and upper limits, represented by the horizontal bars, correspond to the limits of a 90 percent confidence interval. Ouaga. = Ouagadougou.
sectors are assumed to increase with the same intensity bj. Th e signifi cance of
the diff erences between each of the parameters was systematically tested and used to defi ne groups of cities.
Inequality of opportunity in access to institutional sectors diff ers widely across the seven cities (fi gure 8.2). Two groups of cities emerge. Th e fi rst is made up of the coastal cities of Abidjan, Cotonou, Dakar, and Lomé. Th e sec-ond comprises Bamako, Niamey, and Ouagadougou.4 Th e level of inequality of opportunity in these cities is nearly two-thirds higher than in the cities in the fi rst group. Abidjan and Bamako form a grey area between the two groups.5
Th e cities in the group with the least social fl uidity are the capitals of coun-tries that share certain characteristics (see annex table 8A.1). Burkina Faso, Mali, and Niger are landlocked countries. Th ey have the lowest human development index rankings of the seven countries studied, the lowest levels of education and literacy, and the highest rates of mortality and malnutrition. Urbanization is lower in these countries, and their fertility index rankings are at least one point higher than the other four countries.
Th ese fi ndings are consistent with the liberal theory of social mobility, which states that the more industrialized a society, the more meritocratic the labor
Sources: Based on Phase 1 of the 1-2-3 surveys of selected countries (see table 8.1 for details).
Note: Figures are for individuals 35 and older. The circles aggregate cities’ intensity parameters that are not significantly different from one another.
Figure 8.2 Parameters of Intensity of Link between Institutional Sector of Individuals and Their Fathers
Unidiff model beta parameters
Dakar Cotonou 0 0.2 0.4 0.6 0.8 1.0 1.2 1.4 1.6 1.8
market selection criteria, because the increase in the demand for skilled labor and urbanization prompt geographic mobility and reduce the feeling of com-munity (Parsons 1960; Blau and Duncan 1967; Treiman 1970).
The Role of Education in Inequality of Opportunities
Th e above analysis provides no information on the causal link between the father’s institutional sector and his children’s sector. Is the eff ect direct, or does the father’s occupation aff ect other characteristics, such as the children’s level of education, which in turn infl uences access to an institutional sector?
Th is section considers a broader defi nition of social origin that includes place of birth and ethnic group and takes into account the individual’s level of education. It seeks to clarify the channel through which social origin aff ects access to an institutional sector.
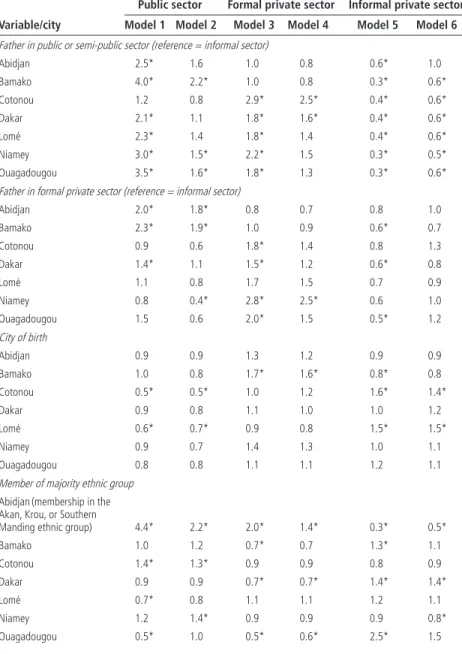
We start by estimating a logit model for each city to explain the probability of entering one institutional sector rather than the two others based on four aspects of social origin (father’s institutional sector, whether the father went to school, individual’s place of birth, and individual’s ethnic group) while control-ling for gender. Model 1 describes access to the public sector, model 3 access to the formal private sector, and model 5 access to the informal sector. Ethnic group is measured as membership in the city’s majority ethnic group, except in Abidjan, where we look at membership in the Akan, Krou, and Southern Man-ding ethnic groups, in order to test the hypothesis of a social division of labor based on “ivoirité” (see chapter 9).6 We then estimate the same models including the respondents’ levels of education (models 2, 4, and 6). If social origin still has a signifi cant eff ect in these models, we conclude that it has a direct eff ect on access to the institutional sectors. If the eff ect is no longer signifi cant, we conclude that the eff ect of social origin is indirect. Table 8.1 presents the odds ratios obtained from estimation of the 42 (6 × 7) models.
Access to the Public Sector
In the least fl uid cities (Bamako, Niamey, and Ouagadougou), the father’s insti-tutional sector has an eff ect on entry into the public sector, irrespective of its impact on the level of education (model 2). In these cities, other things equal, having a father who worked in the public sector rather than the informal sector increases the chances of working in the public sector by a factor of 2.2 in Bamako, 1.6 in Ouagadougou, and 1.5 in Niamey. In the capitals of the three landlocked countries, the father’s occupational status thus has a direct eff ect on access to the public sector through a mechanism other than education (knowledge of the pro-fessional environment, know-how, penchant for the public sector, and so forth).
Table 8.1 Logit Estimation of Effects of Social Origin on Access to Public, Formal Private, and Informal Sectors in Seven Cities in West Africa, 2001/02
Variable/city
Public sector Formal private sector Informal private sector Model 1 Model 2 Model 3 Model 4 Model 5 Model 6
Father in public or semi-public sector (reference = informal sector)
Abidjan 2.5* 1.6 1.0 0.8 0.6* 1.0 Bamako 4.0* 2.2* 1.0 0.8 0.3* 0.6* Cotonou 1.2 0.8 2.9* 2.5* 0.4* 0.6* Dakar 2.1* 1.1 1.8* 1.6* 0.4* 0.6* Lomé 2.3* 1.4 1.8* 1.4 0.4* 0.6* Niamey 3.0* 1.5* 2.2* 1.5 0.3* 0.5* Ouagadougou 3.5* 1.6* 1.8* 1.3 0.3* 0.6*
Father in formal private sector (reference = informal sector)
Abidjan 2.0* 1.8* 0.8 0.7 0.8 1.0 Bamako 2.3* 1.9* 1.0 0.9 0.6* 0.7 Cotonou 0.9 0.6 1.8* 1.4 0.8 1.3 Dakar 1.4* 1.1 1.5* 1.2 0.6* 0.8 Lomé 1.1 0.8 1.7 1.5 0.7 0.9 Niamey 0.8 0.4* 2.8* 2.5* 0.6 1.0 Ouagadougou 1.5 0.6 2.0* 1.5 0.5* 1.2 City of birth Abidjan 0.9 0.9 1.3 1.2 0.9 0.9 Bamako 1.0 0.8 1.7* 1.6* 0.8* 0.8 Cotonou 0.5* 0.5* 1.0 1.2 1.6* 1.4* Dakar 0.9 0.8 1.1 1.0 1.0 1.2 Lomé 0.6* 0.7* 0.9 0.8 1.5* 1.5* Niamey 0.9 0.7 1.4 1.3 1.0 1.1 Ouagadougou 0.8 0.8 1.1 1.1 1.2 1.1
Member of majority ethnic group
Abidjan(membership in the Akan, Krou, or Southern
Manding ethnic group) 4.4* 2.2* 2.0* 1.4* 0.3* 0.5*
Bamako 1.0 1.2 0.7* 0.7 1.3* 1.1 Cotonou 1.4* 1.3* 0.9 0.9 0.8 0.9 Dakar 0.9 0.9 0.7* 0.7* 1.4* 1.4* Lomé 0.7* 0.8 1.1 1.1 1.2 1.1 Niamey 1.2 1.4* 0.9 0.9 0.9 0.8* Ouagadougou 0.5* 1.0 0.5* 0.6* 2.5* 1.5
Gender (reference = female) Abidjan 2.3* 1.2 4.6* 3.6* 0.2* 0.3* Bamako 1.6* 1.1 6.8* 6.2* 0.3* 0.3* Cotonou 3.1* 1.6* 4.8* 3.0* 0.2* 0.3* Dakar 2.0* 1.6* 4.1* 4.2* 0.2* 0.2* Lomé 3.4* 1.8* 5.8* 4.0* 0.2* 0.3* Niamey 1.8* 1.3 4.6* 3.8* 0.3* 0.4* Ouagadougou 2.1* 1.6* 2.9* 2.6* 0.3* 0.4*
Father attended school
Abidjan 1.2 0.7 2.0* 1.7 0.5* 0.7 Bamako 1.5* 0.9 1.3 1.2 0.6* 0.9 Cotonou 2.1* 1.2 1.2 0.7 0.5* 1.1 Dakar 1.6* 1.4* 1.8* 1.5 0.5* 0.6* Lomé 1.1 0.6* 1.6* 1.3 0.7* 1.2 Niamey 1.7* 0.9 1.3 1.0 0.5* 1.1 Ouagadougou 1.1 0.7 1.6 1.3 0.7* 1.3
Completed primary school or incomplete lower-secondary school (reference = less than completed primary school)
Abidjan — 5.5* — 2.6 — 0.3* Bamako — 3.4* — 1.4 — 0.5* Cotonou — 5.1* — 2.2 — 0.3* Dakar — 5.2* — 2.0 — 0.3* Lomé — 3.4* — 2.5 — 0.3* Niamey — 4.8* — 2.8 — 0.2* Ouagadougou — 6.3* — 2.7 — 0.2*
Completed lower-secondary school or above (reference = less than completed primary school)
Abidjan — 25.0* — 2.8 — 0.9* Bamako — 19.9* — 2.3 — 0.1* Cotonou — 17.2* — 7.4 — 0.0* Dakar — 13.2* — 2.9 — 0.1* Lomé — 13.5* — 3.4 — 0.1* Niamey — 18.1* — 3.3 — 0.0* Ouagadougou — 24.5* — 3.5 — 0.0*
Sources: Based on Phase 1 of the 1-2-3 surveys of selected countries (see figure 8.1 for details).
Note: Figures are for individuals 35 and older. The interpretation of a cell is the following: In model 1, for Dakar, having a father in the public sector increases the odds of working in the public sector by 2.1 compared with having a father in the informal sector. This means that other things equal, the probability of working in the pub-lic sector divided by the probability of not working in the pubpub-lic sector increases by 110 percent when the father worked in the public rather than the informal sector. — = not available.
* significant at the 10 percent level. Table 8.1 (continued)
Public sector Formal private sector Informal private sector Variable/city Model 1 Model 2 Model 3 Model 4 Model 5 Model 6
In the more fl uid cities (Abidjan, Cotonou, Dakar, and Lomé), having a father who worked in the public sector has no direct eff ect on access to the public sec-tor: once its eff ect on the level of education has been taken into account, the father’s institutional sector is no longer a determinant of entry into the public sector.7 We can therefore conclude that in Abidjan, Cotonou, Dakar, and Lomé, the father’s institutional sector plays an indirect role in providing access to the public sector by determining the level of education. However, other aspects of social origin also come into play.
In Bamako and Niamey, having a father in the formal private sector also has a signifi cant eff ect on accessing the public sector compared with having a father in the informal sector, but the eff ect is positive in Bamako and negative in Niamey. Th ese fi ndings refl ect the short social distance between the formal private and informal sectors in Niamey and between the public sector and the formal private sector in Bamako (see panel d in fi gure 8.1). Th is distance is also apparent when considering other aspects of social origin, level of education, and gender.
In Niamey, inequality of opportunity is exacerbated by the signifi cant role played by ethnicity in access to the public sector. Everything else equal, belong-ing to the Djerma ethnic group increases the probability of enterbelong-ing the public sector and signifi cantly decreases the probability of entering the informal sector (model 6). Although the Djerma are a minority in Niger, they live in the western part of the country and are consequently the majority ethnic group in Niamey. Th e Djerma are also the fi rst to have taken up senior positions in the colonial administration and army. Moreover, the leaders of Niger from independence through 1993 came from this ethnic group.
Ethnic group also has a signifi cant eff ect on access to the public sector in Abidjan: members of the Akan, Krou, and Southern Manding ethnic groups are 2.2 times as likely to work in the public sector as members of the Northern Manding or Voltaic ethnic groups. Th ey are also more likely to work in the for-mal private sector and less likely to work in the inforfor-mal sector (models 4 and 6, respectively). Th ese fi ndings are consistent with the theory of a social division of labor based on ivoirité, which separates the “native” ethnic groups of the south from the “nonnative” ethnic groups of the north of CÔte d’Ivoire.8
Th e public sector in Cotonou and Lomé is more open to migrants (defi ned here as people born outside the city) than to nonmigrants, other things equal. Th is fi nding runs counter to the expectation that being born in the city gener-ates social capital that fosters entry into the public sector. It could be interpreted as favoritism toward people from certain regions. People from Kozah, the home prefecture of presidents Gnassingbé Eyadéma and Faure Gnassingbé (presidents of Togo since 1967), are overrepresented in Togo’s public sector, and people from Natitingou, the department where Mathieu Kérékou (president of Benin, 1972–91 and 1996–2006) was born, are overrepresented in the public sector in
Benin. In Cotonou, the inequality of opportunities by region of birth is com-pounded by a signifi cant ethnic group eff ect on access to the public sector: other things equal, members of the Fon, the majority ethnic group in Cotonou, are 1.3 times as likely as members of other ethnic groups to work in the public sector.
In four of the seven cities—Cotonou, Dakar, Lomé, and Ouagadougou— women are less likely to work in the public sector than men, other things equal. Access to the Formal Private Sector
Among the least fl uid cities (Bamako, Niamey, and Ouagadougou), only Nia-mey reveals the direct eff ect of the father’s labor market position on access to the formal private sector: having a father who worked in the formal private sec-tor increases the chances of working in it oneself by a facsec-tor of 2.5 (model 4). In Bamako and Ouagadougou, other aspects of social origin condition access to the formal private sector. In Bamako, being born in the city signifi cantly increases access to the formal private sector. One interpretation of this fi nding is that being born in Bamako—and implicitly having spent most of one’s life there—promotes the development of the social network required to enter the formal private sector. In Ouagadougou, everything else equal, the Mossi have less chance of entering the formal private sector than other ethnic groups, and they are overrepresented in the informal sector (model 6).
Among the most fl uid cities (Abidjan, Cotonou, Dakar, and Lomé), the father’s institutional sector has no direct eff ect on access to the formal private sector in Abidjan and Lomé. Th is result does not hold in Cotonou and Dakar: everything else equal, people whose fathers worked in the public sector are 2.5 times more likely to work in the formal private sector in Cotonou and 1.6 times more likely to do so in Dakar. Th is fi nding suggests the presence of an intergenerational bridge from the public to the private sector. No signifi cant eff ect is found for the other aspects of social origin, except in Dakar, where, as in Ouagadougou, belonging to the majority ethnic group reduces the probability of entering the formal private sector and increases the chances of working in the informal sector.
Women in all seven cities are at a disadvantage relative to men when it comes to entering the formal private sector.
Access to the Informal Sector
Irrespective of the level of education, having a father who worked in the informal sector increases the probability of doing so oneself, except in Abidjan, where it has no signifi cant direct eff ect. Th e eff ect of ethnicity diff ers across countries: it has no eff ect in Bamako, Cotonou, and Lomé; is signifi cantly positive in Dakar and Ouagadougou; and is signifi cantly negative in Abidjan and Niamey. Being born in the city increases the probability of working in the informal sector in Cotonou and Lomé. Th is eff ect is the counterpart of the negative eff ect of birth
in the city on access to the public sector. In all cities, everything else equal, women have a higher probability of working in the informal sector than men.
Conclusion
Th is study uses perfectly comparable data to show that social origin in the seven West African capitals considered plays a decisive role in determining the sec-tor of the labor market in which individuals work. Not all cities present the same level of inequality of opportunities: cities in the three landlocked countries with the lowest levels of human development and wealth (Bamako, Niamey, and Ouagadougou) have higher levels of inequality of opportunity than the coastal cities (Abidjan, Cotonou, Dakar, and Lomé). On average, the level of inequality of opportunity in access to an institutional sector is nearly two-thirds higher in Bamako, Niamey, and Ouagadougou than in Cotonou, Dakar, Lomé, and Abidjan. Th is ordering of cities into two groups is robust to the choice of the outcome variable considered (institutional sector, socioeconomic group, and level of education).9
For the four coastal cities, the intergenerational channels for the transmission of inequality are mainly indirect. Entering the public or the formal private sec-tor depends crucially on the level of education, which is aff ected by the fathers’ occupational status. In Bamako, Niamey, and Ouagadougou, fathers’ occupa-tional status also has a direct eff ect on the probability of working in the public sector (in Niamey it also aff ects entry into the formal private sector). Th is direct intergenerational transmission could refl ect the existence of inheritable social or information capital that parents have built up as a result of their position in the labor market. In all cities, the likelihood of working in the informal sector is much greater, other things equal, if one’s father worked in the informal sector.
A policy to reduce inequality of educational opportunities in Cotonou, Dakar, Lomé, and Abidjan would greatly reduce the inequality of opportunities in access to diff erent institutional sectors. In Bamako, Niamey, and Ouagadou-gou, however, such a policy would fall short of the mark if the observed direct eff ect of the father’s position refl ects inheritable social or information capital that parents build up as a result of their position in the labor market. In the long run, leveling the educational playing fi eld through extensive changes to society’s standards and values could reduce the direct eff ect of fathers’ status on labor market position.
Occupational status is not the only aspect of social origin that aff ects labor market position. In Abidjan, Dakar, Niamey, and Ouagadougou, ethnicity aff ects labor market position, even aft er controlling for migrant status. Belong-ing to the Djerma group in Niamey and the Akan, Krou, and Southern MandBelong-ing groups in Abidjan signifi cantly raises the chances of entering the public sector
or being a wage earner and reduces the probability of working in the informal sector. In Dakar and Ouagadougou, belonging to the largest ethnic group in the city reduces the chances of entering the formal private sector or being a wage earner and increases the likelihood of working in the informal sector. In Bamako, Cotonou, and Lomé, migrant status aff ects labor market position. Relative to nonmigrants, migrants are more likely to work in the public sector and wage jobs in Cotonou and Lomé; in Bamako, they are less likely to work in the formal private sector.
Policies in three areas could increase equality of opportunity in the choice of sector: improving the supply of education, increasing demand for education, and developing the labor market. Specifi c policies are identifi ed below.
Improving the Supply of Education
1. Prioritize the poor in public education spending. Public education spending in Africa does not prioritize the disadvantaged (Boudon 2006). To remedy this situation, some countries, such as Burkina Faso, have defi ned school catchment areas to identify areas and populations not served by school ser-vices and then made more equitable investment choices in terms of new establishments and teacher allocations. Th is practice is far from widespread, however. Other countries—including many English-speaking countries as well as Benin, Madagascar, and Rwanda—have adopted new methods of allocating educational resources, such as providing subsidies per pupil to cover nonwage expenses. In South Africa, a higher per pupil subsidy is allo-cated to schools educating poor children or loallo-cated in poor areas, and the teacher-to-pupil ratio is higher in disadvantaged schools. Th ese measures have helped reduce the huge inequalities that existed under apartheid 2. Make school more aff ordable by phasing out fees in primary school. One of
the fi rst African countries to eliminate primary school fees was Malawi, in 1991. Th e eff ects were immediate: school enrollment rose from 1.9 million in 1993/94 to 2.9 million in 1999/2000 (Al-Samarrai and Zaman 2007). Uganda followed suit in 1997, posting a comparable increase in enrollment. Many countries have followed their lead since, including Cameroon in 1999, Tanzania in 2001, Zambia in 2002, Madagascar in 2003, and Burundi in 2005. Th is reform has increased school enrollment rates in all these coun-tries, particularly among the poorest children and children in rural areas. It has not had a positive impact on pupil retention among the poor, however, mainly because of a sharp downturn in the quality of education (Oketch and Rolleston 2007), highlighting the importance of implementation.
3. Make the education supply more fl exible and tailor it to the needs of poor pupils by relaxing regulations that impede enrollment (requirement to present a birth certifi cate on fi rst registration or to be registered by the parents, exclusion of
pregnant girls and girls who have given birth); changing the school calendar to bring it into line with the agricultural calendar; and developing specifi c programs for certain disadvantaged groups, including AIDS orphans, child soldiers, disabled children, and others.
4. Ensure access to good education for the most gift ed poor children. Some countries encourage the highest-achieving children to enroll in good schools that will prepare them to enter higher education. Many African countries have prestigious establishments for this purpose—boarding schools and selective middle/secondary schools that groom the best pupils for higher education. Th e fairness of these programs depends on the selection process and whether disadvantaged children and rural children are equitably repre-sented in these establishments. Attempts to introduce quotas (in Tanzania, for example) have rarely been eff ectively or fairly implemented in the long run. Some countries have introduced measures targeting underrepresented groups. India has set up special boarding schools for underrepresented castes. It also runs free boarding schools for girls in rural areas, to encourage them to graduate to secondary education. Cost considerations keep this type of measure thin on the ground in Africa, but eff orts could be made to develop it.
Increasing Demand for Education
1. Reduce the indirect costs of education. A number of programs reduce the indirect costs of education for the poor, in order to stimulate demand for education. Among the most popular are conditional cash transfers and school meal programs. Conditional cash transfers are highly developed in Latin America. Th ey pay a monthly allowance to poor families on the con-dition that they send their children to school. Impact assessments of these programs generally conclude that they signifi cantly raise school enrollment and retention in the school system among the poor (IEG 2011). Projects of this kind are being pilot tested in some African countries, including Ghana, Kenya, Malawi, Mozambique, Nigeria, South Africa, Tanzania, Yemen, Zambia, and Zimbabwe.
Numerous African countries operate school meal programs. Many studies have highlighted the positive impact of this type of action on pupil partici-pation and attendance (Kremer 2003). School meals improve the neediest pupils’ learning capacities and provide an incentive for families to send and keep their children in school. Th ese programs are especially eff ective because they are applied early in the course of education and target schools teaching the largest numbers of very poor and vulnerable children.
2. Improve children’s educability. Th e early childhood years are key to the development of the human brain. Poor hygiene, malnutrition, and abuse in
infancy and early childhood can permanently impair physical, mental, cog-nitive, and emotional development. Programs combining health care, vac-cination, nutrition, and stimulation actions for infants and children under three can help reduce inequalities in cognitive development. Th e earlier these programs begin, the better.
Developing the Labor Market
1. Improve access to information on employment opportunities. Little use is made of formal job-seeking channels in Africa: in the WAEMU capitals, only 10 percent of workers fi nd their jobs through formal job-seeking channels. Th e rate of job-seeker registration with employment agencies is very low, mainly because of the low profi le of such agencies: 65 percent of job- seekers not registered with these agencies are simply unaware of their existence. Making employment agencies more effi cient and raising their profi le would improve equity of access to the labor market.
2. Help the poor access the credit market. If the direct intergenerational trans-mission of labor market position works through the transtrans-mission of physical capital, improving access to the credit market should make for more equal opportunities on the labor market.
3. Help the poor create social networks that will serve job-seeking. More than 60 percent of workers in the WAEMU capitals used their social network to fi nd their job. A policy to develop the poor’s social network would prob-ably reduce the inequality of opportunities in the labor market. One possible course of action would be to develop partnerships between private and pub-lic enterprise and the training bodies that cater to the disadvantaged.
Statistic Benin Burkina Faso Côte d’Ivoire Mali Niger Senegal Togo
Per capita GDP (constant dollars) 313 230 623 208 153 424 248
Gini coeffi cent 0.53 0.56 0.58 0.58 0.58 0.54 0.57
Rural population (percentage of total
population) 58 83 56 70 79 53 67
Human development indicator (rank) 0.420 (158) 0.325 (169) 0.428 (156) 0.386 (164) 0.277 (172) 0.431 (154) 0.493 (141)
Malnutrition weight for age (percentage of
children under 5) 23 34 21 33 40 23 25
Fertility index (births per woman) 6 7 5 7 8 5 6
Mortality rate (per 1,000 inhabitants) 13 18 17 18 22 12 12
Literacy rate (percentage of children 15 and
older) 35 22 49 19 29 39 53
Primary completion rate (percent) 53 27 48 27 27 51 78
Gross intake rate (percent) 99 50 78 61 64 85 100
Sources: Data on GDP, rural population, malnutrition, fertility, and mortality are from World Bank 2000. Data on the Gini coefficient are from Amegashie and others 2005. Data on human development indicator are from UNDP 2002. Data on literacy are from World Bank 2004. Data on primary completion and gross intake are from UNESCO/BREDA 2005.
Note: GDP = gross domestic product.
Notes
1. Age 15 was chosen to ensure that all fathers were more or less in the same part of their life cycle, particularly their working life cycle, and that their job was the one they held just before their children entered the labor market. Comparability between individuals’ work and their fathers’ work is guaranteed when individuals are examined in the same part of their life cycle as their fathers. We therefore removed from the sample all individuals under 35, on the assumption that they had not yet reached the level of professional maturity their fathers had achieved when the individuals were 15. Retaining only the employed workers whose father worked leaves some 1,500 observations per city. Th e nonresponse rates are presented on the companion site to this book, http://www.dial.ird.fr/publications.
2. It would have been useful to compare women’s occupations with their mothers’ occupations, as the mother is potentially the main reference for women. However, too many observations are lost because of mothers’ low labor force participation. Th e methodological choice to use fathers as the benchmark consequently underestimates the mobility of women on the whole.
3. More details on this modeling can be found on the book’s companion site, http:// www.dial.ird.fr/publications.
4. Th is coastal/landlocked city division is robust to the change in the defi nition of the informal sector: if we defi ne the informal sector for respondents in the same way it is defi ned for their fathers (that is, working in a very small business, an association or other nonprofi t institution, a household, or self-employment), Bamako, Niamey, and Ouagadougou still reveal high levels of unequal opportunities compared with Cotonou, Dakar, and Lomé, with Abidjan forming a gray area.
5. In the study by Cogneau and others (2007), Côte d’Ivoire, the only country featured in both that study and this one, has a much higher level of inequality than the two English-speaking countries studied (Ghana and Uganda).
6. Th e Akan are made up mainly of the Baoulé, Agni, and Ebrié. Th e Krou comprise primarily the Bété, Krou, and Bakoué groups. Th e Southern Manding comprises the Guro, Dan, and Gagu groups. Other ethnic groups are the Northern Manding groups (Dioula, Malinké, Koro, and others) and the Voltaic ethnic groups (Kulango, Lobi, Birifor, and others).
7. In Cotonou, however, having a father who worked in the private sector reduces the chances of working in the public sector; in Abidjan, it increases the chances compared with individuals whose fathers worked in the informal sector. Th ese fi nd-ings refl ect more than the intergenerational transmission of labor market position, however. Th ey are a sign of the social distance between sectors, especially the short distance between the public and formal private sectors in Cotonou and the long social distance between the public and informal sectors in Abidjan, where the public and formal private sectors are very close (see panel d in fi gure 8.1).
8. According to Banégas (2007, p. 28), under the fi rst president of Côte d’Ivoire, Felix Houphouët-Boigny, “the economic and social integration of foreigners in urban areas came about relatively easily in the form of a social division of labor, a legacy of the colonial buy-in policy, which could be summed up by the following formula: to the people of Ivoirian ‘extraction’ (the term in use today to describe the populations
of the South) go the salaried jobs in the administration and the large public and semi-public corporations…; to foreigners and Northerners (especially Dioula) go small trade, transport and casual jobs in the informal sector.”
9. Th ese robustness checks are presented on the companion site to this book, http:// www.dial.ird.fr/publications.
References
Al-Samarrai, S., and H. Zaman. 2007. “Abolishing School Fees in Malawi: Th e Impact on Education Access and Equity.” Education Economics 15 (3): 359–75.
Amegashie, F., A. Brilleau, S. Coulibaly, O. Koriko, E. Ouedraogo, F. Roubaud, and C. Torelli. 2005. “La conception et la mise en oeuvre des enquêtes 1–2–3 en UEMOA. Les enseignements méthodologiques.” Statéco 99: 21–41.
Banégas, R. 2007. “Ivory Coast: Th e Young Rise into Men. Anticolonialism and Ultra-nationalism among Patriotic Youth in Abidjan.” Les Études du CERI 137, Center for International Studies and Research, Paris.
Banerjee, A. V., and A. F. Newman. 1993. “Occupational Choice and the Process of Development.” Journal of Political Economy 1011 (2): 274–98.
Benavides, M. 2002. “Class Mobility and Equality of Opportunities in the Context of Erratic Modernization: Th e Peruvian Case.” Ph.D. diss., Department of Sociology, Pennsylvania State University, State College, PA.
Björklund, A., and M. Jäntti. 2000. “Intergenerational Mobility of Socio-economic Status in Comparative Perspective.” Nordic Journal of Political Economy 1: 2–32.
Blau, P., and O. D. Duncan. 1967. Th e American Occupational Structure. New York: Wiley and Sons.
Bossuroy, T., and D. Cogneau. 2008. “Social Mobility and Colonial Legacy in Five Afri-can Countries.” DIAL Working Paper 2008–10, Développement, Institutions et Mon-dialisation, Paris.
Brilleau, A., F. Roubaud, and C. Torelli. 2005. “L’emploi, le chômage et les conditions d’activité dans la principale agglomération de sept états de l’UEMOA: premiers résul-tats de l’enquête emploi 2001–2002.” Statéco 99: 43–63.
Boudon, J. 2006. “Coût et fi nancement de l’éducation primaire en Afrique subsahari-enne.” In Défi s du développement en Afrique subsaharienne: l’éducation en jeu, ed. M. Pilon. Paris: Centre, Population et Développement (CEPED).
Cogneau, D., and S. Mesplé-Somps. 2008. “Inequality of Opportunity for Income in Five Countries of Africa.” Research on Economic in Equality 16: 99–128.
Cogneau D., L. Pasquier-Doumer, T. Bossuroy, P. De Vreyer, C. Guénard, V. Hiller, P. Leite, S. Mesplé-Somps, and C. Torelli. 2007. “Inequalities, and Equity in Africa.” Note et Documents 31, Agence Française de Développement, Paris.
Erikson, R., and J. H. Goldthorpe. 1992. Th e Constant Flux: A Study of Class Mobility in Industrial Societies. Oxford: Clarendon Press.
Galor, O., and D. Tsiddon . 1997. “Technological Progress, Mobility, and Economic Growth.” American Economic Review 87 (3): 363–82.
Ganzeboom, B. G., R. Luijkx, and D. J. Treiman. 1989. “Intergenerational Class Mobility in Comparative Perspective.” Research in Social Stratifi cation, and Mobility 8. Green-wich, CT: JAI Press.
Grusky, D., and R. Hauser R. 1984. “Comparative Social Mobility Revisited: Models of Convergence and Divergence in 16 Countries.” American Sociological Review 49: 19–38.
Hassler, J., and J. R. Mora. 2000. “Intelligence, Social Mobility, and Growth.” American Economic Review 90 (4): 888–908.
Haveman, R., and B. Wolfe. 1995. “Th e Determinants of Children’s Attainments: A Review of Methods, and Findings.” Journal of Economic Literature 33: 1829–78. IEG (Independent Evaluation Group). 2011. Evaluation and Lessons Learned from Impact
Evaluations on Social Safety Nets. Washington, DC: World Bank.
Kremer, M. 2003. “Randomized Evaluations of Educational Programs in Developing Countries: Some Lessons.” American Economic Review 93 (2): 102–06.
Kuépié, M., C. J. Nordman, and F. Roubaud. 2009. “Education and Earnings in Urban West Africa.” Journal of Comparative Economics 37: 491–515.
Lin, N., J. C. Vaughn, and W. M. Ensel. 1981. “Social Resources and Occupational Status Attainment.” Social Forces 59 (4): 1163–81.
Oketch, M., and C. Rolleston. 2007. “Policies on Free Primary and Secondary Education in East Africa: Retrospect and Prospect.” Review of Research in Education 31: 131–58. Parsons, T. 1960. Structure and Process in Modern Societies. Glencoe, IL: Free Press. Pasquier-Doumer, L. 2005. “Perception de l’inégalité des chances et mobilités objective
et subjective: une analyse à partir d’entretiens qualitatifs auprès de Liméniens.” DIAL Working Paper 2005–17, Développement, Institutions et Mondialisation, Paris. Rawls, J. 1971. A Th eory of Justice. Cambridge, MA: Harvard University Press. Sjögren, A. 2000. “Redistribution, Occupational Choice, and Intergenerational
Mobil-ity: Does Wage Equality Nail the Cobbler to His Last?” Working Paper 538, Research Institute of Industrial Economics, Stockholm.
Treiman, D. J. 1970. “Industrialization and Social Stratifi cation.” Sociological Inquiry, Special Issue: Stratifi cation Th eory and Research 40: 207–34.
UNDP (United Nations Development Programme). 2002. Human Development Report. New York: UNDP.
UNESCO/BREDA (United Nations Education, Scientifi c and Cultural Organization/ Regional Bureau for Education in Africa). 2005. Paving the Way for Action. Dakar: UNESCO/BREDA.
World Bank. 2000. World Development Indicators. Washington, DC: World Bank. ———. 2004. World Development Indicators. Washington, DC: World Bank.
———. 2005. World Development Report 2006: Equity and Development. Washington, DC: World Bank.
Xie, Y. 1992. “Th e Log-Multiplicative Layer Eff ect Model for Comparing Mobility Tables.” American Sociological Review 57 (3): 380–95.
Some rights reserved 1 2 3 4 16 15 14 13
Th is work is a product of the staff of Th e World Bank with external contributions. Note that Th e World Bank and the Agence Française de Développement do not necessarily own each component of the content included in the work. Th e World Bank and the Agence Française de Développement therefore do not warrant that the use of the content contained in the work will not infringe on the rights of third parties. Th e risk of claims resulting from such infringement rests solely with you.
Th e fi ndings, interpretations, and conclusions expressed in this work do not necessarily refl ect the views of Th e World Bank, its Board of Executive Directors, or the governments they represent, or the Agence Française de Développement. Th e World Bank does not guarantee the accuracy of the data included in this work. Th e boundaries, colors, denominations, and other information shown on any map in this work do not imply any judgment on the part of Th e World Bank concerning the legal status of any territory or the endorsement or acceptance of such boundaries.
Nothing herein shall constitute or be considered to be a limitation upon or waiver of the privileges and immunities of Th e World Bank, all of which are specifi cally reserved.
Rights and Permissions
Th is work is available under the Creative Commons Attribution 3.0 Unported license (CC BY 3.0) http:// creativecommons.org/licenses/by/3.0. Under the Creative Commons Attribution license, you are free to copy, distribute, transmit, and adapt this work, including for commercial purposes, under the following conditions:
Attribution—Please cite the work as follows: De Vreyer, Philippe, and François Roubaud, Editors. 2013.
Urban Labor Markets in Sub-Saharan Africa. Africa Development Forum series. Washington, DC: World Bank. doi:10.1596/978-0-8213-9781-7. License: Creative Commons Attribution CC BY 3.0
Translations—If you create a translation of this work, please add the following disclaimer along with the
attribution: Th is translation was not created by Th e World Bank and should not be considered an offi cial World Bank translation. Th e World Bank shall not be liable for any content or error in this translation. All queries on rights and licenses should be addressed to the Offi ce of the Publisher, Th e World Bank, 1818 H Street NW, Washington, DC 20433, USA; fax: 202-522-2625; e-mail: [email protected]. ISBN (paper): 978-0-8213-9781-7
ISBN (electronic): 978-0-8213-9782-4 DOI: 10.1596/978-0-8213-9781-7
Cover image: ©Michelle Saint-Léger, IRD, 2013. Cover design: Debra Naylor, Naylor Design, Inc.
Library of Congress Cataloging-in-Publication Data
Vreyer, Philippe De.
Urban labor markets in sub-Saharan Africa/Philippe De Vreyer and François Roubaud. p. cm.
Includes bibliographical references and index.
ISBN 978-0-8213-9781-7 — ISBN 978-0-8213-9782-4 (electronic)
1. Labor market—Africa, Sub-Saharan. 2. Africa, Sub-Saharan—Economic conditions. 3. City dwellers—Employment—Africa, Sub-Saharan. I. Roubaud, François. II. World Bank. III. Title. HD5837.A6V74 2013
331.120967—dc23
2012050217
Th e French translation of this book is copublished by Agence Française de Développement and Institut de Recherche pour le Développement (IRD). Th e IRD, a French public research institute emphasizing interdisciplinarity, has focused its research for more than 65 years on the relationship between man and its environment in Africa, Asia, Latin America, the Mediterranean, and the French tropical overseas ter-ritories. Its research, training, and innovation activities are intended to contribute to the social, economic, and cultural development of southern countries. For further information: www.editions.ird.fr.