Journal of Multinational Financial Management 10 (2000) 161 – 184
The choice of hedging techniques and the
characteristics of UK industrial firms
Nathan Lael Joseph *
Manchester School of Accounting and Finance,Uni6ersity of Manchester,Manchester M13 9PL,UK Received 8 August 1998; accepted 15 April 1999
Abstract
This study presents the empirical results for the relationship between the use of hedging techniques and the characteristics of UK multinational enterprises (MNEs). All the firms in the sample hedge foreign exchange (FX) exposure. The results indicate that UK firms focus on a very narrow set of hedging techniques. They make much greater use of derivatives than internal hedging techniques. The degree of utilisation of both internal and external tech-niques depends on the type of exposure that is hedged. Furthermore, the characteristics of the firms appear to explain the choice of hedging technique but the use of certain hedging techniques appears to be associated with increases in the variability of some accounting measures. This adverse impact of hedging has not been emphasised in the finance literature. The results imply that firms need to ensure that the appropriate techniques are used to hedge exposures. © 2000 Elsevier Science B.V. All rights reserved.
JEL classification:F23; F30; G10
Keywords:Multinational enterprises; Foreign exchange exposure; Hedging techniques
www.elsevier.com/locate/econbase
1. Introduction
Most theoretical studies that seek to explain why industrial firms hedge exposure focus on differences in the financial characteristics of users and non-users of hedging techniques1
. The empirical work which seeks to test the theoretical
predic-* Tel.: +44-161-2754029.
E-mail address:[email protected] (N.L. Joseph)
1For a review of the literature see Levi and Sercu (1991), Nance et al. (1993) and Joseph and Hewins (1997).
tions takes a similar focus. However, the findings for certain hypothesised rela-tionships are often weak in both univariate and multivariate statistical tests (see Dolde, 1993; Nance et al., 1993). One possible explanation for the weak empiri-cal results of certain theoretiempiri-cal predictions relates to research design. For exam-ple, to identify US industrial firms as hedgers (users) and non-hedgers (non-users), both Nance et al. (1993) and Dolde (1995) used a questionnaire survey which required respondents to indicate whether or not they use one (or more) of four currency derivatives, i.e. forward, futures, swap and/or option contracts. In contrast, Berkman and Bradbury (1996) choose to categorise the firms in their study in terms of the hedging information contained in their audited financial reports (see also Francis and Stephan, 1993; Geczy et al., 1997). Since firms are only required to disclose exposure information if such information is material, this latter approach may not fully capture the hedging activities of firms. However, both approaches seem restrictive since firms use a wide range of internal and external techniques (including derivatives) to hedge foreign exchange (FX) and interest rate exposures (see Stanley and Block, 1980; Khoury and Chan, 1988). Furthermore, some firms may not hedge simply be-cause they have no exposure while others may not hedge or partially hedge depending on their perception about FX rate behaviour and/or their confidence in using derivatives (see Dolde, 1993). These considerations therefore have im-portant implications for the empirical results of prior studies.
This study seeks to provide additional insights into the hedging behaviour of UK firms by focusing on: (i) the degree of utilisation of a broad set of hedging techniques; (ii) the maturity structures of those hedging techniques; and (iii) the sources or types of exposures that are hedged. Those aspects are examined because firms are known to make use of a wide range of techniques when hedging exposure and to exercise substantial flexibility in hedging decisions (see Hakkarainen et al., 1998). Although newer financial innovations can reduce the demand for traditional types of hedging techniques (see Tufano, 1995), empirical evidence indicates that firms are not very receptive to the newer and more complex types of derivatives. This is because firms are concerned about the banks’ commitment to those products and their ability to provide real solutions to exposure problems (see Fairlamb, 1988; Glaum and Belk, 1992). Furthermore, managers can always adjust their hedging decisions to reflect their expectations of changes in financial prices. Thus, if the forward rate is a biased predictor, managers can alter their hedging strategies to accommodate this effect. Here, a partial or no hedge or fully hedged strategy can be optimal for both transaction and economic exposures (see Berg and Moore, 1991; Schooley and White, 1995). Since firms tend to place more emphasis on transaction exposure than on eco-nomic and translation exposures (Khoury and Chan, 1988; Joseph and Hewins, 1991), their use of hedging techniques may reflect the types of exposures they hedge.
N.L.Joseph/J.of Multi.Fin.Manag.10 (2000) 161 – 184 163
effects2. For example, the use of both forward and futures contracts to hedge translation exposure can give rise to economic (cash flow) gains/losses which are not off-set by losses/gains from the underlying exposure. Giddy and Dufey (1995) (p. 51) also show that FX ‘‘…options are not ideal hedging instruments for corporations’’ since the gains/losses which arise from their use are not linearly related to changes in the value of the currency, thereby, increasing the variability of the firm’s real cash flow. But forward contracts can only hedge economic exposure optimally if managerial decisions regarding inputs and outputs are fixed; otherwise, FX options may bemore appropriate (see Ware and Winter, 1988). In the absence of default, the use of forward contracts to hedge transaction exposure does not result in any gain or loss. However, both (long-term) economic and translation exposures tend to have maturities which exceed those of FX forward, futures and option contracts (see also Neuberger, 1996) such that a mis-match of the cash flows from the derivatives and the gain/loss from the underlying exposures will arise. Further, because of basis risk, a one-to-one hedge ratio can increase the variability of the firm’s cash flow if short-dated futures contracts are used to hedge (see Mello and Parsons, 1995). Firms can also hedge with internal techniques, such as, leads and lags which do not give rise to the maturity problems of external techniques. In this case, the impact on the financial measures would depend on the hedging effectiveness of the internal techniques that are used.
Finally, Glaum and Belk (1992) also examined the use of hedging techniques of 17 UK firms but they did not link the degree of usage to the characteristics of their firms. This present study focuses on a much larger sample of UK firms across a broader set of hedging techniques. The degree of utilisation is also linked to the characteristics of the firms.
The remaining sections of this study are as follows: Section 2 describes the theoretical framework and the research methodology. The empirical measures are also described and the hypotheses are formulated in that section. Section 3 presents the empirical results. The results are summarised and their implications are evalu-ated in the Section 4.
2. Background
2.1. Theoretical framework for the use of hedging techniques
To construct the theoretical framework for this study, we rely on existing work which suggests that firms hedge to reduce: (i) the agency problem (Bessembinder, 1991); (ii) effective corporate taxes (Smith and Stulz, 1985); (iii) risk aversion
among managers and other contracting parties (Stulz, 1984); (iv) the probability of financial distress (Smith and Stulz, 1985), and (v) the adverse information content of earnings (DeMarzo and Duffie, 1995). The theoretical explanations identify those incentives for hedging which are likely to benefit contracting parties. How-ever, hedging might not benefit all parties equally and therefore the hedging strategies of firms will vary (see e.g. Tufano, 1996). In theory, shareholders can implement terms of compensation which limit both the incentive to hedge and the choice of hedging technique3.
2.2. Sources of data
To obtain measures of the degree of utilisation of internal and external hedging techniques, a questionnaire survey was mailed to either the finance director or the corporate treasurer4 of UK (industrial) multinational enterprises (MNEs) during October 1994. Two hundred and ten firms were targeted within the top 300 category of The Times 1000: 1994 (hereafter The Times) companies. The MNEs were all quoted on the London International Stock Exchange. A total of 109 responses were obtained, of which 75 were satisfactorily completed (11 are anony-mous). The response rate (35.71%) compares favourable with those of other related studies (see Nance et al., 1993). The firms in our sample are typically large. Their 5-year average sales value (sample size, N=64) to 1994 is £2 795 671 million (US$4 673 803 million). Also, 76.56% of the firms are quoted inThe Timestop 200 category. On average, the firms hedged between 61 and 70% of their global exposure (N=68) and they generated between 41 and 50% of their total sales (N=74) overseas. In addition to the firms’ total sales, other financial data was obtained for the non-anonymous firms from the Datastream. This data set spans five financial year-ends to 1994 for most of the firms.
2.2.1. Internationalisation measures
A firm’s degree of internationalisation can affect the extent to which it uses hedging techniques (see Mathur, 1985). Since firms appear to initially use internal techniques to hedge exposure (see Hakkarainen, et al., 1998), a positive relationship is expected between the measures of internationalisation and the degree of
utilisa-3Recent evidence indicates that institutional investors are attempting to monitor and control the operations of firms. Gaved (1997) reports that UK institutional investors can instigate change when the firm’s performance is not consistent with their expectations. Smith (1996) also provides evidence on the success of US institutional investors — the California Public Employees’ Retirement System (CaLPERS) — who were able to ensure that targeted firms adopt specific performance-related resolutions.
N.L.Joseph/J.of Multi.Fin.Manag.10 (2000) 161 – 184 165
tion of internal techniques. In contrast, a negative relationship is expected between the rate of utilisation of external techniques and the internationalisation measures since the greater use of internal techniques implies less use of external techniques. To measure the degree of internationalisation,5the following measures are used: (i) the number of foreign countries in which the group operates (NCOUNT); (ii) the number of foreign subsidiaries within the group (NSUBS); (iii) the percentage of the groups’ total sales that is generated overseas (PERSALE); and (iv) the percent-age of the groups’ global exposure that is hedged (PERHEDGE). These measures also proxy for the effects of the firm’s size and scale economies on the choice of the hedging technique used (see Shirreff, 1994).
2.2.2. Financial measures
Smith and Stulz (1985) suggest that hedging can reduce the potential for financial distress by reducing the variability of certain financial measures. But the choice of the hedging instrument can increase the variability of the firms’ cash flow. Firms that make greater use of: (i) foreign currency borrowing/lending; (ii) cross-currency interest rate swaps; and (iii) foreign currency swaps are expected to exhibit greater variability on cash flow, liquidity and leverage. The cash flow and liquidity measures are the coefficient of variation of: (i) gross cash flow to market value (GCASHMV); (ii) cash and marketable securities to market value (CASHMV); (iii) quick asset ratio (QAR); and (iv) working capital ratio (WCR). The leverage measures are the coefficient of variation of: (i) interest charges to operating and non-operating income (IGEAR); (ii) preference capital and total borrowing to total capital employed (CGEAR); (iii) total borrowing to ordinary shareholders’ equity plus reserves (TLBOR), and (iv) long-term borrowing to market value (LT-BORMV). Since foreign currency borrowing can increase the probability of finan-cial distress, firms with greater variability in their leverage measures are expected to make greater use of internal techniques.
Hedging can also mitigate the under-investment problem by reducing both the cost of external funds and the firm’s dependence on external finance (Froot et al., 1993). In the absence of hedging, the greater the growth opportunities of the firm the more it will depend on external finance. Thus firms are more likely to hedge the greater their growth options (Lessard, 1991). Since the returns from growth options are likely to have long leads, firms with more variability in their growth options are expected to make greater use of internal hedging techniques thereby reducing the adverse cash flow impacts of derivatives and the associated default risk. This
relationship is tested by using the coefficient of variation of: (i) sales to market value (SALESMV); (ii) the firm’s book value to its market value (BOOKMV); and (iii) dividend yield. Here, a negative relationship between the degree of utilisation of derivatives and our growth option measures is expected. Following DeMarzo and Duffie (1995), high quality managers are more likely to hedge. But the choice of hedging technique and the type of exposure that is hedged can reflect managers’ perceptions of the economic effects of hedging. Titman (1992) also shows that a firm that has an optimistic outlook can use interest rate swaps to benefit from borrowing and the expected cost of financial distress will not increase. Thus a positive relationship is predicted between the use of cross-currency interest rate swaps and variability of the leverage measures.
The tax treatment of both the exposure and the hedging technique can have important implications for the firm’s hedging strategy (see Kramer et al., 1993). Under UK tax laws, the use of derivatives to hedge translation exposure may give rise to cash flow gains which are taxable and losses which are not tax allowable (see Buckley, 1992). To avoid the adverse impacts of asymmetry in taxation, firms are likely to place more emphasis on internal techniques when hedging translation exposure. The use of forward contracts to hedge the transaction exposure emanating from re6enue transactions, results in taxable/tax allowable gains and losses in the UK. All those impacts will in turn affect the level of profitability. Assuming that the tax credits can be utilised, a lower degree of variability is expected on the tax measures for firms that use forward contracts to hedge transaction exposure. The tax and profitability measures are the coefficient of variation of: (i) tax charge on profit/loss to pre-tax profit/loss (TAXRATIO); (ii) tax charge on profit/loss to market value (TAXMV); (iii) operating profit to sales (OPM); and (iv) trading profit to sales (TPM).
The terms of managers’ and employees’ compensation plans can also impact on the choice of hedging technique (see Smith, 1993). Managers will use those derivatives, e.g. FX options, which increase the volatility of the firm’s stock price if a large part of their compensation is in the form of stock options. Following Smith and Stulz (1985) a positive relationship is expected between both managers’ and employees’ wealth and the extent to which the firms use derivatives, particularly when hedging economic and translation exposures. The measures of wealth are the coefficient of variation of: (i) directors’ remuneration to market value (DIRECMV); (ii) employees’ remuneration to market value (EMPMV); and (iii) BOOKMV. The predictions are further summarised in Appendix A.
3. Empirical results
3.1. Some general results
N
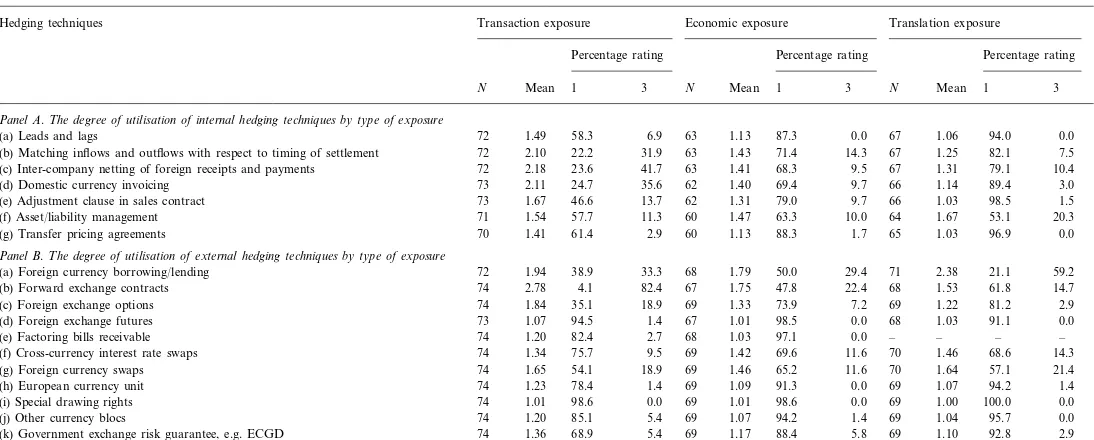
Summary statistics for the extent to which hedging techniques are used by the firmsa
Hedging techniques Transaction exposure Economic exposure Translation exposure
Percentage rating Percentage rating
Percentage rating
Mean 1 3 N Mean 1 3
N
N Mean 1 3
Panel A.The degree of utilisation of internal hedging techniques by type of exposure
6.9 63 1.13 87.3 0.0 67 1.06 94.0 0.0
1.49
(a) Leads and lags 72 58.3
1.43 71.4 14.3
(b) Matching inflows and outflows with respect to timing of settlement 72 2.10 22.2 31.9 63 67 1.25 82.1 7.5
1.41 68.3 9.5 67 1.31 79.1
63 10.4
23.6 41.7
(c) Inter-company netting of foreign receipts and payments 72 2.18
62
73 2.11 24.7 35.6 1.40 69.4 9.7 66 1.14 89.4 3.0
(d) Domestic currency invoicing
1.31 79.0 9.7 66 1.03 98.5 1.5
(e) Adjustment clause in sales contract 73 1.67 46.6 13.7 62
1.47 63.3 10.0 64 1.67 53.1
60 20.3
11.3
(f) Asset/liability management 71 1.54 57.7
(g) Transfer pricing agreements 70 1.41 61.4 2.9 60 1.13 88.3 1.7 65 1.03 96.9 0.0
Panel B.The degree of utilisation of external hedging techniques by type of exposure
33.3 68 1.79 50.0 29.4 71 2.38 21.1 59.2
72
(a) Foreign currency borrowing/lending 1.94 38.9
1.75 47.8 22.4 68 1.53 61.8
67 14.7
74
(b) Forward exchange contracts 2.78 4.1 82.4
69
74 1.84 35.1 18.9 1.33 73.9 7.2 69 1.22 81.2 2.9
(c) Foreign exchange options
1.01 98.5 0.0 68 1.03 91.1
(d) Foreign exchange futures 73 1.07 94.5 1.4 67 0.0
1.03 97.1 0.0 – – –
68 –
74
(e) Factoring bills receivable 1.20 82.4 2.7
69
74 1.34 75.7 9.5 1.42 69.6 11.6 70 1.46 68.6 14.3
(f) Cross-currency interest rate swaps
(g) Foreign currency swaps 74 1.65 54.1 18.9 69 1.46 65.2 11.6 70 1.64 57.1 21.4
1.09 91.3 0.0 69 1.07 94.2
69 1.4
78.4 1.4
(h) European currency unit 74 1.23
69
74 1.01 98.6 0.0 1.01 98.6 0.0 69 1.00 100.0 0.0
(i) Special drawing rights
(j) Other currency blocs 74 1.20 85.1 5.4 69 1.07 94.2 1.4 69 1.04 95.7 0.0
1.17 88.4 5.8 69 1.10 92.8 2.9
69
(k) Government exchange risk guarantee, e.g. ECGD 74 1.36 68.9 5.4
external techniques. Table 1 shows that the degree of utilisation of internal and external hedging techniques varies with the type of exposure6. However, there is preliminary evidence to suggest that the firms place more emphasis on certain external techniques — a finding which has been noted elsewhere (see McRae and Walker, 1980, p. 101). In particular, Panel A shows that inter-company netting and domestic currency invoicing (in that order) are the most commonly used techniques when hedging transaction exposure. Matching inflows/outflows and asset/liability manage-ment are respectively the most commonly used techniques when hedging economic and translation exposures. Evidence from Khoury and Chan (1988) shows that matching is the most popular internal technique used by US firms. Here, US firms consider matching to be the most flexible and ‘self-reliant’ way to hedge.
Panel B also shows that the firms use a limited set of external techniques to hedge the exposures. The FX forward contract is the most commonly used hedging technique. This finding is similar for US firms (see Phillips, 1995). Forward contracts are mainly used to hedge transaction exposure. While foreign currency borrowing/
lending is the most commonly used technique when hedging both economic and translation exposures, it is the second most commonly used technique when hedging transaction exposure. The use of foreign currency borrowing/lending may reflect the desire of the firms to reduce the amount of investment that is abroad (see Belk and Glaum, 1990), but the degree of usage is stronger for translation exposure than for economic exposure. Cross-currency interest rate swaps and foreign currency swaps are not commonly use by the firms. This is consistent with the findings of Glaum and Belk (1992). The utilisation rates of both FX options and futures are low for all types of exposures but FX options tend to be more widely used than FX futures (see also Glaum and Belk, 1992; Phillips, 1995). The low utilisation of FX futures may be due to the effects of daily resettlement which can adversely affect the liquidity of firms.
In general, external techniques appear to play a much more important role in hedging decisions then internal techniques. As the firms are large, scale economies in the use of external techniques and the availability of skilled treasury personnel may contribute to their greater use (see Geczy et al., 1997). However, the firms do not appear to be very selective in their use of the techniques when hedging different types of exposures.
3.1.1. Hedging exposures with similar internal techniques
To test for a link between the utilisation rates of internal techniques, ax2test was
applied7. The test was applied to determine whether or not: (i) the firms are selective
6The 3-point scale identified the degree of usage as: 1=not used; 2=occasionally used; and, 3=frequently used. The occasional use of hedging techniques may be associated with partial hedging and/or hedging strategies which reflect expected changes in the behaviour of the financial markets. Since the aim is to capture the degree of utilisation, it would appear that the use of a larger point scale would not have altered the results (see Lehmann and Hulbert, 1972).
N.L.Joseph/J.of Multi.Fin.Manag.10 (2000) 161 – 184 169
in their use of the hedging techniques; and (ii) certain techniques are perceived to have special attributes such that they would only be used to hedge specific exposures. The null hypothesis that there is no difference in the utilisation rate of matching when the firms hedge transaction and economic exposures is rejected (x42=13.996; P-value=0.007). The contingency table suggests that the firms make greater use of matching when hedging transaction exposure compared with eco-nomic exposure. For example, 32 of the 45 firms (71.11%) that do not use matching to hedge economic exposure, also use matching (occasionally and frequently) to hedge transaction exposure. Using the Cramer test statistic, C (see Siegel and Castellan, 1988) the association appears to be moderate (C=0.333). The null hypothesis of no difference in the degree of utilisation of matching when hedging economic and translation exposures is also rejected (x4
2
=33.668; C=0.521; P -value=0.000). Here, 50 of the firms do not use matching to hedge translation exposure and 90.00% of those firms do not hedge economic exposure with this technique either. However, the firms have a much stronger preference for inter-company netting when hedging transaction exposure compared with economic exposure (overallx4
2
=13.910; C=0.332;P-value=0.008). While 43 of the firms do not use inter-company netting to hedge economic exposure, 72.10% of those firms hedge transaction exposure with inter-company netting. Similar inference can be made for the use of asset/liability management and leads and lags across exposures, but in general, the firms appear to prefer to use those techniques to hedge transaction exposure.
3.1.2. Hedging exposures with similar external techniques
External techniques such as currency swaps and foreign currency borrowing/ lend-ing, allow firms to borrow more cheaply than would otherwise have been possible. Those techniques also enable firms to reduce or eliminate the amount of their foreign investments (see Glaum and Belk, 1992). Cross-currency interest rate swaps also share those attributes. In general, if those techniques enable firms to reduce the amount of their foreign investment, one would expect their use to be more strongly associated with economic and translation exposures. The x2 test provided some
support for this prediction. The null hypothesis of no difference in the degree of utilisation of foreign currency borrowing/lending when hedging economic and translation exposures is rejected (overallx42=16.904; C=0.355; P-value=0.002). Of the 39 firms that hedge translation exposure with foreign currency borrowing/
lending, 35.89% of them frequently hedge economic exposure with the same technique. However, more than half of those firms (21 out of 39) do not use foreign currency borrowing/lending to hedge economic exposure. Thus it seems that the firms prefer to hedge translation exposure with foreign currency borrowing/lending. In contrast, the firms make much greater use of currency swaps when hedging economic exposure compared with transaction exposure (overall x4
2
=20.680; C=
0.387;P-value=0.001) but most of the firms do not use cross-currency interest rate to hedge their exposures.
exposures. The null hypothesis of no difference in the extent to which the firms use FX options to hedge economic and translation exposures cannot be rejected. However, the null hypothesis can be rejected for transaction and translation exposures (x4
2=10.224; C=0.272; P-value=0.037). Here, FX options are primar-ily used to hedge transaction exposure. Up to 37 of the 56 firms that do not use FX options to hedge translation exposure use the derivative to hedge transaction exposure.
3.1.3. Hedging transaction exposure with different techniques
Since it is more difficult to match the maturity of derivatives with those of the underlying economic and translation exposures, firms would be expected to make much greater use of internal techniques. Although, the preliminary evidence sug-gests that the firms place a stronger emphasis on external techniques, the hypothe-sised relationships are directly tested here. The null hypothesis of no difference in the extent to which the firms use foreign currency borrowing/lending and asset/ li-ability management when hedging transaction exposure is easily rejected (x4
2
=
13.109; C of 0.308; P-value=0.011). Thirty-nine firms do not use asset/liability management to hedge transaction exposure and more than half of those (56.41%) do not use foreign currency borrowing/lending either. Indeed, the contingency table suggests that there is a stronger preference for foreign currency borrowing/lending. The null hypothesis is also rejected for the extent to which forward contracts are used compared with matching and domestic currency invoicing8.
The results are similar for the extent to which the firms use FX options compared with other internal techniques9.
8The test statistics for the extent to which FX contracts and the relevant internal hedging techniques are used when hedging transaction exposure are as follows:
Use of FX forward contracts
9The test statistics for the extent to which FX options and the relevant internal hedging techniques are used when hedging transaction exposure are as follows:
Use of FX options
N.L.Joseph/J.of Multi.Fin.Manag.10 (2000) 161 – 184 171
3.1.4. Hedging economic exposure with different techniques
Some significant results were also found for the degree of utilisation of certain techniques when hedging economic exposure. For example, the null hypothesis for the degree of utilisation of foreign currency borrowing/lending and asset/liability management is rejected (x42=24.199; C=0.453; P-value=0.000). Most of the 29 firms (86.21%) that do not use foreign currency borrowing/lending use asset/liability management. The results are also significant for the relationship between the degree of utilisation of: (i) FX options and certain internal techniques; and (ii) foreign currency swaps and certain internal techniques10.
The relationships are weak to moderate and reflect the stronger emphasis on external techniques.
3.1.5. Hedging translation exposure with different techniques
Evidence from Collier et al. (1990) indicates that some treasury managers of both UK and US firms are concerned about the adverse impacts of translation risk on leverage, distributable reserves and the overall balance sheet value. One implication of this finding is that managerial attitudes towards translation exposure would vary, particularly when firms are faced with hedging techniques which increase the variability of those measures. The results indicate a moderate association between the degree of utilisation of foreign currency borrowing/lending and asset/liability management (x42=15.525; C=0.348, P-value=0.004). The firms generally make much greater use of foreign currency borrowing/lending to hedge translation exposure. For example, of the 34 non-users of asset/liability management, up to 61.77% of them are occasional (17.65%) and frequent (44.12%) users of foreign currency borrowing/lending. Most firms that use forward contracts also use
match-10The test statistics for the extent to which FX options and the relevant internal hedging techniques are used when hedging economic exposure are as follows:
Use of FX options
x42
Use of: C P-value
10.027 0.004
Matching inflows/outflows 0.282
21.674
Inter-company netting 0.415 0.000
0.046 Invoicing in domestic currency 9.667 0.279
11.695 0.312
Transfer pricing arrangements 0.020
For economic exposure, the test statistics for the extent to which foreign currency swaps and the relevant internal hedging techniques are used are as follows:
Use of foreign currency swaps
x4
2 C
Use of: P-value
25.457
Inter-company netting 0.449 0.000
Domestic currency invoicing 11.186 0.300 0.025
14.817 0.351 0.005
ing, inter-company netting and domestic currency invoicing11although the empha-sis on forward contracts is not strong. Similarly, the null hypotheempha-sis that there is no difference in the degree of utilisation of foreign currency swaps and asset/liability management is rejected (x4
2= 12.275; C=0.312; P-value=0.015). In general, the firms place a much weaker emphasis on translation exposure.
3.2. Bi6ariate test of hedging techniques and firms’ characteristics
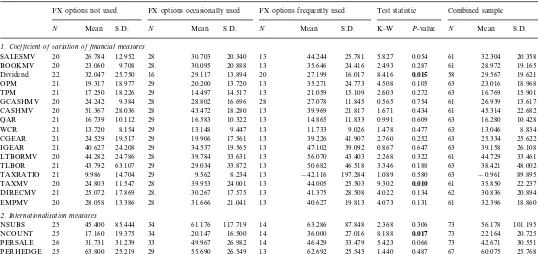
In this sub-section, the extent to which cross-sectional variation in the character-istics of the firms can explain the degree of utilisation of the hedging techniques is assessed. The data for the characteristics of the firms is not normally distributed. Therefore, the distribution-free Kruskal – Wallis statistic has been used. To illustrate the testing procedure, the test statistics associated with the use of FX options and the characteristics of the 64 non-anonymous firms are shown for the case of transaction exposure (see Table 2). If the degree of utilisation of FX options is associated with the financial measures, one would expect to observe differences in the variability of the financial measures. The table shows, for example, that frequent users of FX options exhibit less variability on dividend yield compared to both occasional and non-users; the associated Kruskal – Wallis test statistic is significant (P-value=0.015). Thus the null hypothesis that thek samples are from identical populations with the similar medians can be rejected and it can be inferred that the degree of usage is associated with differences in the variability of the measure.
3.2.1. Internal hedging techniques and firms’characteristics
In most cases, the degree of utilisation of internal techniques is positively related with the measures of internationalisation. In the case of transaction exposure, the Kruskal – Wallis statistic indicated that both occasional and frequent users of matching, domestic currency invoicing and transfer pricing tend to be larger in terms of both NCOUNT and NSUBS. As expected, a higher degree of internation-alisation appears to be associated with an increase in the use of internal techniques. Similarly, firms that use inter-company netting are larger in terms of both measures, but in addition, the magnitude of PERSALE is also larger. As expected, firms that use asset/liability management to hedge transaction exposure exhibit less variability on QAR. However, PERHEDGE and the leverage measures were not found to be
11The test statistics for the extent to FX forward contracts and the relevant internal hedging techniques are used when hedging translation exposure are as
Use of FX forward contracts
P-value
C x42
Use of:
0.297
11.267 0.024
Matching inflows/outflows
14.980
Inter-company netting 0.342 0.005
N
The characteristics of the firms conditioned on the degree of utilisation of foreign exchange (FX) options when hedging transaction exposurea
Test statistic Combined sample
FX options not used FX options occasionally used FX options frequently used
S.D. N Mean S.D. K–W P-value N Mean
Mean S.D.
N Mean S.D. N
1.Coefficient of6ariation of financial measures
20 26.784 12.952 30.703 20.340 13 44.244 25.781 5.827 0.054 61 32.304 20.358
SALESMV 28
20.888 13 35.646 24.416 2.493 0.287 61
30.095 28.972
20 19.165
BOOKMV 23.060 9.708 28.
29.117
22. 32.047 25.750 16 13.894 20 27.199 16.017 8.416 0.015 58 29.567 19.621
Dividend
21 19.317 18.977 20.200 13.720 13 35.271 24.773 4.508 0.105 63 23.016 18.968
OPM 29
14.517 13 21.059 15.109 2.603 0.272 63
14.497 16.769
18.226 29 15.901
TPM 21 17.250
28.802
20 24.242 9.384 28 16.696 28 27.078 11.845 0.565 0.754 61 26.939 13.617
GCASHMV
18.280 13 39.969 21.817 1.671 0.434 61
CASHMV 20 51.367 28.036 28 43.472 45.314 22.682
10.322 13 14.865 11.833 0.991 0.609 63
16.583 16.280
21 10.428
QAR 16.739 10.112 29
13.148
21 13.720 8.154 29 9.447 13 11.733 9.026 1.478 0.477 63 13.046 8.834
WCR
17.561 13 39.226
CGEAR 21 24.529 19.517 29 19.906 41.907 2.760 0.252 63 25.334 25.622
19.565 13 47.102 39.092 0.867 0.647 63
34.537 39.158
29 26.108
IGEAR 21 40.627 24.208
33.631 13 56.070 43.403 2.268 0.322 61
LTBORMV 20 44.282 24.786 28 39.784 44.729 33.461
33.872 13 50.682 46.518 3.346 0.188 63
29.034 38.421
TLBOR 21 43.792 63.107 29 48.002
9.562
21 9.986 14.704 29 8.234 13 −42.116 197.284 1.089 0.580 63 −0.961 89.895
TAXRATIO
24.001 13 44.005 25.503 9.302 0.010 61
39.953 35.850
20. 22.237
TAXMV 24.803 11.547 28
30.267
21 25.072 17.869 28. 17.575 13 41.375 28.508 4.022 0.134 62 30.836 20.894
DIRECMV
28 31.666 21.041 13 40.627 19.813 4.073 0.131 61 32.396 18.860
EMPMV 20 28.058 13.386
2.Internationalisation measures
117.719 14 63.286 87.848 2.368
45.400 0.306
NSUBS 25 85.444 34 61.176 73 56.178 101.195
34 20.147 16.500 14 36.000 27.016 8.188 0.017 73 22.164 20.725
17.160
NCOUNT 25 19.375
26.982
PERSALE 26 31.731 31.239 33 49.967 14 46.429 33.479 5.423 0.066 73 42.671 30.551
26.549 13 62.692 25.545 1.440 0.487 67
55.690 60.075
29 25.768
PERHEDGE 25 63.800 25.219
aThe summary statistics are conditioned on the degree of usage of foreign exchange options and are also given for the firms combined. The variable representing firm
characteristics are described in the appendix. S.D. is the standard deviation. K–W is the Kruskal–Wallis test statistic which tests the null hypothesis that the characteristics of the
firms conditioned on the degree of usage have the same median. TheP-values50.05 are show in bold. For both PERSALE and PERHEDGE, respondents were asked to tick
significantly associated with any hedging technique. The results for translation and economic exposure are insignificant and reflect the low priorities the firms give to those exposures.
3.2.2. External hedging techniques and firms’characteristics
The Kruskal – Wallis test statistic also indicated that the use of external tech-niques varies with the characteristics of the firms. One interesting result is that occasional users of currency lending/borrowing tend to hedge a much larger percentage of PERHEDGE than frequent users, when transaction exposure is hedged. If firms partially hedge on the expectation of benefiting from FX trading (see Hakkarainen et al., 1998), it is possible that the percentage of exposure that is hedged as well as the degree of utilisation of certain techniques will vary. Firms that frequently use FX forwards to hedge transaction exposure tend to exhibit much lower variability on CASHMV compared to occasional users. This result is expected since the mis-match of the cash flows from the instrument and the underlying exposure would not occur, in the absence of default. The degree of utilisation of FX forwards is also positively related to NCOUNT. Furthermore, the degree of utilisation of FX options is positively related to dividend yield, TAXMV and NCOUNT as well as the length of time since the firms had established their formal corporate hedging policies. Thus it appears that greater experience in exposure management (see also Dolde, 1993) increases the firms’ confidence in using more complex techniques. Firms that are occasional and frequent users of factoring tend to hedge a larger percentage of PERSALE. They are also larger in terms of NSUBS. All those considerations apply to transaction exposure.
N.L.Joseph/J.of Multi.Fin.Manag.10 (2000) 161 – 184 175
Finally, the results indicate that firms that use foreign currency borrowing/ lend-ing to hedge translation exposure exhibit less variability on OPM, IGEAR, and LTBORMV. The lower variability of the leverage measures is unexpected. How-ever, firms that hedge less than 40% of their global exposure exhibit less variability on both CGEAR and IGEAR while those that hedge between 41 and 80% of their global exposure exhibit more variability on those measures (P-value50.025). Thus it appears that the extent to which exposure is hedged impacts on the hypothesised relationship. The use of foreign currency borrowing/lending when hedging transla-tion exposure is also positively related with NSUBS and PERSALE. While occa-sional users of foreign currency swaps exhibit greater variability on both OPM and TAXMV, frequent users exhibit less variability on OPM. These contrasting results may be due to the inflexibility inherent in the use of foreign currency swap agreements.
3.3. Multi6ariate test of hedging techniques and firms’ characteristics
Bivariate tests tend to be weak since they do not allow for interactions among the explanatory variables. To further assess the choice of hedging techniques, a logistic regression was applied. The dependent variable of the logistic regression is deter-mined by using the ratings that represent the degree of usage. Here, the score of 1 (not used) is coded as 0 and, the scores of 2 and 3 (occasionally and frequently used) are coded as 1. The existence of missing explanatory variables and the anonymous responses result in an overall sample size of 54 firms. To minimise the potential problems of small sample size, we present the results for the models where: (i) at least 20% of the firms can be allocated to either group 0 or 1, a priori; (ii) each empirical model outperforms a naive proportional chance model (see Joy and Tollefson, 1975); and (iii) each model’s xn
2
statistic is significant at the 50.05 level. No evidence was found that suspiciously large regression residuals had an adverse effect on the estimated coefficients.
3.3.1. Internal hedging techniques
Panel A of Table 3 shows that the explanatory variables exhibit some discrimina-tory power for the degree of utilisation of internal hedging techniques. Only the coefficients associated with transaction exposure are significant. As expected, the use of internal techniques is positively related with measures of internationalisation. The use of leads and lags is positively related with the coefficients of both SALESMV and NCOUNT but those coefficients are marginally significant. The coefficient value of 0.138 for SALESMV means that as its variability increases, all else held constant, the likelihood that the firm will use leads and lags to hedging transaction exposure increases. In this case, each unit increase in the variability of SALESMV increases the log odds by a factor of 1.148; that is, e0.138
N
Logistic regression for the use of internal and external hedging techniques and the characteristics of the firmsa
Transaction exposure
Domestic
cur-Coeff Coeff R
Leads and lags R Transfer pricing Coeff R
rency invoicing
Panel A:Internal hedging techniques
CASHMV −0.182 SALESMV −0.065**
−0.186
SALESMV 0.138* 0.152 0.377 TAXMV 0.106*** 0.298
(0.018) (0.014) (0.040)
−0.055** −0.249 PERHEDGE 0.024*
DIRECMV
Constant −0.402 0.400 Constant −1.254
(1.182)
% classified 70.370*** % classified 75.930***
N
***Currency R Coeff R Factoring Coeff R Cross-currency Coeff R
exchange
borrowing/ interest rate
swaps options
lending
Panel B:External hedging techniques
−0.187** −0.244 DIRECMV −0.120**
OPM 0.210*** 0.268 0.307 EMPMV 0.127*** 0.388 IGEAR 0.049** 0.200
(0.024)
CASHMV −0.047** NCOUNT −0.035* −0.137
(0.020) (0.022)
(0.016) (0.005)
BOOKMV 0.095** 0.118 PERSALE −0.036** −0.234
CASH 0.084*** 0.176
Constant 1.246 Constant −0.163 (1.245) −1.242 (0.934)
(1.106)
% classified 87.040*** % classified 79.630**
79.63***
% classified 87.040*** % classified
S. Residuals 0.007 S. Residuals −0.099
S. Residuals −0.121 S. Residuals 0.003
N1, N2 43, 11 N1, N2 41, 13
N
Currency bor- R Foreign ex- Foreign cur- Coeff R
rowing/lending change options rowing/lending rency swaps
0.254 0.188 OPM −0.092**
0.118**
GCASHMV OPM 0.046** −0.363 TPM 0.338*** 0.339
(0.047) 0.023) (0.035) (0.125)
EMPMV −0.053** TAXRATIO 0.179** 0.305
(0.038) (0.023) (0.027) (0.072)
Constant −1.601**
Constant 1.049 PERSALE 0.026* 0.149 NSUBS 0.151** 0.219
(0.015) (0.007)
(0.714) (0.862)
PERHEDGE 0.038** 0.225 Constant −0.447
(0.019) (0.619)
Constant −0.470
(1.357)
Diagnostics Statistics
Diagnostics Statistics Diagnostics Statistics Diagnostics Statistics
Model’sx52 20.915*** Model’sx42
% classified 72.220a % classified 75.930*** % classified 72.220***
S. Residuals −0.016 S. Residuals −0.055
0.047
S. Residuals −0.017 S. Residuals
N1, N2 13, 41 N1, N2 28, 26
N1, N2 23, 31 N1, N2 37, 17
aThe explanatory variables are entered into/removed from the logistic regression using a stepwise procedure. The likelihood-ratio test is used for both entering (cut-offP-value50.05) and removing (cut-off
P-value]0.10) the explanatory variables into/from the model. For this reason some coefficients are significant at the 10% level, which is considered to be marginal. The Wald statistic is used to test the null
hypothesis that each coefficient of the model is zero. The standard errors of the coefficients are in parentheses.Ris the partial correlation between the dependent and independent variables. S. Residuals is
the average of the standardised residuals of the logistic regression model. For theith case its residual is divided bypi(1−pi) wherepiis the predicted value. The chi-squarexn2statistic tests the null hypothesis
that all coefficients in the model (except the constant) are simultaneously zero against the alternative that at least one coefficient is non-zero. The percentage correctly classified is a measure of the classificatory
efficiency of the model. The level of significance indicates that the classificatory efficiency of the empirical model is superior to that of a naive proportional chance model (see, Joy and Tollefson, 1975).N1
indicates the number of firms in the sample that do not use the hedging techniques whileN2indicates the total number of occasional and frequent users. The results are presented where: (i) it was possible
to allocate at least 20% of the firms to group 0 or 1 a priori; (ii) the percentage correctly classified by the empirical model outperforms a proportional chance naive model (P-valueB0.05; one tailed); and
(iii) each model’sxn2statistic is significant at the 5% level or less.
* The test statistic is significant at]5% but510% level.
** The test statistic is significant at]1% but55%.
N.L.Joseph/J.of Multi.Fin.Manag.10 (2000) 161 – 184 179
3.3.2. External hedging techniques
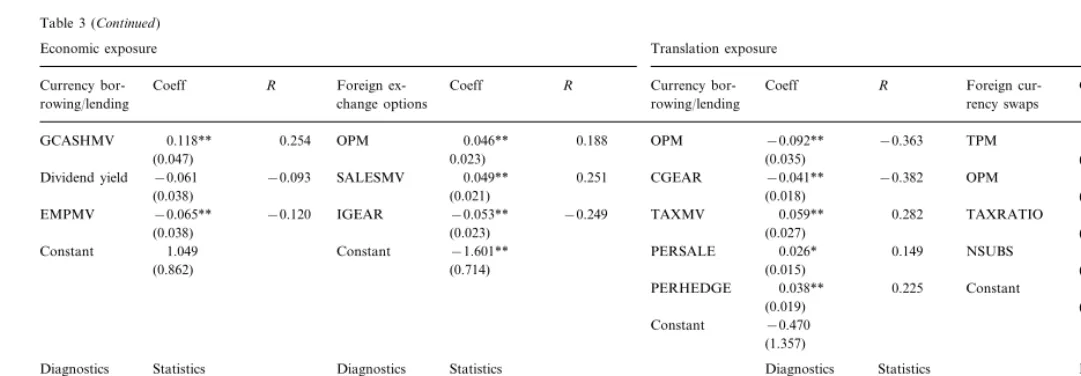
The results for the degree of utilisation of external hedging techniques are shown in Panel B of Table 3. Here, the degree of utilisation of foreign currency borrowing/
lending is associated with each type of exposure. The cash flow and profitability measures appear to explain the degree of utilisation, and in most cases, their coefficients carry the expected sign. Notice that the coefficient for TAXMV is positive implying that the use of FX options for hedging transaction exposure will increase as its variability increases. For transaction exposure, PERSALE carries an unexpected negative sign for cross-currency interest rate swap, and is marginally significant (but positive) in the case of translation exposure. In general, the characteristics of the firms can explain the choice of hedging technique but the explanatory power of the logistic regression is much stronger for the use of external techniques.
4. Summary and conclusions
This empirical study is concerned with the use of both internal and external hedging techniques by large UK MNEs and the extent to which cross-sectional variation in the characteristics of those firms can explain the degree of usage.
The empirical results show that UK firms utilise a narrow set of techniques to hedge exposure. The firms place much more emphasis on currency derivatives than on internal hedging techniques. This emphasis is not consistent with the approach that is suggested in the academic literature (see McRae and Walker, 1980) and the implications of prior empirical work (see Hakkarainen et al., 1998, p. 44). Also, the firms place more emphasis on transaction exposure and economic exposure and much less on translation exposure. Those findings are informative since they show that not all the traditional hedging techniques are utilised by the firms despite the proliferation of financial innovations in recent years (see Remolona, 1992 – 93). One important implication of the model of Breeden and Viswanathan (1990) is that like financial institutions, industrial firms are likely to make much greater use of derivatives (than internal techniques) in order to indirectly communicate their managerial ability to operate in the derivatives market.
the issues which have been raised have not been explicitly addressed in theoretical and empirical work. As the firms do not hedge fully, it is possible that part of the observed variability reflects the effects of partial hedging. However, the maturity mis-match of exposures and derivatives will normally give rise to some degree of variability in financial measures.
Acknowledgements
N
Appendix A. The predicted signs and the characteristics of firms
Variable name Variable description Generalisation of the predicted signs by type of exposure
Internal techniques External techniques
Economic Translation Transaction Economic Translation Transaction
1.Coefficient of6ariation of financial measures
−
Total sales to market value. The market value of the − ? − + ?
SALESMV
firm is the closing ordinary share price times the total shares outstanding at the firm’s financial year-end
− + +
−
BOOKMV Total assets less total liabilities less preference stock − −
outstanding at the year end to market value
Dividend paid per share to price per share at the − − − + +
Dividend yield −
financial year end
− − + ?
−
OPM Operating profit margin: operating profit to total sales −
+ +
− −
TPM Trading profit margin: trading profit to total sales − −
Gross cash flow to market value − − − + +
GCASHMV −
− + +
−
CASHMV Cash, cash equivalents and marketable securities to − −
market value
−
Quick asset ratio: total current assets less stock and − − − + +
QAR
work-in-progress to total current liabilities
−
Working capital ratio: total current assets to total cur-− − − + +
WCR
rent liabilities
− + +
− −
−
CGEAR Preference capital and total borrowing to total capital employed
− +
IGEAR Total interest charges to the sum of operating and − − − +
non-operating income
+ +
− −
Long term borrowing to market value − −
LTBORMV
−
Total borrowing to ordinary shareholders’ equity and − − − + +
TLBOR
N
Generalisation of the predicted signs by type of exposure Variable description
DIRECMV Total of directors’ remuneration and pension fund − −
contributions to market value
Total employees’ remuneration to market value − − − + +
EMPMV −
Number of foreign subsidiaries within the group
NSUBS −
− − −
NCOUNT Number of foreign countries in which the subsidiaries + + +
of the group operate
− −
+
+ −
+
Percentage of group’s total sales generated overseas PERSALE
+ + − − −
Percentage of the group’s global exposure that is
PERHEDGE +
hedged
N.L.Joseph/J.of Multi.Fin.Manag.10 (2000) 161 – 184 183
References
Belk, P., Glaum, M., 1990. The management of foreign exchange risk in UK multinationals: an empirical investigation. Accounting and Business Research 21, 3 – 13.
Berg, M., Moore, G., 1991. Foreign exchange strategies: spot, forward and options. Journal of Business Finance and Accounting 18, 449 – 457.
Berkman, H., Bradbury, M., 1996. Empirical evidence on the corporate use of derivatives. Financial Management 25, 5 – 13.
Bessembinder, H., 1991. Forward contracts and firm value: investment incentive and contracting effects. Journal of Financial and Quantitative Analysis 26, 519 – 532.
Breeden, D., Viswanathan, S., 1990. Why do firms hedge? An asymmetric information model, Working Paper, Fuqua School of Business, Duke University.
Buckley, A., 1992. Multinational Finance. Prentice Hall, London.
Collier, P., Davis, E., Coates, J., Longden, S., 1990. The management of currency risk: case studies of US and UK multinationals. Accounting and Business Research 20, 206 – 210.
DeMarzo, P., Duffie, D., 1995. Corporate incentives for hedging and hedge accounting. The Review of Financial Studies 8, 743 – 771.
Dolde, W., 1993. The trajectory of corporate financial risk management. Continental Bank Journal of Applied Corporate Finance 6, 33 – 41.
Dolde, W., 1995. Hedging, leverage, and primitive risk. The Journal of Financial Engineering 4, 187 – 216.
Fairlamb, D., 1988. Have ‘risk managers’ got a deal for you! Institutional Investor May, 93 – 96. Francis, J., Stephan, J., 1993. Characteristics of hedging firms: an empirical examination. In: Schwartz,
R., Smith, C. (Eds.), Advanced Strategies in Financial Risk Management. Englewood Cliffs, New York, pp. 615 – 635.
Froot, K., Scharfstein, D., Stein, J., 1993. Risk management: coordinating corporate investment and financing policies. Journal of Finance 48, 1629 – 1658.
Gaved, M., 1997. Closing the Communications Gap: Disclosure and Institutional Shareholders. The Institute of Chartered Accountants in England and Wales, London.
Geczy, C., Minton, B., Schrand, C., 1997. Why firms use currency derivatives. Journal Finance 52, 1323 – 1354.
Giddy, I., Dufey, G., 1995. Uses and abuses of currency options. Bank of America Journal of Applied Corporate Finance 8, 49 – 57.
Glaum, M., 1990. Strategic management of exchange rate risks. Long Range Planning 23, 65 – 72. Glaum, M., Belk, P., 1992. Financial innovations: some empirical evidence from the United Kingdom.
Managerial Finance 18, 71 – 86.
Hakkarainen, A., Joseph, N., Kasanen, E., Puttonen, V., 1998. The foreign exchange exposure management practices of Finnish industrial firms. Journal of International Financial Management and Accounting 9, 34 – 57.
Joseph, N., Hewins, R., 1991. Portfolio models for foreign exchange exposure. Omega: International Journal of Management Science 19, 247 – 258.
Joseph, N., Hewins, R., 1997. The motives for corporate hedging among UK multinationals. Interna-tional Journal of Finance and Economics 2, 151 – 171.
Joy, O., Tollefson, J., 1975. On the financial applications of discriminant analysis. Journal of Financial and Quantitative Analysis 10, 723 – 739.
Khoury, S., Chan, K., 1988. Hedging foreign exchange risk: selecting an optimal tool. Midland Corporate Finance Journal 5, 40 – 52.
Kramer, A., McDermott, W., Heston, J., 1993. An overview of current tax impediments to risk management. Continental Bank Journal of Applied Corporate Finance 6, 73 – 80.
Lehmann, D., Hulbert, J., 1972. Are three-point scales always good enough? Journal of Marketing Research 9, 444 – 446.
Levi, M., Sercu, P., 1991. Erroneous and valid reasons for hedging foreign exchange rate exposure. Journal of Multinational Financial Management 1, 25 – 37.
Lewent, J., Kearney, A., 1990. Identifying, measuring, and hedging currency risk at Merck. Continental Bank Journal of Applied Corporate Finance 2, 19 – 28.
Mathur, I., 1985. Managing foreign exchange risks: strategy considerations. Managerial Finance 11, 7 – 11.
McRae, T., Walker, D., 1980. Foreign Exchange Management. Prentice Hall, London.
Mello, A., Parsons, J., 1995. Maturity structure of a hedge matters: lessons from the Metallgesellschaft debacle. Bank of America Journal of Applied Corporate Finance 8, 106 – 120.
Nance, D., Smith, C., Smithson, C., 1993. On the determinants of corporate hedging. Journal of Finance 48, 267 – 284.
Neuberger, A., 1996. Using futures contracts for corporate hedging: the problem of expiry and a possible solution. European Financial Management 2, 263 – 271.
Phillips, A., 1995. 1995 Derivatives practices and instruments survey. Financial Management 24, 115 – 125.
Ramaswamy, K., Kroeck, K., Renforth, W., 1996. Measuring the degree of internationalization of a firm: a comment. Journal of International Business Studies 27, 167 – 177.
Remolona, E., 1992 – 93. The recent growth of financial derivative markets. Federal Reserve Bank of New York Quarterly Review 18, 28 – 43.
Riehl, H., Rodriguez, R., 1977. Foreign Exchange and the Money Markets. McGraw-Hill, New York. Schooley, D., White, H., 1995. Strategies for hedging translation exposure to exchange rate changes:
theory and empirical evidence. Journal of Multinational Financial Management 5, 57 – 72. Shirreff, D., 1994. Fill that gap!. Euromoney Issue no. 304, 28 – 32.
Siegel, S., Castellan, N., 1988. Nonparametric Statistics for the Behavioral Sciences. McGraw-Hill, New York.
Smith, C., 1993. Risk management in banking. In: Schwartz, R., Smith, C. (Eds.), Advanced Strategies in Financial Risk Management. Englewood Cliffs, New York, pp. 147 – 162.
Smith, M., 1996. Shareholder activism by institutional investors: evidence from CalPERS. Journal of Finance 51, 227 – 252.
Smith, C., Stulz, R., 1985. The determinants of firms’ hedging policies. Journal of Financial and Quantitative Analysis 20, 391 – 405.
Stanley, M., Block, S., 1980. Portfolio diversification of foreign exchange risk: an empirical study. Management International Review 20, 83 – 92.
Stulz, R., 1984. Optimal hedging policies. Journal of Financial and Quantitative Analysis 19, 127 – 140. Sullivan, D., 1994. Measuring the degree of internationalization of a firm. Journal of International
Business Studies 25, 325 – 342.
Titman, S., 1992. Interest rate swaps and corporate financing choices. Journal of Finance 47, 1503 – 1516. Tucker, A., 1991. Financial Futures, Options and Swaps. West, New York.
Tufano, P., 1995. Securities innovations: a historical and functional perspective. Bank of America Journal of Applied Corporate Finance 7, 90 – 104.
Tufano, P., 1996. Who manages risk? An empirical examination of risk management practices in the gold mining industry. Journal of Finance 51, 1097 – 1137.