The characterization of NMR signal for blood
pressure monitoring system and its testing
Bambang Murdaka Eka Jati1*, Kusminarto1, Agung Bambang Setio Utomo1,
Bambang Irawan2
1Department of Physics, Faculty of Mathematics and Natural Sciences, 2Department of Cardiology and Vascular, Dr. Sardjito General Hospital/Faculty of Medicine, Universitas Gadjah Mada, Yogyakarta, Indonesia
DOI: http://dx.doi.org/10.19106/JMedSci004701201502
ABSTRACT
A blood monitoring system based on NMR method has been designed on constructed. This set-up of equipment used magnetic permanent, radio frequency (RF), receiver
coil (RC), function generator (FG), ampliier which included the ilter, as well as the oscilloscope digital storage. The background of this research was based on the sensitivity of NMR signal. The signal must be separated from signals background. This method was done by adjusting the frequency on FG, which was connected to radio frequency (RF) coil, on empty sample. Subsequently, NMR signal was received by RC, and that signal could be shown on oscilloscope at resonance condition. The true frequency on NMR signal was Larmor frequency, and the other was background. The two variables of this experiment were the position of RF coil and the location temperature (20 up to 30oC).
In conclusion, the resonance frequency of NMR signal (as Larmor frequency) was 4.7 MHz (at static magnetic ield of 1,600 gauss) and it could be separated from background signals (3.4 and 6.2 MHz), and that signal was almost constant to room temperature. The equipment was used for sample testing. It gave systole/diastole data of 110/70 mmHg (on sphygmomanometer) that was similar to 17/9 mV (on NMR signal).
ABSTRAK
Telah dikembangkan alat pemantauan tekanan darah berdasar prinsip NMR. Pada riset ini diselidiki, apakah sinyal yang muncul di layar osiloskop benar-benar berasal dari tekanan darah sampel (pasien). Teknik pengukuran ini melibatkan instrumen berupa: magnet permanen, koil radio frekuensi (RF), koil penerima (RC), fungsion generator (FG), ampliier
beserta ilternya, dan unit pemantau berupa oscilloscope digital storage. Penelitian ini
dilatarbelakangi oleh adanya kekhawatiran bahwa sinyal NMR oleh nilai sistol dan diastol
bersifat tumpang tindih dengan sinyal NMR oleh sumber lain atau latar. Penelitian ini dilakukan dengan meneliti sebaran kuat medan magnet di sekitar magnet permanen (B
o).
Kemudian, pada kawasan frekuensi FG terpilih yang bersesuaian dengan nilai medan
magnet statis guna menghasilkan sinyal NMR, ditampilkan sinyal NMR ketika koil RF kosong. Akhirnya, parameter sinyal itu dibandingkan dengan sinyal NMR ketika di dalam koil RF berisi lengan sampel. Hasilnya, frekuensi larmor oleh momen dipol magnet spin proton atom hidrogen (Bo = (1,6±0,2)102 gauss) pada aliran darah adalah berkisar 4,7 MHz. Sedangkan, frekuensi yang menghasilkan sinyal latar (tidak peka terhadap perubahan
suhu lingkungan) bernilai 3,4 dan 6,2 MHz. Artinya, sinyal latar tidak berpengaruh
terhadap sinyal NMR (oleh adanya tekanan darah arteri sampel). Dari uji coba, telah dapat ditampilkan pula sinyal NMR sampel 17/9 mV yang bersesuaian dengan sistol/diastol (diukur dengan sphygmomanometer) 110/70 mmHg
Keywords: NMR-characterization-blood pressure-monitoring-testing
INTRODUCTION
The relationships between physics and some applied sciences is increasingly close.1,2 For example, the cooperation between physics and medical science is termed medical physics. Products of such cooperation are medical equipments. These equipments are designed and constructed using physics combined with medical information. One example of the medical equipment products is artery blood pressure monitoring system. The blood pressure is deined as the pressure in systemic circulation (heart – all organs – heart), but not that in small circulation (heart – lung – heart).3 Systemic circulation is chosen because the arteries and veins of this circulation are through some vital organs such as brain and liver.
The blood pressure monitoring system could be categorized into two main methods, namely invasive and non-invasive methods. The invasive method could be carried out by placing a device inside the arteries. This method (such as that using catheter) is accurate, very small in the dimension of equipment, good for critical patients, but expensive. The non-invasive method is used by placing the equipment outside of body organs. This method is safe, the dimension of equipment is not small enough, but it could be mobile. Unfortunately, this method is frequently not precise. Therefore, this method could be used to monitor the health of people daily. Sphygmomanometer is one of the examples.
The operation principle of catheter is different from sphygmomanometer.4,5 The blood pressure monitoring system of catheter is continuous, and it is based on the measurement of pulse blood lows. On the other hand, sphygmomanometer is based on the measurement of turbulant blood lows. This means that the lows of blood in patients are undisturbed in catheter measurement, but they are disturbed in sphygmomanometer measurement. The variances of blood pressure, which could be monitored, are systole/diastole, pulse on blood pressure, and the average of blood pressure. The systolic phase of blood pressure is caused by the contraction of the heart, and the diastolic phase is caused by the relaxation of the heart. The pulse on blood pressure is the value of systole subtracted to diastole. The average blood pressure is the average of systole-diastole in one period.6,7
background signals. The second step was to characterize the home made blood pressure monitoring system. The third step was to do a sample testing. It is expected that this home-made instrumentation could be used safely for blood pressure monitoring system.
MATERIALS AND METHODS
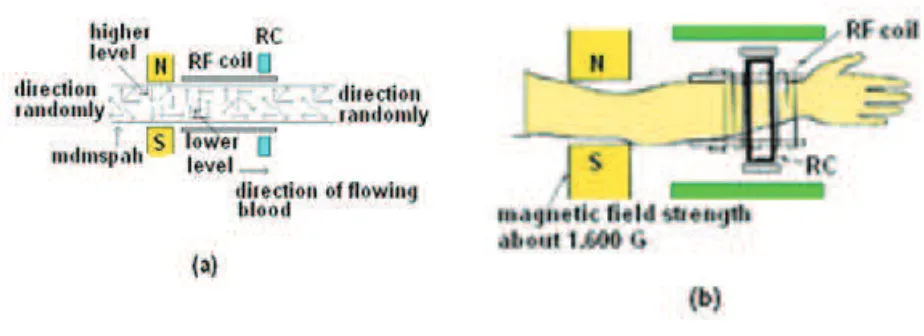
Nuclear Magnetic Resonance (NMR) signals could be found by the transition of “magnetic dipole moment of spin proton on atomic hydrogen” (mdmspah) from the higher energy level to the lower one.11-14 This transition changes the magnetic lux on radiation. This magnetic lux radiation is received by receiver coil (RC). The transition of mdmspah from upper energy level to the lower one is called relaxation. The duration for relaxation is called relaxation time. A proton is a nucleus of hydrogen atom, and water molecule is dominated by hydrogen atoms. NMR process is based on mdmspah transition. Human organ is dominated by water, and therefore NMR process could be applied on every human organ. Thus, it could be used to detect the lows of blood in arteries.15,16The working principle of NMR device as blood pressure
monitoring system is shown in FIGURE 1. FIGURE 1a presents a picture of luid (as mdmspah inside blood) lowing from left to right. Initially, the direction of mdmspahs is random. Subsequently, at an area between two magnetic poles N (north) and S (south) at about 1,600 gauss, some of mdmspah are oriented to minimum on their potential energy. For a moment, mdmspah is radiated by electromagnetic (em) wave from radio frequency (RF) coil. This radiation causes some of mdmspah in excitatory condition. RF coil is connected to function generator (FG), and hence FG generates current in higher (in the order of MHz) frequency. For a moment, at their relaxation times, some of mdmspah relax and go back to lower energy level. As long as mdmspah is in relaxation condition, mdmspah radiates magnetic lux. This magnetic lux is received by RC. Output of RC gives induction voltage, which is termed NMR signals. This NMR signal is connected to a ilter (for signals less than 20 Hz) and an ampliier (amplifying signals about 500 times). Finally, after the NMR signal is iltered and ampliied, this signal is shown on the screen of oscilloscope digital storage. The blood lowing model in an arm could be seen in FIGURE 1.b.
The NMR signal is received from blood low in arteries of an arm (FIGURE 1.b). However, other signals which look like NMR signals probably disturb that signal. These other signals (termed as background signals) are probably different from NMR signal in terms of resonance frequency. The source of background signal is probably ionic gas. According to kinetic theory, all atoms or molecules vibrate, rotate, and translate. If the temperature of the location is T (kelvin),
the Stefan – Boltzmann constant is k, and the degree of freedom (f) is 7, the kinetic energy
is . If the molecules move at a speed
of v, and the density of the molecules is, the
pressure is 2
2 1 v
P= ρ . This means that these
ionic gases move inside the gap between N and S of permanent magnetic poles as well as inside RF coil.
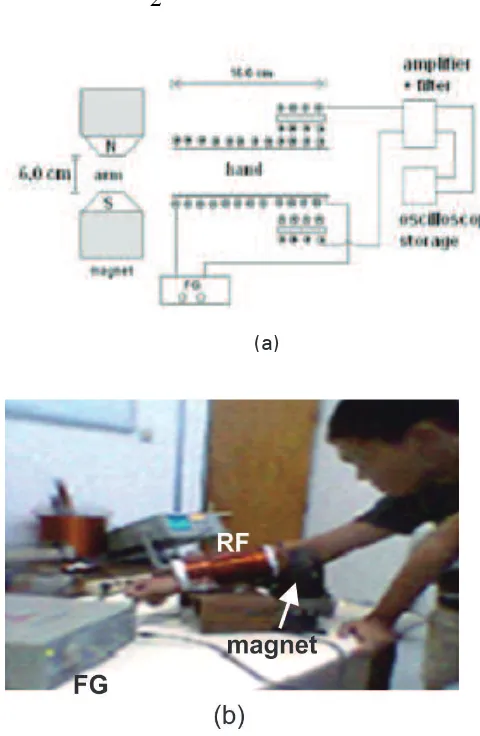
The present experiment used some equipment, including home-made equipment. The equipment (shown in FIGURE 2a) was teslameter and permanent magnet (1,300 up to 1,800 gauss). Other equipment was oscilloscope, FG, ampliier including the ilter, RF coil, and RC (FIGURE 2b). The ampliier – ilter and the coils (RF and RC) were home-made equipment. The room temperature was measured by placing 2 thermometers at a vertical position on static. The experiment of monitoring blood pressure of a sample is shown in FIGURE 2b.
FIGURE 2. (a) The experimental set up (b) experimental testing for a sample.
RESULTS
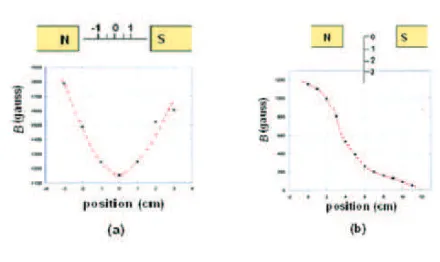
The data of the present study are the distribution of magnetic ield strength (B) as a function of position and the frequency of background signals as a function of room temperature, the effect of room temperature to the background signals, and NMR signals for a sample testing. The magnetic distribution along N – S poles axis is presented in FIGURE 3a. The other one, the distribution in perpendicular direction to that axis (N – S) poles is shown in FIGURE 3b. B on the right and on the left places from those poles can be seen in FIGURE 4. In addition, the frequency of background signal at 22±1oC is shown in FIGURE 5.
The experiment was completed by putting data quantity of magnetic ield as a function of some positions around the permanent magnet (FIGURE 3a, b). The magnetic distribution was put along N – S poles and perpendicular from that axis. RF coil was empty. The position of RF coil was varied in the distance from permanent magnet. Subsequently, the signal (similar to NMR signals) was seen on the oscilloscope screen and saved in a lash disc. The data of background signals were put at resonance frequency as a function of room temperature.
DISCUSSION
It can be seen from the data (FIGURES 3 and 4) that the distribution of B along N – S poles is not homogenous. However, the magnetic ield
FIGURE 4. The distribution of magnetic ield strength on right side place from S pole.
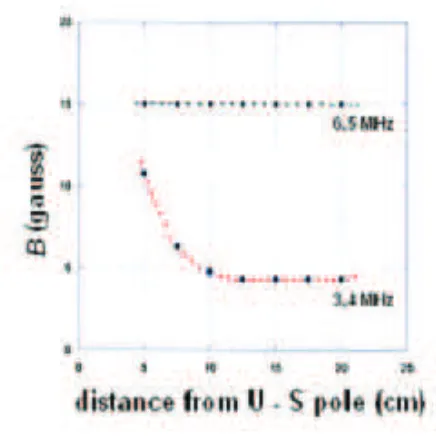
FIGURE 5. Resonance frequency of B background signal.
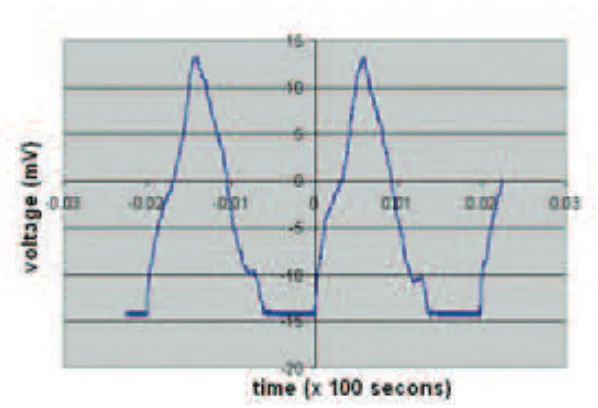
in inhomogeneity could be erased by placing the sample as artery on constant position. On the other hand, B is going down sharply for more distant from the pole gap position. This means that the distribution of B from the permanent magnet does not disturb other equipment such as oscilloscope or FG. FIGURE 5 shows that the frequency of background signal is 3.4 MHz and 6.5 MHz. The frequency of this signal is very much different from NMR signal of mdmspah by lowing blood in arteries. On the other hand, resonance frequency of background signal is almost independent from room temperature (FIGURE 6). Finally, the NMR signal (for blood pressure monitoring system) is not disturbed by background signal and also it is not sensitive to room temperature. An example of NMR signal from a sample testing can be seen in FIGURE 7. The voltage of NMR signal is consistent with systole (maximum voltage) – diastole (minimum voltage) when blood was lowing inside arteries in sampled arms. The frequency of NMR signal is 4.7 MHz. This value is consistent with larmor frequency of mdmspah.
CONCLUSION
It can be concluded that, irst, the distribution of magnetic ield strength for around 20 cm from the poles of permanent magnet is too small. This means that this magnet does not disturb other electronic equipment. Background signals could be found but these signals are not sensitive to coordinate and room temperature. Second, it could be measured that the background signal frequency is 3.4 and 6.5 MHz. It means that the background signal does not disturb NMR signal (about 4.7 MHz) which is produced by mdmspah from lowing blood in the arm of the sample artery. Third, the similarity of NMR signal (in mV) to blood pressure (as measured in mmHg using sphygmomanometer) from a sampled testing could be seen by an oscilloscope. It is expected that this research could be developed for bigger magnetic ield strength (more than 7,000 gauss) on maximal sensitivity of NMR signal. From the next step of research, the equipment (NMR system) could be applied to measure blood pressure on time for some condition of samples.
FIGURE 7. NMR signal (in mV) from a sample is similar to systole/diastole (110/70 mmHg).
ACKNOWLEDGEMENTS
The authors would like to express their gratitude to Directorate Deneral of Higher Education, Ministry of National Education, Universitas Gadjah Mada, and Vice Dean and Dean of Faculty of Mathematics and Natural Sciences, Universitas Gadjah Mada for their support for fellowship, helping on institution fee, and Doctoral Dissertation Research Grant. The authors also would like to thank the Head of Laboratory of Geophysics, Basic Physics, Atomic Physics, and ELINS for their shares of some equipments. To Mr Suryono, Mr Suparwoto, and Mr Djoko, we would like to thank for their help on the instrumentations. And too Dr. Mirza for reviewing the manuspcript.
REFFERENCES
1. Kusminarto. Fisika: Penerapannya dalam Bidang Medis, Pidato Pengukuhan Jabatan Guru Besar pada FMIPA UGM. Yogyakarta: 2007.
3. Lewis GD, Gona P, Larson MG, Plehn JF, Benyamin EJ, O’Donnell CJ, et al. Exercise blood pressure and the risk of incident cardiovascular disease (from the Framingham Heart Study). Am J Cardiol 2008; 101(11):1614-20.
http://dx.doi.org/10.1016/j.amjcard.2008.01.046 4. Friedman BH, Christie IC, Sargent SL, Weaver
BJ 3rd. Self-reported sensitivity to continous non invasive blood pressure monitoring via the radial artery. J Psychosom Res 2004; 57(2):119-21. h t t p : / / d x . d o i . o r g / 1 0 . 1 0 1 6 / S 0 0 2 2 -3999(03)00597-X
5. O’Brien T, O’Malley K. ABC of blood pressure measurement. BMJ 1979; 3:1124-26.
http://dx.doi.org/10.1136/bmj.2.6198.1124 6. Yarows SA, Patel K, Brook R. Rapid oscillometric
blood pressure measurement compared to conventional oscillometric measurement, Blood Pressure Monitoring. Michigan: Lippincott & Wilkin, 2001; 6(3):145-47.
7. Greatorex CA. Instrumentation for the Measurement of Blood Pressure and Flow. London: Physics in Technology, Department of Clinical Physics, 1982.
8. Jati BME, Kusminarto, Bambang A, Irawan B. Karakterisasi Koil Penerima dan Koil RF pada Pembuatan Sistem Monitor Tekanan Fluida Mengalir Berbasis Metode NMR. Malang: Unibraw, Volume 4 Proceeding Book, 7th Basic Science National Seminar, 2010.
9. Jati BME, Kusminarto, Bambang A, Irawan B.
Design and Construction of NMR Based Flowing Fluid Monitoring System, 5th Proceedings. Solo: Kentingan Physics Forum, Physics Department Sebelas Maret University, 2010.
10. Foster MA. Magnetic resonance in medicine and biology. Oxford Pergamon Press, 1984.
11. Valk J, MacLean C, Algra PR. Basic principles of nuclear magnetic resonance imaging. Amsterdam: Elsevier, 1985.
12. Westbrook C. MRI at a Glance. Iowa, USA: Blackwell Science Ltd, 2003.
13. Georgia State University. Hyperphysics concepts. [cited Oktober 1, 2005] Avaible from URL: http:// hyperphysics.phy-astr.gsu.edu/hbase/hph.html. 14. Silvennoinen J. A study of NMR relaxation in
blood-mechanistic consideration and implication for quantitative functional MRI. Kuopio: Doctoral Dissertation, Dept. of Biomedical NMR and National Bio-NMR, Univ. of Kuopio, 2002. 15. Calvo-Vargas C, Padilla-Rios V, Meza-Flores A,
Vazquez-Linares G, Troyo-Sanromán R, Cerda AP, et al. Arterial Stiffness and blood pressure self-measurement with loaned equipment. Am J Hypertens 2003; 16(5 Pt 1):375-80.
h t t p : / / d x . d o i . o r g / 1 0 . 1 0 1 6 / S 0 8 9 5 -7061(03)00061-X
16. Zrelak P, Cisneros D, Carter T, Atkinson R. Blood pressure accurancy in the hospital. J Stroke Cerebrovasc Dis 2003; 12:252.