THE METABOLIC DISORDERS AND CARDIOVASCULAR RISK AMONG LOWER
SOCIOECONOMIC SUBJECTS IN YOGYAKARTA-INDONESIA
RITA SUHADI*, YUNITA LINAWATI, ERNA TRI WULANDARI, DITA MARIA VIRIGINIA,
CHRISTIANUS HERU SETIAWAN
Department of Pharmacology and Clinical Pharmacy, Faculty of Pharmacy, Sanata Dharma University, Yogyakarta, Indonesia. Email: ritasuhadi@usd.ac.id
Received: 24 November 2016, Revised and Accepted: 09 December 2016
ABSTRACT
Objectives: The prevalence of hypertension, diabetes mellitus, dyslipidemia, and obesity in developing countries was high regardless the socioeconomic status, whereas the awareness and the control of these metabolic disorders were inadequate. The aim was to compare the cardiovascular risk based on numbers of metabolic disorders among lower socioeconomic subjects.
Methods: The study was done with the analytical cross-sectional method. The subjects were selected with cluster random sampling from four villages. We included the subjects of 30-65 years old and signed the informed consent but excluded the subjects who had not fasted for 8-10 hrs. We analyzed the cardiovascular parameters among groups with ANOVA statistics, the difference between actual and heart vascular age (HVA) with paired t-test, and the change of six cardiovascular parameters with radar diagram.
Results: The eligible subjects (n=222) comprised 0-4 metabolic disorders at 25.2%, 33.8%, 28.8%, 9.9%, and 1.8%, respectively; with age at 50.1±9.0 years; body mass index (BMI) 24.1±4.8 kg/m2; blood pressure (BP) 141.6±23.4/82.8±11.7 mmHg; fasting blood sugar (FBS) 98.7±37.4 mg/dL;
total and high-density lipoprotein cholesterol 201.0±37.9 and 55.1±12.7 mg/dL; Framingham score was 11.4±8.9% (referred as medium risk); the difference between actual and HVA at 13.2±13.0 (p<0.05). Increasing metabolic disorders lead to higher BP, FBS, cholesterol, Framingham score, and the difference between actual and HVA (p<0.05) excluding BMI in the four metabolic disorder subgroup.
Conclusion: The subjects had the medium cardiovascular risk with above normal BMI, BP, and total cholesterol profiles. The average age, BP, FBS, cholesterol, Framingham score, and HVA were likely to increase equivalent to the numbers of metabolic disorders.
Keywords: Hypertension, Diabetes mellitus, Dyslipidemia, Obesity, Cardiovascular risk, Metabolic disorders.
INTRODUCTION
Metabolic disorders of hypertension, diabetes mellitus (DM), dyslipidemia, and obesity remarkably increased among the population across nationwide in Indonesia including in poorer socioeconomic community and rural area [1-5]. An epidemiology study among hypertension individuals (n=4950) in a developed country showed the prevalence and awareness were relatively low at 23.3% and 33.7%, whereas therapy and control of hypertension were found at 59.4% and 41.9%, respectively [6]. As a comparison, the hypertension prevalence and awareness in developing country (n=1000) were found similar at 36.7% and 34.6%, with relatively high therapy rate at 68.5%, but low blood pressure (BP) control at 24.1% [7]. Those studies showed the difficulty in achieving the therapy target of one metabolic disorder. It was likely more difficult to reach the therapy target of the three condition simultaneously. In a cohort study conducted in two health system, it was found only 16% and 30% individuals with A1C <7%, BP <140/90 mmHg, and low-density cholesterol <100 mg/dl [8].
Obesity had been reclassified as a disease since 2013. It raised new morbidities from hypertension, DM, dyslipidemia, and other diseases [9]. The obesity caused the extreme socioeconomic problems which result in negative economic growth implication. The socioeconomic problems were also augmented by inequity healthy living standard, poor food intake, and lack of physical exercise [1,4].
Hypertension, DM, dyslipidemia, and obesity, known as metabolic disorders, alone or all together become the definite risk to cause
atherosclerotic cardiovascular disease or ASCVD [10-12], a newer term for cardiovascular disease [13,14]. The hypertension was attributed as the highest health burden, particularly in the low and middle-income countries [11,15]. Meanwhile, DM was strongly related to macrovascular complications of ASCVD. Intensive early therapy of Type 2 DM prevented long-term ASCVD rates in 10-year follow-up for both primary and secondary events [14,16]. Besides DM and hypertension, dyslipidemia is also a significant atherosclerotic factor. Appropriate therapy for these metabolic disorders may may slow down the progression of various ASCVD including coronary arterial disease and stroke [13,17].
The cardiovascular disease covered almost half of the noncommunicable disease [17] with the highest incidence in low-income countries including Indonesia. [18] The annual cardiovascular mortality rate was predicted to increase from 17.3 million to >23.6 million by the year 2030 [11]. Framingham score predicts the 10-year risk of cardiovascular mortality and morbidity. The metabolic disorders of hypertension, DM, and dyslipidemia were the predictors of Framingham score [10].
The value of Framingham score can be used for cardiovascular therapy evaluation. A study done in developed countries showed that about a half of the subjects received unnecessary hypertensive therapy due to low cardiovascular risk, whereas 33.6% of the subjects did not receive therapy at nearly 20% CVD risk [6]. This study aimed to compare the cardiovascular risk calculated as Framingham score and other cardiovascular parameters based on numbers of the metabolic disorder among the subjects among the subjects with lower socioeconomic status.
METHODS
The study was done with the cross-sectional design in four study villages selected with stratified random sampling in the Sleman district of Yogyakarta. Subjects were selected with cluster random sampling with the criteria of 30-65 years old, signed the informed consent, and with the ability of verbal communication, whereas the subjects who had not followed the 8-10 hours fasting procedure were excluded.
The study protocol was approved by the Ethic Committee of Gadjah Mada University with the ethical clearance ref No: KE/FK/043/EC/2016. Questionnaires and instruments were validated before the study. The subject candidates were invited with fasting instruction to study sites. The blood specimen for total and high-density lipoprotein cholesterol (HDL-c), blood sugar, BP, body mass index (BMI), and some related to cardiovascular profile were taken in the study sites, and the blood specimen was measured in a clinical laboratory.
The analysis was performed on the cardiovascular risk factors adapted from ESH/ESC 2013 guideline [19] and Framingham score from NCEP-ATP III standard [10]. The profiles of gender, smoking, exercise, and diet were analyzed descriptively. The family history of premature cardiovascular disease was dropped from the analysis because the variable was not well-recognized by the subjects.
Smoking variable covered both of active and passive smoking. Exercise was defined as the sport activities at least once a week for more 30 minutes because almost no subjects exercised or had sport activities on most days in a week according to dietary approach to stop hypertension (DASH) program. Managed healthy diet was defined
as getting ≥8 scores from favorable answers of 11 questions based on
adjusted DASH program obtained during the subject interview [14,19].
The subjects were grouped based on the numbers of metabolic disorders from 0 (healthy) to 4 disorders. The metabolic disorders and the threshold were defined as follow: (a) High BP determined by BP
≥140/90 mmHg, (b) hyperglycemia determined by fasting blood sugar (FBS) at ≥126 mg/dL, (c) dyslipidemia determined with total cholesterol at ≥240 and/or HDL-c at ≤40 mg/dL, and (d) overweight and obesity determined by BMI at threshold at ≥23 kg/m2 and ≥25 kg/m2. The
cardiovascular parameters between groups were analyzed by ANOVA statistics followed by least significant difference post-hoc test. The number of therapy was counted based on the metabolic disorders, for example, the combination therapy in a particular metabolic disorder was counted as one item.
Further on, the subjects were calculated for the Framingham score as the 10-year prediction risk in percentage and heart-vascular age (HVA) using Excel program calculator from Framingham study [20]. In this calculation, the higher Framingham score than 30% was rounded as 30% and the value was finally stratified into <10%; 10-<20%; and
≥20% known as low; moderate; and high risk respectively [10]. The
difference between HVA and actual age was analyzed with paired t-test. All statistic calculation was done with 95% significance.
The change of the cardiovascular parameters, i.e., the age, BP, blood sugar level, cholesterol level, BMI, and Framingham score was depicted in radar diagram. The cardiovascular parameters were transformed from ratio data into four categorical data within 1-4 notch scales of low, moderate, high, and very high categorical risk (referred to hereafter as risk stratification). The threshold of high-risk stratification was adapted from ESH/ESC 2013 threshold for factors influencing prognosis and stratification of cardiovascular risk [18] except for BMI taken from WHO standard for Asian people [19,21]. The stratification of Framingham score originally had 3 levels but modified into 4 levels in this study (Table 1).
The study had the limitation that the metabolic disorders were presented by FBS, HDL-c, total cholesterol, BMI, and BP. The three earlier mentioned parameters were measured by the accredited independent
clinical laboratory, whereas the BMI and BP were measured in the study sites, the BP was measured for twice at >2 minutes interval. The determination of metabolic disorders generally needed confirmation although the confirmation measurement in the community setting will be difficult to proceed with potential high dropout.
RESULTS
The eligible subjects (n=222) were from a rural area in Sleman district of Yogyakarta Indonesia that represented a lower socialeconomic status.
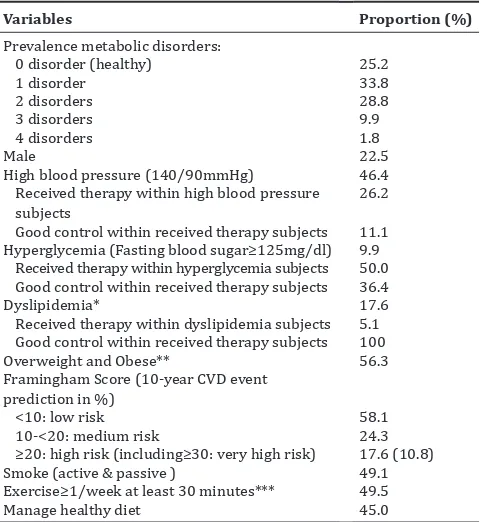
The prevalence of metabolic disorders from the highest to lowest was overweight, hypertension, hyperlipidemia, and hyperglycemia. Profile hypertension in this study was similar to the previous studies with high prevalence but low awareness and therapy [6,7,22]. Meanwhile, the prevalence of DM at 9.5% was higher than the prevalence from the previous study in Indonesia among the population above 18 years old at 5.6% [3]. The different DM prevalence was likely related to older subjects in this study at 30-65 years old. There were more individuals of high BP and dyslipidemia subjects not aware or not treated than DM subjects. The study showed a lack of awareness and control of the metabolic disease.
In this study, the BMI of 23 and 25 kg/m2 was used as the threshold
for overweight and obese based on the WHO standard for Asian population [21]. Using the lower threshold, the overweight and obese subjects reached 56.3%. The obesity exaggerated the other existing metabolic disorders to raise the cardiovascular diseases [9] (Table 2).
Some cardiovascular parameters including diastolic blood pressure (DBP), pulse, FBS; and HDL-c were found in relatively low cardiovascular risk, whereas the rest parameters were likely at high risk. In hypertension, the age risk factor on male adults was at 55-year-old younger than female adults at the age 65-year-55-year-old [19]. The age difference of risk was also different between genders for dyslipidemia with the age for male subjects at 45 years younger than female subjects at 55 years old. The average BMI at 24.1±4.8 kg/m2, in this study, was
higher than the survey among the rural population in Indonesia done in 2007, i.e., male 21.43±3.20 kg/m2 and female 22.89±4.18 kg/m2 [4].
The subjects had the average total cholesterol level higher than the threshold at 190 mg/dL and higher cholesterol level than the finding from the previous study among Indonesia population (n=222) at 188.58 mg/dL for total cholesterol and 49.18 mg/dl for HDL-c [2]. The ratio between total and HDL-c was normal (lower than 5) but higher than the optimal value at <3.5 ratio [23]. The subjects had relatively poor lifestyle based on the parameter of smoking, exercise, and diet. Smoking, lack of exercise, and healthy diet increased incidence of cardiovascular risk [14,24].
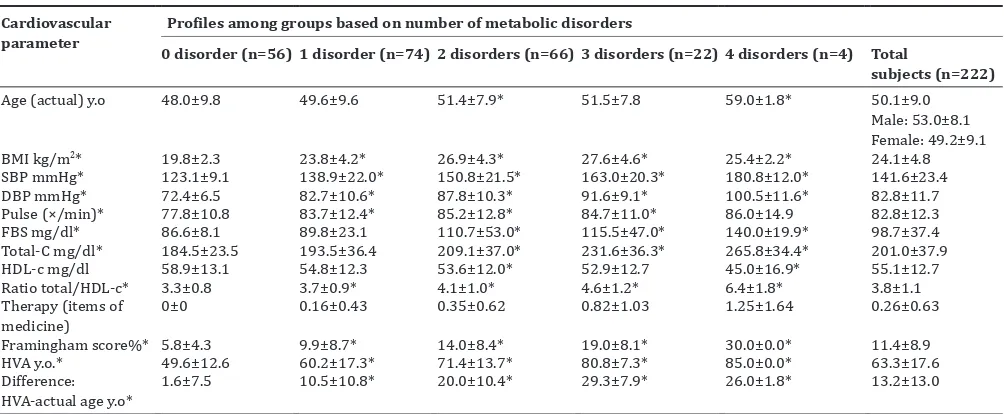
Cardiovascular parameters including age, SBP/DBP, pulse, blood glucose, total cholesterol, ratio of total HDL-c, and Framingham score increased according to the increased number of metabolic disorders. In the evaluation of a 10-year prediction of cardiovascular risk using Framingham score, the subjects were classified as medium risk. From the Framingham score calculation, it was also obtained the HVA. The HVA was higher than the threshold for both male and female cardiovascular risk age, and the HVA was also significantly higher than the actual age for more than a decade (p<0.05). Except for the healthy subject group, the groups with 1 to 4 metabolic disorders had the significantly higher HVA than their actual age (p<0.01). The highest difference was found in the group with 3 metabolic disorders (Table 3).
DISCUSSION
The subjects had the mean Framingham score at almost 20%, nearly 75% subjects with at least 1 metabolic disorder, but received the very low rate of therapy at mean 0.26±0.63 items of medicine. The findings were similar to the previous studies regarding the high prevalence of metabolic disorders and the inadequate therapy among the low socioeconomic status regardless the area [18,25]. Another study done in Latin America, India, and China also showed the high prevalence of hypertension among subjects in a rural area at 42.6-56.9%, but the prevalence was still lower than that in urban areas at 52.6-79.8% [26].
To observe the various cardiovascular parameters simultaneously could provide more comprehensive understanding of the cardiovascular risk than using a single parameter. Framingham score described the cardiovascular risk due to seven parameters. The value was applicable for the evaluation on the need for initiation and/or maintenance therapy and to avoid the unnecessary therapy or the deficiency of therapy [6].
The subjects failed to control the diseases due to lack of disease awareness, without health insurance, poor quality of lifestyle and therapy, and low persistence of therapy [14,24,27,28]. The quality of therapy was described with the type and regimen of therapy. In this study, most subjects were unaware of the disease and/or did not have routine therapy. Among those who received therapy, most of the subjects did not recognize the composition of medicine. The subjects merely knew the therapy indicated for hypertension, DM, and/or dyslipidemia; therefore, medication selection was not able to be discussed in this study.
Among the 4 metabolic disorders, DM had the most proportion of subjects received therapy and also relatively higher proportion of disease control rate than hypertension subjects, though the result needed further confirmation due to the sample size. Hypertension and hyperlipidemia were attributed as silent killers and generally had no symptoms, whereas the hyperglycemia existed in more overt and severe symptoms. The findings were similar to the previous studies from other countries [22,25].
The study showed a low rate of the metabolic disease awareness and control. BP control was poor regardless the area of study. The studies showed the difficulty in achieving the therapeutic target of 1 metabolic disorder. It was much more difficult to reach the therapeutic target of the 3 condition simultaneously. In a cohort study done in 2 health system, there were only 16% and 30% individuals with A1C <7%, BP <140/90 mmHg, and low-density cholesterol <100 mg/dL [8].
In the rural area, the subjects lived in less stressful region with stronger social interaction with neighbors, more physical works, and daily chores, less animal protein or fat or dairy product intake but the subjects encountered the paradoxical high cardiovascular risk score. The findings had likely related to unhealthy lifestyle based on the following: Almost one-half smokers, only one-half subjects doing exercise for 30 minutes or more weekly and almost no subjects doing exercise according to DASH program [14]. The low rate adherence to the healthy diet, physical exercise, and therapy was likely to the subject’s socioeconomic status including educational background and monthly income [29].
Regarding the food intake, the subjects were known to have medium to high proportion of carbohydrate from rice, 1-3 glasses of tea with sugar daily, and low to medium proportion of green vegetables or fruit. Further on, the community preferred the overcooked vegetables, frequent meal cooked with coconut milk, and with thick sugar composition. The protein was mostly from tempeh and less often from tofu. These two soya protein preparations were actually healthy, but the food was commonly served as deep-fried or rich in fat menu. The lifestyle findings were likely to relate to the subject’s cardiovascular parameters with mean Framingham score at medium risk category.
Table 1. Four scale stratification of the cardiovascular parameters
Variables Stratification of risk
1 (low) 2 (moderate) 3 (high)*1 4 (very high)
Age years old 30-<40 40-<50 50-<60*2 ≥60
BMI kg/m2 <23 23-<25 25-<35*3 ≥35
SBPmmHg/ 100-119/ 120-139/ 140-159/ ≥160/
DBPmmHg 70-79 80-89 90-99 ≥100
FBSmg/dl ≤90 91-99 100-125 ≥126
Total-C mg/dl
Framingham score% <10 10-<20 20-30*5 ≥30
*1) Stratification mostly used the modified standard from ESH-ESC 2013 cardiovascular risk stratification [19].*2) The age of cardiovascular risk was≥55 years for male and≥65 for female ESH-ESC 2013 standard.*3) BMI was standard for Asian people [21].*4) Cholesterol categorical score was determined by the worse value.*5)
Framingham score 10-year prediction has only 3 categorical scores without very high category [10].
Table 2. Profile of subjects in proportion (%)
Variables Proportion (%) Received therapy within high blood pressure subjects
26.2
Good control within received therapy subjects 11.1
Hyperglycemia (Fasting blood sugar≥125mg/dl) 9.9 Received therapy within hyperglycemia subjects 50.0 Good control within received therapy subjects 36.4
Dyslipidemia* 17.6
Received therapy within dyslipidemia subjects 5.1 Good control within received therapy subjects 100
Overweight and Obese** 56.3
Framingham Score (10-year CVD event prediction in %)
<10: low risk 58.1
10-<20: medium risk 24.3
≥20: high risk (including≥30: very high risk) 17.6 (10.8)
Smoke (active & passive ) 49.1
Exercise≥1/week at least 30 minutes*** 49.5
Manage healthy diet 45.0
* Total/HDL-cholesterol threshold for male and female: ≥190/≤50mg/dl and≥190/≤40mg/dl;** no pharmacology therapy; ***modified from DASH
In all observed cardiovascular parameters, the subjects with metabolic disorders had significantly worse value than no metabolic disorders. The worse values of the metabolic disorders were equal to the more metabolic disorders of the subjects except for the BMI parameter. The BMI parameter, particularly in the groups of 4 metabolic disorders, had the inverse value. This finding was likely related to the oldest age of the subjects in this group. Elderly was likely to be in the inanition condition with the loss of musculoskeletal mass [30,31]. Therefore, the eldest group had lower BMI parameter than the group of 2 and 3 metabolic disorders as depicted the depressed curve in radar diagram. The findings in this group needed further confirmation due to the limited sample size in the eldest group of subjects.
Parameters of age, systolic/diastolic BP, pulse, FBS, total and HDL-c, ratio of total/HDL-c, Framingham score, HVA, and partial BMI were related to number of metabolic disorders. The subjects with mean BP at 141.6/82.8 mmHg and total cholesterol at 201 mg/dL were above the normal range. The ESH/ESC standard stratified risk
as the following: (a) High risk: SBP/DBP ≥180/≥110 mmHg or
160-179/100-109 mmHg plus 3 or more risk factors, (b) moderate to
high risk: BP ≥140-159/90-99 mmHg plus 3 or more risk factors or
160-179/100-109 mmHg plus 2 or more risk factors [19]. Based on the variables of BP level, mean 1.3 metabolic disorders, relatively old age for male, high smoking prevalence, and medium Framingham score, the subjects were considered as moderate risk of cardiovascular risk. Fig. 1: Radar diagram of six cardiovascular parameters based on stratification of metabolic disorders. Fram score=Framingham score
or 10 year cardiovascular disease-risk prediction, CHOL: Total and high density lipoprotein cholesterol, BP: Systolic/diastolic BP, FBS: Fasting blood sugar, disorder(s)=metabolic disorder. Stratification based on the value in Table 1
Table 3: Comparison cardiovascular parameters of subjects based on number of metabolic disorders Cardiovascular
parameter
Profiles among groups based on number of metabolic disorders
0 disorder (n=56) 1 disorder (n=74) 2 disorders (n=66) 3 disorders (n=22) 4 disorders (n=4) Total
subjects (n=222)
Age (actual) y.o 48.0±9.8 49.6±9.6 51.4±7.9* 51.5±7.8 59.0±1.8* 50.1±9.0
Male: 53.0±8.1 Female: 49.2±9.1
BMI kg/m2* 19.8±2.3 23.8±4.2* 26.9±4.3* 27.6±4.6* 25.4±2.2* 24.1±4.8
SBP mmHg* 123.1±9.1 138.9±22.0* 150.8±21.5* 163.0±20.3* 180.8±12.0* 141.6±23.4
DBP mmHg* 72.4±6.5 82.7±10.6* 87.8±10.3* 91.6±9.1* 100.5±11.6* 82.8±11.7
Pulse (×/min)* 77.8±10.8 83.7±12.4* 85.2±12.8* 84.7±11.0* 86.0±14.9 82.8±12.3
FBS mg/dl* 86.6±8.1 89.8±23.1 110.7±53.0* 115.5±47.0* 140.0±19.9* 98.7±37.4
Total-C mg/dl* 184.5±23.5 193.5±36.4 209.1±37.0* 231.6±36.3* 265.8±34.4* 201.0±37.9
HDL-c mg/dl 58.9±13.1 54.8±12.3 53.6±12.0* 52.9±12.7 45.0±16.9* 55.1±12.7
Ratio total/HDL-c* 3.3±0.8 3.7±0.9* 4.1±1.0* 4.6±1.2* 6.4±1.8* 3.8±1.1
Therapy (items of medicine)
0±0 0.16±0.43 0.35±0.62 0.82±1.03 1.25±1.64 0.26±0.63
Framingham score%* 5.8±4.3 9.9±8.7* 14.0±8.4* 19.0±8.1* 30.0±0.0* 11.4±8.9
HVA y.o.* 49.6±12.6 60.2±17.3* 71.4±13.7* 80.8±7.3* 85.0±0.0* 63.3±17.6
Difference: HVA-actual age y.o*
1.6±7.5 10.5±10.8* 20.0±10.4* 29.3±7.9* 26.0±1.8* 13.2±13.0
Data were presented in mean±SD; SD: standard deviation, y.o: Years old, BMI: Body mass index, SBP/DBP: Systolic blood pressure/diastolic blood pressure, Total-C/HDL-c: Total cholesterol/high density lipoprotein cholesterol, HVA: Heart-vascular age, mean number of metabolic disorders: 1.3±1.0, *p<0.05 ANOVA and
Finally, we found that both pharmacology and non-pharmacology management for the metabolic disorders were insufficient in this study. The high prevalence of metabolic disorders will cause health burden in future. We propose an intervention to increase the subject disease knowledge and awareness, and therapy persistence, because of the improvement of disease detection, therapy quality increase the control of the metabolic disorders [25,28] and to avoid the adverse clinical outcome of the disease in the future [17]. A randomized control trial of health training program had recognized the improvement of the DM, hypertension, and hyperlipidemia among the low-income individuals [30]. We also recommend a further the study involving more variables of observation.
CONCLUSION
The subjects had the mean 10-year cardiovascular risk prediction with Framingham score at 11.4±8.9% and categorized as a medium cardiovascular risk, and the mean systolic BP, total cholesterol level, and calculated HVA were higher than the normal range. The six parameters of actual age, Blood pressure, cholesterol, Framingham score, and heart and vascular age increased equal to the number of metabolic disorders but excluded BMI in the group with very high-risk stratification.
ACKNOWLEDGMENTS
The researchers convey the sincere gratitude to:
1. The Director General of Higher Education, Indonesian Ministry of Research, Technology, and Higher Education for the 2016 research grant of the PUPT scheme.
2. Head of villagers in four study sites for the kind technical support during the research and the provision of the research permit. 3. All subjects who had voluntarily participated in this study with
enthusiasm.
REFERENCES
1. Aizawa T, Helble M. Forthcoming. Socioeconomic Related Inequity in Excessive Weight in Indonesia. ADBI Working Paper Series. Tokyo: Asian Development Bank Institute. Available from: http://www. asiapathways-adbi.org/2016/03/rapid-growth-of-overweight-and-obesity-in-indonesia-increasing-risk-for-the-poor/. [Last accessed on 2016 Jun 30].
2. Hatma RD. Lipid profiles among diverse ethnic groups in Indonesia. Acta Med Indones 2011;43:4-11.
3. Pramono LA, Setiati S, Soewondo P, Subekti I, Adisasmita A, Kodim N,
et al. Prevalence and predictors of undiagnosed diabetes mellitus in
Indonesia. Acta Med Indones 2010;42:216-23.
4. Roemling C, Qaim M. Obesity trends and determinants in Indonesia. Appetite 2012;58:1005-13.
5. Widjaja FF, Santoso LA, Barus NR, Pradana GA, Estetika C. Prehypertension and hypertension among young Indonesian adults at a primary health care in a rural area. Med J Indones 2013;22(1):39-45.
6. Scheltens T, Bots ML, Numans ME, Grobbee DE, Hoes AW. Awareness, treatment and control of hypertension: The ‘rule of halves’ in an era of risk-based treatment of hypertension. J Hum Hypertens 2007;21:99-106.
7. Rao V, Daniel A. Application of the “rule of halves” for hypertension as an assessment tool in an urban slum at davangere. Natl J Community Med 2014;5(3):333-6.
8. Schroeder EB, Hanratty R, Beaty BL, Bayliss EA, Havranek EP, Steiner JF. Simultaneous control of diabetes mellitus, hypertension, and hyperlipidemia in 2 health systems. Circ Cardiovasc Qual Outcomes 2012;5:645-53.
9. Jensen MD, Ryan DH, Apovian CM, Ard JD, Commuzzie AG, Donato KA, et al. AHA/ACC/TOS guideline for the management of
overweight and obesity in adults: A report of the American College of Cardiology/American Heart Association Task Force on Practice Guidelines and the Obesity Society. Circulation 2013.
10. Expert Panel on Detection, Evaluation, and Treatment of High Blood Cholesterol in Adults. Executive Summary of the third report of the national cholesterol education program (NCEP) expert panel on detection, evaluation, and treatment of high blood cholesterol in adults
(adult treatment panel III). JAMA 2001;285:2486-97.
11. World Health Organization. World Heart Federation, World Stroke Organization. Global Atlas on Cardiovascular Disease Prevention and Control: Policies, Strategies, and Interventionsl; 2011. Available from: http://www.who.int/cardiovascular_diseases/publications/atlas_cvd/en. [Last accessed on 2015 May 17].
12. World Heart Federation. Cardiovascular Disease Risk Factors; 2015. Available from: http://www.world-heart-federation.org/cardiovascular-health/cardiovascular-disease-risk-factors. [Last accessed on 2015 Apr 16].
13. Stone NJ, Robinson JG, Lichtenstein AH, Bairey Merz CN, Blum CB, Eckel RH, et al 2013 ACC/AHA guideline on the treatment of
blood cholesterol to reduce atherosclerotic cardiovascular risk in adults: A report of the American College of Cardiology/American Heart Association Task Force on Practice Guidelines. Circulation 2014;129 25 Suppl 2:S1-45.
14. American Diabetes Association. Erratum. Classification and diagnosis of diabetes. Sec 2. In Standards of Medical Care in Diabetes-2016. Diabetes Care 2016;39 Suppl 1:S13-S22. Diabetes Care 2016;39:1653.
15. Bromfield S, Muntner P. High blood pressure: The leading global burden of disease risk factor and the need for worldwide prevention programs. Curr Hypertens Rep 2013;15:134-6.
16. Fowler MJ. Microvascular and macrovascular complications of diabetes. Clin Diabetes 2008;26(2):77-82.
17. Smith SC, Collins A, Ferrari R. Holmes DR, Logstrup S, McGhie DV,
et al. WHF/AHA/ACCF/EHN/ESC presidential advisory our time :
A call to save preventable death from cardiovascular disease (heart disease and stroke). J Am Coll Cardiol 2012;60(22):2343-8.
18. Yusuf S, Rangarajan S, Teo K, Islam S, Li W, Liu L, et al. Cardiovascular
risk and events in 17 low-, middle-, and high-income countries. N Engl J Med 2014;371:818-27.
19. Mancia G, Fagard R, Narkiewicz K, Redón J, Zanchetti A, Böhm M,
et al. 2013 ESH/ESC Guidelines for the management of arterial
hypertension: The Task Force for the management of arterial hypertension of the European Society of Hypertension (ESH) and of the European Society of Cardiology (ESC). J Hypertens 2013;31:1281-357.
20. Framingham Heart Study. Cardiovascular Disease (10-Year Risk); 2015. Available from: https://www.framinghamheartstudy.org/risk-functions/cardiovascular-disease/10-year-risk.php. [Last accessed on 2015 Apr 13].
21. WHO. Global Data on Body Mass Index, BMI Classification; 2006. Available from: http://www.apps.who.int/bmi/index. jsp?introPage=intro_3.html. [Last accessed on 2015 Dec 14]. 22. McDonald M, Hertz RP, Unger AN, Lustik MB. Prevalence, awareness,
and management of hypertension, dyslipidemia, and diabetes among United States adults aged 65 and older. J Gerontol A Biol Sci Med Sci 2009;64(2):256-63.
23. Millán J, Pintó X, Muñoz A, Zúñiga M, Rubiés-Prat J, Pallardo LF,
et al. Lipoprotein ratios: Physiological significance and clinical
usefulness in cardiovascular prevention. Vasc Health Risk Manag 2009;5:757-65.
24. Venkataraman R, Kumar S, Kumarswamy M, Singh R, Pandey M, Tripathi P, et al. Smoking, alcohol, and hypertension. Int J Pharm
Pharm Sci 2013;5(4):28-32.
25. Wang T, Xu Y, Xu M, Wang W, Bi Y, Lu J, et al. Awareness, treatment
and control of cardiometabolic disorders in Chinese adults with diabetes: A national representative population study. Cardiovasc Diabetol 2015;14:28.
26. Prince MJ, Ebrahim S, Acosta D, Ferri CP, Guerra M, Huang Y, et al.
Hypertension prevalence, awareness, treatment and control among older people in Latin America, India and China: A 10/66 cross-sectional population-based survey. J Hypertens 2012;30(1):177-87.
27. Li S, Bruen BK, Lantz PM, Mendez D. Impact of health insurance expansions on nonelderly adults with hypertension. Prev Chronic Dis 2015;12:E105.
28. Liao Y, Gilmour S, Shibuya K. Health insurance coverage and hypertension control in China: Results from the China health and nutrition survey. PLoS One 2016;11(3):e0152091.
29. Elbur AI. Level of adherence to lifestyle changes and medications among male hypertensive patients in two hospitals in Taif; Kingdom of Saudi Arabia. Int J Pharm Pharm Sci 2015;7(4):168-72.
30. Goodpaster BH, Park SW, Harris TB, Kritchevsky SB, Nevitt M, Schwartz AV, et al. The loss of skeletal muscle strength, mass, and
J Gerontol A Biol Sci Med Sci 2006;61(10):1059-64.
31. Maltais ML, Desroches J, Dionne IJ. Changes in muscle mass and strength after menopause. J Musculoskelet Neuronal Interact 2009;9(4):186-97.
32. Willard-Grace R, Chen EH, Hessler D, DeVore D, Prado C, Bodenbeimer T, et al. Health coach by medical assistants to improve