MATERIALS SCIENCE FORUM MATERIALS SCIENCE FORUM
KEY ENGINEERING MATERIALS KEY ENGINEERING MATERIALS
SOLID STATE PHENOMENA SOLID STATE PHENOMENA
DEFECT AND DIFFUSION FORUM DEFECT AND DIFFUSION FORUM
DIFFUSION FOUNDATIONS DIFFUSION FOUNDATIONS
APPLIED MECHANICS AND MATERIALS
APPLIED MECHANICS AND MATERIALS
ADVANCED MATERIALS RESEARCH ADVANCED MATERIALS RESEARCH
ADVANCES IN SCIENCE AND TECHNOLOGY ADVANCES IN SCIENCE AND TECHNOLOGY
JOURNAL OF NANO RESEARCH JOURNAL OF NANO RESEARCH
JOURNAL OF BIOMIMETICS, BIOMATERIALS, JOURNAL OF BIOMIMETICS, BIOMATERIALS, AND TISSUE ENGINEERING
AND TISSUE ENGINEERING
JOURNAL OF METASTABLE AND JOURNAL OF METASTABLE AND NANOCRYSTALLINE MATERIALS NANOCRYSTALLINE MATERIALS
INTERNATIONAL JOURNAL OF ENGINEERING INTERNATIONAL JOURNAL OF ENGINEERING RESEARCH IN AFRICA
RESEARCH IN AFRICA
ADVANCED ENGINEERING FORUM ADVANCED ENGINEERING FORUM
NANO HYBRIDS NANO HYBRIDS
!
! "
# $ " ! # # # 117
$ % "" # %
"" #
!
" " # $
%Thus, we are not able to publish stand-alone papers.
" " & # ' ' ' $ ( )
( ' ' '
%
# * $ ' %
& * # + ,-./ (((% % + , * 0,.12 (((% % 3%
, # ' # 0, 2 (((% % $ , # 0, 2 (((% % $ 4 4 % $ 0 5.$ ,., $ 6 # ' 2 (((% % $ ' + + 0 ++2 (((% % $ %
. # 5 6 # $ 55. / $ %( # 7 % *% !8 88 % 5 # ' web access is EUR 1089.00 per year.
89 ''
8 :;; 8 :;; ( # !
+
<+=. <+=.
,- 5 ,5 / ,- 5 ,5 /
>?" 5 >?" 5
-5+?" @ , A 5 -5+?" @ , A 5
-.-= , A +5< , .-= , A +5< ,
MATERIALS SCIENCE FORUM
MATERIALS SCIENCE FORUM
KEY ENGINEERING MATERIALS
KEY ENGINEERING MATERIALS
SOLID STATE PHENOMENA
SOLID STATE PHENOMENA
DEFECT AND DIFFUSION FORUM
DEFECT AND DIFFUSION FORUM
DIFFUSION FOUNDATIONS
DIFFUSION FOUNDATIONS
APPLIED MECHANICS AND MATERIALS
APPLIED MECHANICS AND MATERIALS
ADVANCED MATERIALS RESEARCH
ADVANCED MATERIALS RESEARCH
ADVANCES IN SCIENCE AND TECHNOLOGY
ADVANCES IN SCIENCE AND TECHNOLOGY
JOURNAL OF NANO RESEARCH
JOURNAL OF NANO RESEARCH
JOURNAL OF BIOMIMETICS, BIOMATERIALS,
JOURNAL OF BIOMIMETICS, BIOMATERIALS,
AND TISSUE ENGINEERING
AND TISSUE ENGINEERING
JOURNAL OF METASTABLE AND
JOURNAL OF METASTABLE AND
NANOCRYSTALLINE MATERIALS
NANOCRYSTALLINE MATERIALS
INTERNATIONAL JOURNAL OF ENGINEERING
INTERNATIONAL JOURNAL OF ENGINEERING
RESEARCH IN AFRICA
RESEARCH IN AFRICA
ADVANCED ENGINEERING FORUM
ADVANCED ENGINEERING FORUM
NANO HYBRIDS
NANO HYBRIDS
! "" # ! $ % %
% &''()*+,(
$
! " # $ %
& ' ! " ( ( ) * "
% + * ,- . %
-& / " 0 " 0 % #121 3 4, & /
* %
! " 5 6 7 " ( % 5 6 ! 8 5 . 9::%
&( #
&( #
*2 0 *0 ! *2 0 *0 !
;2) 0 2
;2) 0 2
0() < *2 7 0 2 0() < *2 7 0 2 #2 * 7 (0& * #2 * 7 (0& *
Research on Energy Material, Chemical Research on Energy Material, Chemical Engineering and Mining Engineering II, Engineering and Mining Engineering II, Vol.508Vol.508
Sustainable Development of Urban and Rural Sustainable Development of Urban and Rural Areas,
Areas, Vol.507Vol.507
Advances in Transportation, Advances in Transportation, Vol.505-506Vol.505-506
Advances in Civil and Structural Engineering Advances in Civil and Structural Engineering III,
III, Vol.501-504Vol.501-504
Frontiers of Manufacturing and Design Science Frontiers of Manufacturing and Design Science IV,
IV, Vol.496-500Vol.496-500
Current Development of Mechanical Current Development of Mechanical Engineering and Energy, Engineering and Energy, Vol.494-495Vol.494-495
Advances in Applied Mechanics and Advances in Applied Mechanics and Materials,
Materials, Vol.493Vol.493
Power and Energy Systems III, Power and Energy Systems III, Vol.492Vol.492
Mechanical Design and Power Engineering, Mechanical Design and Power Engineering, Vol.490-491
Vol.490-491
Materials Science, Civil Engineering and Materials Science, Civil Engineering and Architecture Science, Mechanical Engineering Architecture Science, Mechanical Engineering and Manufacturing Technology,
and Manufacturing Technology, Vol.488-489Vol.488-489
Mechanical Structures and Smart Materials, Mechanical Structures and Smart Materials, Vol.487
Vol.487
Experimental Stress Analysis 51, Experimental Stress Analysis 51, Vol.486Vol.486
Green Power, Materials and Manufacturing Green Power, Materials and Manufacturing Technology and Applications III, Technology and Applications III, Vol.484-485Vol.484-485
! "! #
$ % &&& ' %( %% %) %* %+ ,
, ! # # ! , #- ! # # !
#- ! # # !
. ! +'*
# %(&+()/0111& & 0 &+'*
!
! " # !
$ % % $ & & " &
# ' ( )
$ * " $
$ +++
2(*
# , -. # $ * %
! ! & / & ) 0
# ' ( )
$ . 1 -2 % " $ +
" , , - + * +++
2('
) 3 . 3 #
4 & 5 / ( & ( & )/ 0
# ' ( )
$ " /& " " $
$ / " +++
2%3
! 6 - ! 7 #
( 4 8 & ( $$ & " 4 & * * $
# ' ( )
$ " " %
+++
2)%
! # 5 ! 6
& ( / 4
# ' ( )
$ " /& 13)2 $
+ * $ " +++
2)/
6 , *
-9 3:;-:< / " ( ,
" & $ 0 & (+ /
# ' ( )
$ * -91 *-2 $ . 3 :;-:<1 32 $ " +++
2*+
) # ! 1# !2 # ( ! =# ! 1! =# !2 ( $
( & 6 ( & ( " & " 4 & 6 (
# ' ( )
$ ! 1! 2 $ , $ $
$ + * +++
2+(
3 $ =5 ) # $0 ! > # 1# 2 * $ * 5
& 6 & ( & 8 "
# ' ( )
$ 1# 2 ;?
(! + $ = $ +++
2+3
P-h Curves and Hardness Value Prediction for Spherical Indentation
Based on the Representative Stress Approach
I Nyoman Budiarsa
1,aMikdam Jamal
2,b1
Mechanical Engineering, University of Udayana, Bali. Indonesia 2
AMTReL, General Engineering Research Institute, Liverpool John Moores University. UK a
[email protected] , [email protected]
Keywords: Spherical Indentation, Rockwell Hardness value, Representative stress, P-h curve.
Abstract. In this work, finite element (FE) model of spherical indentation has been developed and
validated. The relationships between constitutive materials parameters (sy and n) of elastic-plastic
materials, indentation P-h curves and hardness on spherical indenters has been systematically investigated by combining representative stress analysis and FE modelling using steel as a typical model material group. Parametric FE models of spherical indentation have been developed. Two new approaches to characterise the P-h curves of spherical indentation have been developed and evaluated. Both approaches were proven to be adequate and effective in predicting indentation P-h curves. The concept and methodology developed is to be used to predict Rockwell hardness value of materials through direct analysis and validated with experimental data on selected sample of steels. The Hardness predicted are compared with the experimental data and showed a good agreement. The approaches established was successfully used to produce hardness values of a wide range of material properties, which is then used to establish the relationship between the hardness values with representative stress.
Introduction
Indentation test is an important materials testing method in which a sharp or blunt indenter is
pressed into the surface of a material. [1]. One significant advantage of indentation is that it only
requires a small amount of materials, this makes it very attractive for the characterisation of
materials with gradient property where standard specimen is not readily available such as in situ or
in vivo tests [2] However despite its wide use, the materials behaviour (represented by the hardness or P-h curves) are not explicitly linked with the constitutive material properties. Further work is required to be able to predict indentation resistance (P-h Curves and/or hardness) from constitutive materials parameters. One of the most effective ways to analyse the indentation process has been the representative method [3]. Earlier works showed that hardness can be related to the stress of the
indented material, •r, corresponding to a representative strain, !r, which represents the mean plastic strain after yielding. The concept coupled with finite element (FE) modelling has been used successfully in analysing sharp indenters where the representative strain and stress is well defined with a fixed indenter angle [4]. It is of great importance to extend this to spherical indentation and associated hardness system. One particular case is the Rockwell B test, where the hardens is determined by two points on the P-h curve of a spherical indenter. In this case, an established link between materials parameters and P-h curves can naturally lead to direct hardness estimation from the materials parameters (such as yield stress and work hardening coefficients). This could provide an useful tool for both research and practical applications.
Materials and Experimental
The material used were steel. The tensile tests were performed using a material testing machine with extensometer. Sample steel used is solid rod-shaped elliptical of 5 mm in diameter and 90 mm long has a holder on the edges. The two main materials were used in this experiment include a carbon steel (0.1% C Steel) and mild steel specimen, The samples were sectioned, mounted in resin
2QOLQHDYDLODEOHVLQFH-DQDWZZZVFLHQWLILFQHW
7UDQV7HFK3XEOLFDWLRQV6ZLW]HUODQG GRLZZZVFLHQWLILFQHW$00
before being polished with diamond paste. The Rockwell hardness test was performed using: Wilson Rockwell hardness tester (ACCO Wilson instrument division, USA). The indentation using spherical indenter B scale, with R= 0.79 mm (Diameter steel ball =1/16 in). These HRB hardness data be used to validate the representative stress based hardness evaluation and property prediction program to be developed.
Results And Discussions
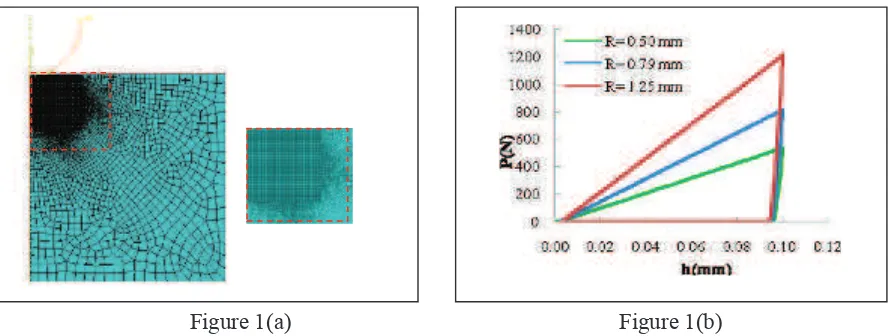
Axial symmetric 2-D space FE models were constructed to simulate the indentation response of elastic plastic solids using the commercial FE code ABAQUS, are shown in Figure 1(a). Model was used due to the symmetry of the spherical indenter. In the model, the sample size can be changed to ensure that the sample is much larger than the indenter radius/contact area during the indentation to avoid potential sample size and boundary effects [3]. The bottom line of the model was fixed in all degree of freedoms (DOF) and the central line was symmetrically constrained. The model used a free mesh controlling only the key areas, this allow implementing the mesh size in the parametric file. A gradient meshing scheme has been developed for different regions. The simulation
performed used R= 0.79 mm, and specimen model used young’s modulus= 200 GPa. Poisson ratio=
0.2. The mesh size is 10 m in the region underneath and around the indenter, while the mesh of other regions used single bias to obtain gradient mesh tightly into underneath and around the indenter to improve the accuracy of the model. In FE modelling, the accuracy of results is influenced by many factor such as the mesh shape and density, element type, friction condition and
the boundary conditions [5]. In this work encompassing a domain of Yielding strength sy from 100
to 900 MPa and strain hardening exponent n varying from 0.0 to 0.3 and Poisson’s ratio v was fixed
at 0.2.
Figure 1(a). FE Model of the spherical indentation test and close the mesh underneath. Figure 1(b).Typical force indentation depth (P-h) curves during loading and unloading for the spherical
indentation with different indenter size (materials properties used !y= 350 MPa, n=0.2)
The results of simulations FE model Spherical establish will produce p-h curve (Force-Indentation depth). Figure 1(b) shows typical P-h curve during loading and unloading phase of a typical elastic-plastic materials with different indenter sizes. The loading curve represents the resistance of material to indenter penetration, while difference between the loading and unloading curve represents the energy loss [6]. With increasing indenter size, the trends of the loading curves are similar among these models, the force value at comparable indentation depth is much higher with larger indenter sizes. The Spherical FE Model developed were validation with analytical solution of elastic material base of relationship using a known analytical solution [3] for indentation of linier elastic materials.
[image:5.595.71.518.409.577.2](1)
Where ’ ’ is the reaction force, ‘ ’ is the indenter radius; ‘E’ and ‘v’ is the Young’s modulus and Poisson’s ratio of material, respectively. ‘ ’ is the indentation depth. As shown in the Figure 2
visible the trend analysis in accordance with the numerical force–displacement data simulation FE
Model and resulting using the following analytical. This indicates a statistically curve fitting the data equally well and the FE model is congruous with the analytical model. The correlation coefficients between these two curves using a least square regression method is within 99.9%.
(a) (b) (c)
Figure 2 Comparison between the FE numerical force–displacement data and analytical solution
with elastic material model. (a) R=0.5mm; (b) R=0.79 mm; (c) R=1.25mm.
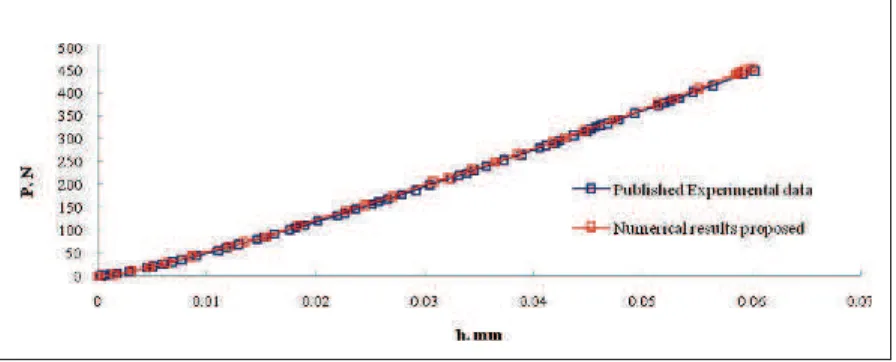
The FE spherical model was further validated by comparing the P-h curve with an elastic-plastic material model and published result data [7]. In the FE model, the material properties used were depicted directly from the published work. As shown in Figure 3 the numerical results showed good agreement with the experimental data, which suggests that the FE model is valid and the results are accurate.
The results of simulations with FE model Spherical establish will produce p-h curve. After evaluation of several approaches, two approaches have been found to be effective in representing the curves with adequate and acceptable accuracy. The first method is to use second order
polynomial fitting in the form of P= C1h2+C2h. The second fitting approach to be explored to
[image:6.595.77.513.225.357.2]represent the curve is using the force at different indentation depths. If the correlation between the force at different depth and the constitutive material properties and/or the representative stress is established, then the full P-h curve can be determined. For spherical indenter, the angle changes with the increasing depth, no fixed representative strain is readily available
[image:6.595.75.523.562.743.2]However in general, based on the deformation mechanism of an indentation process, the material deformation is controlled by the elastic deformation and the yielding, so we propose to use an effective representative stress which potentially could be linked to the C1 and C2 parameters, thus representing the full P-h curve. In the equation, C2 is linear term in the equation, so the fitting was
conducted directly associating C2 to E/sr, this term represents the balance of elastic and plastic
properties. Figure 4(a) plots the C2 vs. E/sr with the best representative strain for C2. It clearly
shows that there is a reasonable correlation between these C2 and E/sr, and the fitting isinfluenced
by the representative strain used. At a representative strain of 0.01, the fitting is reasonable with the best correlation coefficient.
C2 = 3566.9 (E/sr)0.855 (2)
The relationship directly between C1 and E/sr, has been explored with different representative
strains. Figure 4(b) The fitting are much better than that for fitting between C1/sr vs E/sr.
Comparing the correlation with different representative strains, the most effective reference strain is 0.07, which give an equation of:
C1 = 3606.8 (E/sr ) (-1.252) (3)
The correlation coefficients is over 93%. Further increasing or decreasing of the representative strains shows no improvement in correlation of the fitting. So this is the value in predicting the P-h curves to evaluate its accurate. The depth approach is much straight forward physically. In this case, the force at an indentation depth with different material properties were formulated then the relationship between the force and the representative stress was explored. An optimum representative strain and equation was determined for each depth. Figure 4(c) shows the force data
at different depth plotted against E/sr. The data for each depth was based on evaluation of series
representative strain values similar to the process used for the Cv, C1 and C2. The optimum strain at
h0.01 is 0.05, h0.02 is 0.01, h0.05 is 0.033, h0.075 is 0.02 and h0.1 is 0.045.These equations for
each depth can then be used to predict the point on the P-h curves.
Figure 4(a) Plot the C2 vs. E/sr , Figure 4(b) C1 vs. E/sr with representative strains for the full
curve approach and Figure 4(c) The relationship between forces at different depth and E/sr
[image:7.595.74.523.475.605.2]degree of agreement.This suggests that the P-h curve based approach for predicting HRB values is valid and accurate
[image:8.595.80.523.116.254.2](a) (b)
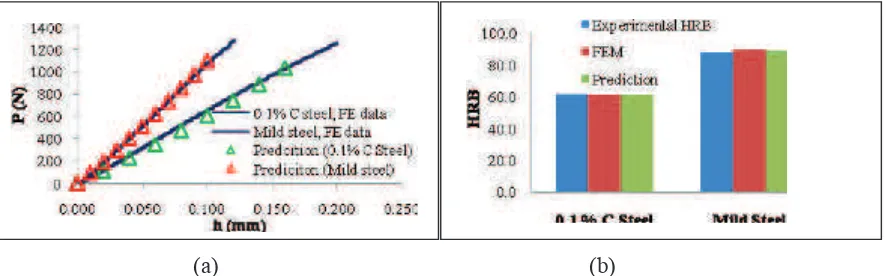
Figure 5 Comparison of the P-h curs of the two steel specimen from FE model and representative stress equations (a). Comparison between experiment and prediction Rockwell hardness value (HRB) with FE modelling for Carbon Steel 0.10 % C and. Mild Steel (b)
Base on the concept prediction of hardness base on P-h curves an inverse material parameter
estimation developed. The correlation between the HRB vs sr; HRB vs E/sr; and HRB/sr vs E/sr;
respectively. In this case, the HRB has shown a reasonable correction with all the three terms used,
while the best fitting is found to be between HRB/sr vs E/sr with an effective representative strain
of 0.033. The fitting is reasonable with the best correlation as:
HRB/sr = 0.0748 ln (E/sr) - 0.2945 (4)
These relationships (Eqs.4) established allow direct hardness prediction from material properties. This is assessed using the two steel materials as example, the predicted HRB showed a similar level of agreement with the experimental data. In the case of the 0.1 C Steel, the HRB values is within 107% of the measured value; In the case of Mild steel, the HRB is within 102 % of the measured value. Similar agreement has been found in other materials (within 5% error range). This suggests that these can be used to predict the hardness values with sufficient accuracy with the measurement error ranges.
Conclusions
References
[1] Pharr G. M., Herbert E. G., Gao Y., The Indentation Size Effect: A Critical Examination of
Experimental Observations and Mechanistic Interpretations, Annu. Rev. Mater. Res. 40: (2010)
271-92.
[2] Fischer-Cripps A. C., Introduction to Contact Mechanics, Second Edition Edi, Springer Science
+ Business media, LLC, 2007, p 213.
[3] Johnson K. L., Contact Mechanics, Cambridge: Cambridge University Press, UK (1985)
[4] Dao M., Chollacoop N., Van Vliet K. J., Venkatesh T. A. and Suresh S., Computational
modelling of the forward and reverse problems in instrumented sharp indentation, Acta
Materialia, Vol. 49 (2001) 3899–3918.
[5] Taljat B., Zacharia T. and Kosel F., New analytical procedure to determine stress-strain curve
from spherical indentation data, International Journal of Solids and Structures, Vol. 35(33),
4411-4426 (1998)
[6] Swaddiwudhipong S., Tho K. K. , Liu Z. S. and Zeng K., Material characterisation based on
dual indenters, International Journal of Solids and Structures, Vol. 42 (2005a) 69-83.
[7] Kucharski S. and Mroz Z., Identification of plastic hardening parameters of metals from
ZZZVFLHQWLILFQHW$00
3K&XUYHVDQG+DUGQHVV9DOXH3UHGLFWLRQIRU6SKHULFDO,QGHQWDWLRQ%DVHGRQWKH5HSUHVHQWDWLYH 6WUHVV$SSURDFK
!
"#$
%& "'
(&& #$
.
&/0
"
.
&&
'
.
*
#
.
**&
.
.
#
.
.
$
.
"
.
*&&/&
2) )34 4566464 7
68589: :646 7: ;69;469
<4644 7 86=6:458>63?
*59 :589@A6?!BB"
*<9849C4?))36;9489: 8664
64664648>67 :5689
644 43?464 92 9 7
94846?''
*<984
A):8A):9
4664 86
<4464 1 :
464*:68996?2)))36464 7:948
: :646 7649<4646
644 @776645:6463?
84469?#
*<984
!
.
.
'
.
D
.
D
.
D
.
#
D
.
D
.
$
D
.
94846?!#$
*<9840? E@?056)3646@
6@66@46=48>668497
4569 =6:458>6 7:5689644
4643?2 9 7469&6685?)
*<98485 9)9<)>4)6
4664 86
;;;)6)4)5F
4664 8656@2)36: :@4 677684
5@5 65 8@664 7
GHI3?*589&6>6;?B
*<984
;;;)>6 7 )8
4664 8664)9)6
4664 867664)))6)4;
4664 86;;;)C)8)F
4664 86)2J6A*KJ)34646644
9=9BA8 94966
8 : 46;45694663?
"
D
.
!
D
.
D
.
'
D
.
D
.
0L
0
1&*(/
0(
))F5 >)3:96645 7
44 7&69466<6:45
6@644 :96645 7
44 7&69466<6:45
6@644 3?4?B
*<984
;;;685)6@)8)8)F
4664 86
;;;)@6)86)5 )8)C:
4664 86M C?1)N))3:5899<6
8 444>6 697 788649;45
::984 4 8563?6858
7469?"
*<984
F?)?2)N5@?)4)3948
67 4 7 4@B<446 : 46
E648644 3?2 9 7
469&6685?$)