TRANSFORMATION OF WAVE GROUPS
IN A DIRECTIONAL SEA
Ni Nyoman PUJIANIKI
1and Wataru KIOKA
21Member of JSCE, Dept. of Civil and Environmental Eng., Nagoya Institute of Technology
(Gokiso-cho, Showa-ku, Nagoya 466-8555, Japan) E-mail: [email protected]
2Fellow of JSCE, Professor, Dept. of Civil and Environmental Eng., Nagoya Institute of Technology
(Gokiso-cho, Showa-ku, Nagoya 466-8555, Japan) E-mail: [email protected]
The purpose of this study is to determine wave group evolution by investigating the transformation of multi-directional spectra at constant depth and on a sloping beach. The transformation of wave groups can be evaluated by computing multi-directional nonlinear waves based on the third-order Zakharov equation. Initial conditions for numerical simulation were characterized by the Gaussian spectrum for several values of significant wave heights and water depths. The numerical results show that the distribution of the energy processes affects the evolution of the wave groups, and the characteristics of directional wave groups can be reproduced through the Zakharov equation model. Finally, field observation data at Akabane beach were used to demonstrate the transformation of wave groups in a real directional sea.
Key Words : wave groups, directional spectra, wave-wave interaction, Zakharov equation
1. INTRODUCTION
Waves in an actual sea are composed of an infinite number of components which have different fre-quencies and directions. Therefore, ocean surface waves have a complex pattern and are random in amplitude, period and direction. As surface waves propagate from deep to shallow water, the directional wave spectrum is transformed due to both linear and nonlinear processes. Changes in the directional spectrum due to a linear effect can be accurately predicted by linear models, which are still widely used in coastal and offshore applications. However, Elgar et al.1) found that the frequency-directional spectra of shoaled waves observed in the field and in the laboratory are significantly different from those predicted by linear theory.
According to Goda2), although sea waves may look random, inspection of wave records indicates that high waves fall into groups rather than emerge indi-vidually. The interest in wave groups is stimulated by the fact that wave grouping and associated nonlinear effects play an important role for many coastal en-gineering problems. For instance, the stability of coastal structure, irregular wave run-up and the rate of overtopping depend on the number of waves in
such a group. However, the number of works dealing with nonlinear aspects of wave group transformation is still limited.
Wave group evolution may be governed by a balance of nonlinearity, dispersion and dissipation. It has been observed in many field investigations that the distribution of waves in a group approaching the shore becomes more uniform, so that the maximum wave height in the group tends to decrease. This wave amplitude modulation may result from dissi-pation in the bottom boundary layer as well as from nonlinear and dispersive effects. Barnes and Pere-grine3) numerically obtained the reduction in the maximum wave height with a decrease in the water depth. They used a full irrotational fluid motion solver and found that the maximum wave height in the group becomes less than its initial value as the nonlinearity and dispersion cannot be balanced in shallow water, after the critical depth kh = 1.36. But furthermore, Janssen and Onorato4) found that a transfer of energy occurs as an effect of nonlinear interactions in shallow-water, with kh = 1.36/2.
The nonlinear interaction of gravity waves has been a subject of interest for many years. According to Longuet-Higgins5), the interaction produces only a small modification to the motion in the second-order,
which remains bounded in time. In the third ap-proximation, it is possible for a transfer of energy to take place from three primary waves to a fourth wave, in such a way that the amplitude of the fourth wave increases linearly with time. Nwogu6) con-ducted an investigation on the nonlinear evolution of directional wave spectra in shallow water using the second-order of the Boussinesq equation, while Kit et al.7) investigated wave group evolution in shallow water of constant depth by applying the Korteweg-de Vries equation. Good agreements between the ex-perimental and numerical results were obtained.
Evaluation of nonlinear wave groups can also be demonstrated by the third-order Zakharov equation, which was derived by Zakharov8) in 1968. Numerous investigations were subsequently executed9),10),11),12). Stiassnie and Shemer13) extended the derivation to a finite depth and to the next order. Deterministic and stochastic of Zakharov equation are described in detail in Stiassnie and Shemer14), Janssen15), and also
Eldeberky and Madsen16). The Zakharov equation can evaluate nonlinear wave fields that are free of any constraints on the spectral width. A numerical study based on the third-order Zakharov nonlinear equation, which was further modified to describe slow spatial evolution of unidirectional waves, was conducted by Shemer et al.17). Their model accurately describes the variation of the group envelopes along the tank at an intermediate water depth.
Furthermore, Kioka et al.18),19) investigated the transformation of a deterministic wave group over a 1:30 sloping beach, both experimentally in a wave tank and theoretically by a numerical solution of the Zakharov nonlinear equation. They found that wave groups of high wave steepness undergo weak defo-cusing in shallow water. The maximum wave heights no longer yield to the shoaling curves given from the finite amplitude theory. The spectrum widening and front tail asymmetry are more pronounced at these high amplitudes. Shemer et al.17) and Kioka et al.18),19) mention that the Zakharov model is capable of ac-curately describing these slow spatial variations of the group envelopes.
Unfortunately, the previous Zakharov models use a very narrow band and do not include the effect of directionality, which is possibly significant for wave-wave interaction. In the present study, non-linear aspects of directional spectra are investigated at constant depths and on a sloping beach; further-more, transformation of wave groups are analyzed. The third-order Zakharov equation is used to calcu-late nonlinear wave interaction by computing multi -directional waves. Initial conditions for numerical simulations are characterized by the Gaussian spec-trum for several values of significant wave heights and water depths. Simulation results of the
direc-tional spectra are compared with unidirecdirec-tional spectra to investigate the directional effect.
To demonstrate the transformation of wave groups in nature, field observation data at Akabane beach were used. The characteristics of nonlinear spectral evolution propagating over the continental shelf toward the coastal region are investigated using the directional components from field observations, and are then related to the evolution of the amplitude.
2. THEORETICAL MODELS
(1) The third-order Zakharov equation
The third-order Zakharov integral equation, which describes slow temporal evolution of gravity waves in water of infinite/finite depth, is given by
{
}
complex conjugate, is the Dirac δ-function and the kernel T(k,k1,k2,k3) is given in Stiassnie andShemer13) and corrected by Mase and Iwagaki20). Energy transfer is induced due to the fact that four trains of waves interact if the following resonance conditions are met among free waves:
2 1 2 3 0, ω ω ω ω1 2 3 O(ε )
+ − − = + − − ≤
k k k k , (2)
where is a small parameter representing the mag-nitude of nonlinearity, and the wave vectors k, k1, k2,
k3 and the frequencies ω, ω1, ω2, ω3 each satisfy the
following dispersion relation, with h being the water depth:
2
tanh
g h
ω = k k , (3)
In order to describe the spatial evolution, Shemer et al.17) have modified the third-order Zakharov model into the form
de-scribes the evolution of the complex amplitude B of each free wave in the spectrum due to four-wave interaction in a mild slope (|∇h | ≤ O(
2
)) space do-main, which satisfies the near-resonant condition:
2
1 2 3 0, 1 2 3 O( )
ω ω ω ω+ − − = k+ − −k k k ≤ ε , (5)
The mode-coupled discrete Zakharov equation can be written as The set of mode-coupled nonlinear complex or-dinary differential equations is solved using the fourth-order Runge-Kutta method. When calculating the kernel in Eq. (4), we have introduced Stokes’ corrections to remove near-resonance singularities. Nevertheless, Eq. (4) is invalid for water of very shallow depth; the equation requires that the disper-sion remains sufficiently strong (see Agnon21)). The first-order free surface elevation η(x,t) is related to the quantity B and computed through
{
}
(2) Wave group structure
The structure of wave groups can be quantitatively described using a wave envelope. The wave enve-lopes of various frequency bands can be calculated using a Hilbert transform. If the sea surface elevation
η(t) is a stationary random function of time, then the Hilbert transform ξ(t) is given by
Fig.1 Definition of wave group structures.
where P indicates the Cauchy value. With the Hilbert transform ξ(t) of the function η(t), the analytic func-tion is given as
( ) ( )
( ) ( )
exp{( )
}S t =η t +iξ t =A t iϕ t , (9)
The wave envelope A(t) can then be obtained by
( )
( )
1/ 22 2
( )
A t =⎡⎣η t +ξ t ⎤⎦ , (10)
The envelope A(t) is always symmetrical with respect to the t-axis, as η(t) is composed of only first-order free waves. Only the fundamental frequency band 0.5fp ~ 1.5fp, which produces free waves only and
does not include the bound waves, is considered and calculated.
The amplitude Aave denotes the average value of
the envelope amplitude (see Fig.1). The zero-up cross method relative to Aave is used to determine the
wave group period Tg. The wave group amplitudes
Agmean and Agmax denote the average and maximum of
the envelopes, respectively. The wave group period
Tgmean is the average value of Tg and Tgmax
corre-sponds to the period of the wave group containing
Agmax.
3. NUMERICAL SIMULATIONS
The wave conditions for the numerical simulation, characterized by the peak period Tp, relative water
depth kph, wave amplitude a(ω,θ) and principal
direction θ were defined for input in the nonlinear wave interaction modeling. The principal wave di-rection θ = 0 was used for all the simulations except
( )
(
)
2 2deviations for frequency and direction, respectively. By taking a finite range of frequency (ωmin,ωmax)
and direction (θmin,θmax), the initial amplitude a(ω,θ)
= (2S(ω,θ)dωdθ)1/2 was determined for calculating the complex amplitude B, which is obtained by
( ) ( )
ing the carrier wave amplitude and number) were used for simulation. The relative water depths, de-noted by kph, in deep water and intermediate water
depth are equal to 5.0 and 1.0, respectively, and the relative water depth on the sloping beach is 1.0 ≥ kph
≥ 0.5, with slope calculation kph(i) = kp (26 –
13(i/z)2), where z is the number of segments and i = 1,2,3,….z.
At intermediate water depth kph = 1.0, we are not
considering the adjustment of the spectrum as the effect of water depth, as in the Wallops spectrum. We just assume that the same shape of the Gaussian spectrum is used in deep water and at intermediate water depth.
Regarding the number of wave components of the directional spectrum, Japan Meteorological Agency (JMA) has improved their operational wave model, so that 400 components have become 900 compo-nents. The directional components of wave spectrum become fine and can express isotropic and smooth spreading, unlike the previous model22). As the pur-pose of this study is to investigate the transformation of wave groups, which strongly depends on the res-onance of the wave components, a larger number of wave components were used in this simulation. At constant depth, directional spectra were simulated with 1550 components, which consisted of 50 com-ponents of frequency and 31 directional comcom-ponents. However, in sloping cases the directional spectra were simulated with 50 frequency components and 21 directional components. Additionally, refraction effects on sloping cases were calculated based on linear theory. The directional spectra were normal-ized by the peak of the initial directional spectrum
S0(fp,θp). Finally, evolution of wave groups as a result
of the directional spectrum was compared with uni-directional simulation, which consisted of 100
fre-quency components.
The Runge-Kutta method, which solves a differ-ential equation numerically, gives the integration of the spatial evolution of the nonlinear waves.
4. RESULTS AND DISCUSSION
Now we present the results of the simulations as well as an analysis of these results. Nonlinear wave interaction effects on the evolutions of directional spectra were analyzed to investigate the transfor-mation of wave group structures. Attention is paid mainly to the transformation of directional spectra; then the evolution of the wave groups due to the nonlinear wave-wave interaction both for directional spectra and unidirectional spectra are compared.
(1) Constant depth
The Gaussian spectra for akp equal to 0.07 and
0.13 were simulated at constant water depth with relative water depth kph = 1.0; this is presented in
Fig.2. The first row in Fig.2 illustrates the directional
spectrum at x = 0 or the initial condition, whereas the second and third rows illustrate the directional spectrum at x = 50Lp. The variable Lp denotes the
length of the wave corresponding to the peak period
Tp at the spectrum. The directional spectrum for akp =
0.07 shows a very small evolution, while the evolu-tion of the direcevolu-tional spectrum for akp = 0.13
indi-cates that the directional spectrum grows at the peak frequency, increases in energy, and then distributes its energy to the side near the main direction. This energy is absorbed more from lower frequencies than from higher frequencies because the low-frequency part is affected more significantly than the high-frequency part.
With the same significant wave height for the spectra, another case was simulated in deep water with kph = 5.0. The transformation of the directional
spectrum until x = 100Lp indicates that the evolution
of the directional spectrum is very slow, as shown in
Fig.3(a). In fact, the directional spectrum undergoes
only minor modification. This indicates that the nonlinear wave interactions are affected more sig-nificantly in relatively shallow water than in deep water.
With an increase in significant wave height, akp =
0.2, evolution of the nonlinear wave interaction in deep water can be seen more clearly, as shown in
Fig.3(b). At x = 100Lp, spatial evolution of the
for intermediate water depth, in deep water the high-frequency part of the spectrum is affected more significantly than the low-frequency part. Evolution of the directional spectrum is much more pronounced at high frequency.
T
D i c i
Initial condition x = 0
T
D i c i
(a) akp = 0.07
T
D i c i
(b) akp = 0.13
Fig.2 Evolution of directional spectra from x = 0 to x = 50Lp for
the case of kph = 1.0.
T
D i c i
(a) akp = 0.1
T
D i c i
(b) akp = 0.2
Fig.3 Evolution of directional spectra at x = 100Lp for kph = 5.0.
T
D i c i
Fig.4 Evolution of directional spectra as in Fig.3(a) with
different initial random phases.
x = 0
0 5 10 15 20 25 30 35 40 45 50
-5 0 5
W ave Profile
/ A
a
v
e
0 5 10 15 20 25 30 35 40 45 50
-5 0 5
W ave Envelope
t / Tp
η
x=100Lp
0 5 10 15 20 25 30 35 40 45 50
-5 0 5
W ave Profile
/ Aa
v
e
0 5 10 15 20 25 30 35 40 45 50
-5 0 5
W ave Envelope
t / Tp
η
(a) Directional spectrum
x=0
0 5 10 15 20 25 30 35 40 45 50
-5 0 5
W ave Profile
/ A
ave
0 5 10 15 20 25 30 35 40 45 50
-5 0 5
W ave Envelope
t / Tp
η
x=100Lp
0 5 10 15 20 25 30 35 40 45 50
-5 0 5
W ave Profile
/ A
ave
0 5 10 15 20 25 30 35 40 45 50
-5 0 5
W ave Envelope
t / Tp
η
(b) Unidirectional spectrum
Fig.5 Evolution of wave groups from x = 0 to x = 100Lp for the
According to Shemer et al.17) the initial-phase in the complex wave spectra is essential in determining the eventual shape of the surface elevation variation. In this respect, the directional spectrum in Fig.3(a) was simulated again with different random phases, as presented in Fig.4. The result indicates that the en-ergy distribution on the spectrum gives a totally dif-ferent spectral shape, which will provide a difdif-ferent form of the wave groups.
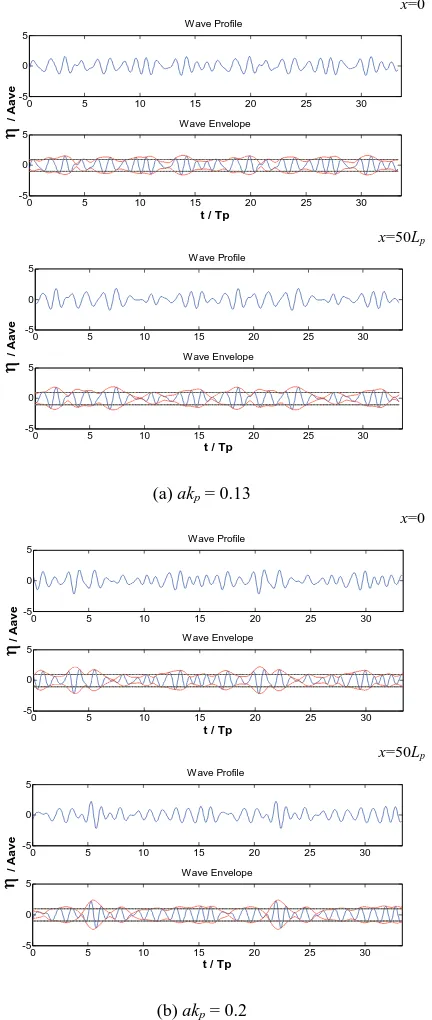
Transformation of wave groups regarding the dis-tribution of energy in the directional spectrum is given from Fig.5 to Fig.7. Wave group structures are allocated using a wave envelope. The envelopes are formed only by free waves, not including the bound waves. The initial variation of the surface elevation at
x = 0 can be compared with the surface elevation at x
= 50Lp for kph = 1.0 and at x = 100Lp for kph = 5.0.
Wave group transformation for the case of kph =
5.0 with akp = 0.1 is displayed in Fig.5. Wave group
envelopes express that the group shape is almost the same at x = 0 and x = 100Lp, which indicates that
nonlinear effects are weak. As presented before, the distribution of energy on this condition, as seen in
Fig.3(a), is a minor modification. The result of the
unidirectional spectrum also illustrates a slight evo-lution.
At high steepness, the nonlinear effects are clearly pronounced and exhibit themselves in the evolution of the shape of wave groups, as shown in Fig.6. The shape of the wave groups is totally different; the maximum value of the wave groups’ amplitude Agmax
increased slightly, accompanied by a reduction in the
Tg (Tgmean and Tgmax).
5 W ave Envelope
t / Tp
Comparison of the evolution of the wave group structures based on directional simulation and uni-directional simulation is presented in Table 1. As the effect of the initial random phase, one case is simu-lated three times and the average values of wave groups’ structures are presented.
Transformation of wave groups at intermediate water depth kph = 1.0 is displayed in Fig.7. Nonlinear
effects become stronger with increasing wave steepness, and the crest of the maximum wave group amplitude Agmax increases. The period of the maxi-
x=0
Fig.7 Evolution of directional wave groups from x = 0 to x =
mum wave group amplitude becomes wider; how-ever, the mean period is still the same.
(2) Sloping beach
Directional spectra for sloping beach cases are studied by simulated numerical calculation from intermediate through shallow water depths. For modeling the field condition, the initial condition is specified at Station A, and further, the waves prop-agate to Station B with distance 30Lp.
T
D i c i
Initial condition x = 0
T
D i c i
(a)akp = 0.07
T
D i c i
(b) akp = 0.1
T
D i c i
(c) akp = 0.13
T
D i c i
(d) akp = 0.2
Fig.8 Evolution of directional spectra on the sloping beach.
The transformations of the Gaussian spectra with increasing wave steepness are presented in Fig.8. Evolution of directional spectra indicates that the distribution of the energy is dominant in the middle range of the frequency spectrum. Transformation of the frequency spectrum describes that the nonlinear interaction transfers energy from the peak frequency of the spectrum to the lower frequency and higher frequency. At the lower frequency, energy is re-ceived from the peak frequency and absorbed, thus down-shifting the peak frequency.
The effect of shoaling on the evolution of the di-rectional spectrum is to enhance the wave height as the wave approaches the coast. Regarding the influ-ence of shoaling, the low-frequency part of the spectrum is affected more significantly than the high-frequency part. In fact, the highest frequency may not be affected at all, because the water depth may be larger for these frequencies.
As the waves propagate to the coast, the direc-tional spreading becomes narrow owing to the wave refraction effect. Because the waves are propagating perpendicularly to the coast, the energy is increasing in this direction. However, at the highest steepness,
akp = 0.2, the energy at the peak frequency decreases,
generating another peak at a lower frequency, which affects the wave profile.
The wave profiles evolve into a form with sharp and high crests and shallow and flat troughs, as shown in the last wave profiles of Fig.9. Because the heights of larger waves are more enhanced than those of smaller waves, the distribution of individual wave heights becomes stretched. Evolution of wave groups at lower steepness indicates that the shape of the wave groups is almost the same, and slightly changes at akp = 0.13. Transformations of directional wave
groups on the sloping beach are also compared with unidirectional spectra. Evolution of wave group structures is also presented in Table 1.
With the same initial peak energy density on the frequency spectrum, the unidirectional simulation produces a higher initial amplitude than directional simulation. The maximum amplitude Agmax is not the
real maximum wave height, because the simulation does not include the bound wave component; there-fore, the value is slightly smaller than the real wave. Comparison of evolutions of wave groups on di-rectional spectra with those on unididi-rectional spectra indicates that evolution of wave groups in deep water and at intermediate water depth significantly affects nonlinear interaction in directional simulations.
When the directional effect is considered, trans-formation of wave groups in deep water is much more pronounced at akp = 0.2. The effects of wave
however, the nonlinear interaction is reduced on a sloping beach, which decreases the maximum wave height.
In deep water, by increasing the wave steepness, the variability of the characteristic wave amplitude is increased. This is followed by a reduction in the wave group period (Tg), whereas at intermediate depth the maximum wave amplitude in the group isincreased,
but the maximum wave group period becomes
slightly longer. However, when the nonlinear pa-rameter increases on the sloping beach, the wave groups become stretched. This reduces the maximum wave group amplitude and increases the maximum wave period.
The wave profiles have almost the same period but gradually varying amplitudes. This is caused by the energy of the wave spectrum, which is concentrated within a narrow range of frequency. The variability of the characteristic wave height increases as the
spectral peak becomes sharp. However, if the fre-quency spectrum gets narrower, the envelope be-comes longer, and if the directional spread decreases, the wave crest widens.
(3) Field Observation
The wave data were collected 6km offshore (Sta-tion A; 26m deep) and 1km offshore (Sta(Sta-tion B; 13m deep) in an extension line perpendicular to the coastal line at Akabane in the Atsumi Peninsula, Japan on the Pacific coast. The bathymetry is nearly uniform, and the bottom slope changes gradually from 1/400 to 1/100. The measurements were performed by 2 wave gauges located at intermediate water depths, with 1.0
≥ kph ≥0.5. The sea surface elevation and bottom
velocities were recorded every two hours for one hour long at a sampling data rate of 0.5 s for the ob-servation period23).
W ave Envelope
t / Tp
Table 1 Comparison of the evolution of wave groups structures
for directional spectra with that for unidirectional spectra.
Wave group structures Agmean
/Aave
Agmax
/Aave
Tgmean /Tp
Tgmax /Tp
kph = 5.0
Directional
akp = 0.1 x = 0 1.35 2.04 4.17 5.00
x= 100Lp 1.33 2.02 4.17 5.00
akp = 0.2 x = 0 1.49 1.88 4.17 6.80
x= 100Lp 1.72 2.77 3.33 5.20 Unidirectional
akp = 0.1 x = 0 1.45 2.64 2.94 4.44
x= 100Lp 1.56 2.85 2.94 4.44
akp = 0.2 x = 0 1.40 2.58 2.94 4.44
x= 100Lp 1.41 2.59 2.50 4.00
kph = 1.0
Directional
akp = 0.13 x = 0 1.20 2.02 4.17 5.00
x= 50Lp 1.43 1.90 4.17 7.40
akp = 0.2 x = 0 1.55 2.19 4.17 2.50
x= 50Lp 1.32 2.38 4.17 3.33 Unidirectional
akp = 0.13 x = 0 1.46 2.65 2.94 4.44
x= 50Lp 1.53 2.78 2.94 4.44
akp = 0.2 x = 0 1.45 2.65 2.94 4.44
x= 50Lp 1.48 2.95 2.94 5.00
Sloping
Directional
akp = 0.13 St. A 1.24 2.33 5.20 6.90 St. B 1.30 2.32 5.20 7.50
akp = 0.2 St. A 1.57 2.30 3.50 3.80 St. B 1.41 1.78 4.17 6.90 Unidirectional
akp = 0.13 St. A 1.46 2.64 2.94 4.44 St. B 1.54 2.58 2.94 5.00
akp = 0.2 St. A 1.45 2.59 2.94 4.44 St. B 1.44 2.18 3.13 5.00
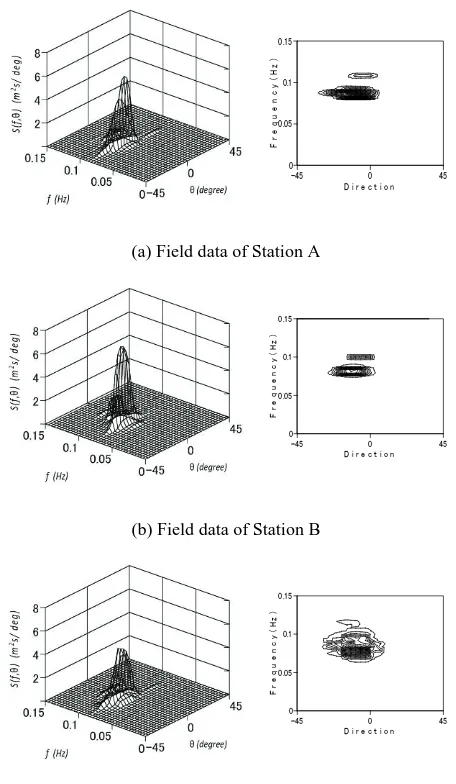
Using the measurements from field observations at Akabane Beach, data on August 8, 2006 were cal-culated. The initial condition of the directional spectrum was determined by the incident wave spectrum which was obtained at Station A, as shown in Fig.10. The initial directional spectrum at Station A indicates that the spectrum centered on peak fre-quency fp = 0.084 and θ = -9
º
. Waves propagated from Station A to Station B with a relative water depth of 1.0 ≥ kph ≥0.5. An angle of 0 indicates a line
perpendicular to the shoreline.
The directional spectrum of field data at Station B was used to verify the numerical result, and it indica- tes that the spectrum increases the peak frequency. The directional spectrum of field data was calculated
F
c
H
D i c i
(a) Field data of Station A
F
c
H
D i c i
(b) Field data of Station B
F
c
H
D i c i
(c) Simulation result of Station B
Fig.10 Directional spectra of the field data.
using the EMLM estimation method24). All available theories are based on linear theory, therefore we admit the linear theory analysis, but only the fun-damental frequency band is considered, and that composes the free wave only.
The numerical results of the spatial evolution di-rectional spectrum at Station B indicate that the en-ergy transfer occurs from the peak frequency to the lower frequency and higher frequency; therefore, the spectrum slightly widens in frequency and narrows in direction. The results of numerical simulation at Station B show a trend close to the directional spec-trum of field data; however, the energy at peak fre-quency looks smaller than in the field data. This discrepancy is caused by the effects of the linear calculation on the field data.
on the nonlinear directional spectra; however, the result only gives minor evolution. Therefore, the effect of white-capping in this simulation is weak.
Wave group envelopes from measurement data at Station A and Station B are shown in Fig.11. In this figure, the wave group envelopes were governed only by the fundamental frequency, without the bound waves. Using the Hilbert transform wave group structure at Station A, the values Aave = 1.08m, Agmean
= 1.31m, Agmax = 2.16m, Tgmean = 80s and Tgmax = 72s
were obtained; further at Station B, Aave = 1.03m,
Agmean = 1.25m, Agmax = 2.15m, Tgmean = 80s and
Tgmax = 147s.
Wave groups from the simulation results at Station B are presented in Fig.12. As discussed previously, the initial random phase that affects the energy dis-tribution is different, which will affect the wave profiles and, further, the wave groups. Therefore, we calculated the directional spectrum at Station A three times, as shown in Fig.12.
The envelopes of the wave group were also formed by free waves only. By the Hilbert transform calcu-lation, wave groups’ structures at Station A were obtained: Aave = 1.07m, Agmean = 1.30m, Agmax =
2.12m, Tgmean = 80s and Tgmax = 72s and the wave
groups’ structures as a result of directional simula-tion at Stasimula-tion B: Aave = 1.13m, Agmean = 1.38m, Agmax
= 2.10m, Tgmean = 80s and Tgmax = 150s.
Wave group structures from the simulation results are in good agreement with the field data; therefore, this model could be used to predict the evolution of a wave group. Although the field data and simulation results have different shapes of directional spectra and wave group envelopes, they produce almost the same wave group structures.
5. CONCLUSIONS
The transformation of wave groups has been investigated by numerical simulation based on the third-order Zakharov equation. The main conclusions can be summarized as follows.
The third-order Zakharov equation model is able to predict the effect of the nonlinear interaction on the transformation of directional spectra for constant depth and for a sloping beach. The nonlinear transfer of energy was found to control the shape of the spectrum, including the development of the peak and the wave groups.
In relatively shallow water, nonlinear wave interactions appear to have a more significant effect than in deep water. The low-frequency part of the spectrum is affected more significantly than the high-frequency part; however, in deep water the
high-frequency part is affected more significantly than the low-frequency part.
On the sloping beach, the transformation of direc-tional spectra indicates that the lower frequencies are enhanced more than the higher frequencies. This results in a higher energy in the principal direction, and the peak of the spectrum slightly shifts to the lower frequency.
St.A
Fig.11 Wave groups’ evolution based on field data from St. A to
St. B.
Fig.12 Wave groups’ evolution based on simulation results at
By increasing the wave steepness, the effects of the nonlinear wave interaction become stronger. The evolution of the directional spectrum is much more pronounced at a high steepness than at a lower steepness.
Wave groups can be characterized by the wave envelopes. The Zakharov equation, which contains initial-phase information, can be advantageous for prediction of the evolution of the wave groups’ envelope. Initial random phases significantly affect the distribution of energy on the spectrum and the eventual shape of wave groups; however, they pro-duce almost the same wave group structures.
The transformation of the wave groups is in accordance with the evolution of the directional spectrum. If the energy of the wave spectrum is concentrated within a narrow range of frequency, the wave profiles have almost the same period, but gradually varying amplitudes.
The variability of the characteristic wave height increases as the spectral peak becomes sharp. However, if the frequency spectrum gets narrower, the envelope becomes longer, and if the directional spread decreases, the wave crest widens.
The comparison of the wave group evolutions on directional spectra to those on unidirectional spectra indicates that evolutions of wave groups in deep water and at intermediate water depths are signifi-cantly affected by nonlinear interactions between directional components. When a three-dimensional model is considered, transformation of wave groups in deep water is much more pronounced at akp = 0.2.
The effects of wave interaction are enhanced in relatively shallow water; however, the nonlinear interaction is suppressed on a sloping beach, which decreases the maximum wave height.
By increasing the wave steepness, nonlinear wave-wave interaction becomes more pronounced and induces wave breaking. This strong wave instability may be investigated on the basis of fully nonlinear theory in future studies.
ACKNOWLEDGMENT: The first author is greatly
thankful to the Government of Indonesia (Ministry of National Education of the Republic of Indonesia) for providing a scholarship, and to Katoh H. for the data from field observation and some source codes for simulation. A part of this study was supported by a Grant-in-Aid for Scientific Research from the MEXT of Japan.
REFERENCES
1) Elgar, S., Guza, R. T. and Freilich, M. H. : Observations of nonlinear interactions in directionally spread shoaling sur-face gravity waves, J. of Geophysical Research, Vol. 98, pp. 20299-20305, 1993.
2) Goda, Y. : Random Seas and Design of Maritime Structure, World Scientific, 2009.
3) Barnes, T. and Peregrine, D. H. : Wave groups approaching a beach : Full irrotational flow computation, Proc. Coastal
Dynamic, Vol. 95, pp. 116-127, 1995.
4) Janssen, P. A. E. M. and Onorato, M. : The intermediate water depth limit of the Zakharov equation and conse-quences for wave prediction, Journal of Physical
Ocean-ography, Vol. 37, pp. 2389-2399, 2007.
5) Longuet-Higgins, M. S. : Resonant interaction between two train of gravity waves, J. Fluid Mech., Vol. 12, pp. 321-332, 1962.
6) Nwogu, O. : Nonlinear evolution of directional wave spec-tra in shallow water, Proc. 24th International Conference
on Coastal Engineering, Kobe, Japan, Vol. I, 467-481,
1994.
7) Kit, E., Shemer, L., Pelinovsky, E., Talipova, T., Eitan, O. and Jiao, H. : Nonlinear wave group evolution in shallow water, Journal of Waterway, Port, Coastal and Ocean
En-gineering, September/October, pp. 221-228, 2000.
8) Zakharov, V. : Stability of periodic waves of finite ampli-tude on the surface of a deep fluid, J. Appl. Mech. Tech.
Phys., Vol. 9, pp. 190-194, 1968.
9) Crawford, D. R., Saffman, P. G. and Yuen, H. C. : Evolu-tion of a random inhomogeneous field of nonlinear deep water gravity waves, Wave Motion, Vol. 2, No.1, pp 1-16, 1980.
10) Zakharov, V. : Statistical theory of gravity and capillary waves on the surface of a finite depth fluid, Eur. J. Mech. B, Vol. 18, No. 3, pp. 327-344, 1999.
11) Kit, E. and Shemer, L. : Spatial versions of the Zakharov and Dysthe evolution equations for deep water gravity waves, J. Fluid Mech., Vol. 450, pp. 201-205, 2002. 12) Stiassnie, M. and Gramstad, O. : On Zakharov’s kernel and
the interaction of non-collinear wave trains in finite water depth, J. Fluid Mech., Vol. 639, pp. 433-442, 2009. 13) Stiassnie, M. and Shemer, L. : On modifications of the
Zakharov equation for surface waves, J. Fluid Mech., Vol.143, pp. 47-67, 1984.
14) Stiassnie, M. and Shemer, L. : On the interaction of four water-waves, Wave Motion, Vol. 41, No. 4, pp. 307-328, 2005.
15) Janssen, P. A. E. M. : Nonlinear four-wave interactions and freak waves, Journal of Physical Oceanography, Vo. 33, pp. 863-884, 2003.
16) Eldeberky, Y. and Madsen P. A. : Deterministic and sto-chastic evolution equation for fully dispersive and weakly nonlinear waves, Coastal Engineering, Vol. 38, pp. 1-24, 1999.
17) Shemer, L., Jiao, H., Kit, E. and Agnon, Y. : Evolution of a nonlinear wave field along a tank: experiments and nu-merical simulations based on the spatial Zakharov equation,
J. Fluid Mech., Vol. 427, pp. 107-129, 2001.
18) Kioka, W., Hayashi, N. and Kitano, T. : Transformation of strongly nonlinear wave group over sloping beach, Proc. of
the third International Conference on Asian and Pacific Coasts, pp. 90-99, 2005.
19) Kioka, W., Okajima, M., Pujianiki, N. and Kitano, T. : Reflection of strongly nonlinear waves from a vertical wall on sloping beach, JSCE-B2, Vol. 67, No. 2, pp. I_1-1_5, 2011.
20) Mase, H. and Iwagaki, Y. : Wave group analysis of natural wind waves based on modulational instability theory,
Coastal Engineering, Vol. 10, pp. 341-354, 1986.
of JMA operational wave models, 10th International
Workshop on Wave Hindcasting and Forecasting and Coastal Hazard Symposium, Oahu, Hawaii, 2007.
23) Kioka, W., Katoh, H. and Kitano, T. : Field observations of wave group transformation during high waves, JSCE-B2, Vol. 54, No. 1 pp. 161-165, 2007.
24) Johnson, D. : Diwasp user manual version 1.2, Coastal
Oceanography Group Centre for Water Research University of Western Australia, Perth, 2006.
25) Lin, L. and Lin, R. Q. : Wave breaking function, 8th
In-ternational Workshop on Wave Hindcasting and Fore-casting, North Shore, Oahu, Hawaii, 2004.