http://www.researchgate.net/publication/259326231
Molecular evidence for co-occurring
cryptic lineages within the Sepioteuthis cf.
lessoniana species complex in the Indian
and Indo-West Pacific Oceans
ARTICLE in HYDROBIOLOGIA · DECEMBER 2013
Impact Factor: 2.28 · DOI: 10.1007/s10750-013-1778-0
CITATIONS
5
READS
86
11 AUTHORS, INCLUDING:
Frank E. Anderson
Southern Illinois University Carbondale 33PUBLICATIONS 635CITATIONS
SEE PROFILE
Gusti Ngurah Mahardika
Udayana University
42PUBLICATIONS 110CITATIONS
SEE PROFILE
Z.A. Muchlisin, Ph.D
Syiah Kuala University 97PUBLICATIONS 210CITATIONS
SEE PROFILE
Kolliyil Sunilkumar Mohamed
Central Marine Fisheries Research Insti… 88PUBLICATIONS 198CITATIONS
C E P H A L O P O D B I O L O G Y A N D E V O L U T I O N
Molecular evidence for co-occurring cryptic lineages
within the
Sepioteuthis
cf.
lessoniana
species complex
in the Indian and Indo-West Pacific Oceans
S. H. Cheng•F. E. Anderson•A. Bergman•G. N. Mahardika• Z. A. Muchlisin• B. T. Dang•H. P. Calumpong• K. S. Mohamed• G. Sasikumar• V. Venkatesan•P. H. Barber
Received: 18 December 2012 / Accepted: 30 November 2013 ÓSpringer Science+Business Media Dordrecht 2013
Abstract The big-fin reef squid, Sepioteuthis cf. lessoniana(Lesson 1930), is an important commodity species within artisanal and near-shore fisheries in the Indian and Indo-Pacific regions. While there has been some genetic and physical evidence that supports the existence of a species complex withinS.cf.lessoniana, these studies have been extremely limited in scope geographically. To clarify the extent of cryptic diver-sity within S. cf. lessoniana, this study examines phylogenetic relationships using mitochondrial genes (cytochrome oxidase c, 16s ribosomal RNA) and nuclear genes (rhodopsin, octopine dehydrogenase)
from nearly 400 individuals sampled from throughout the Indian, Indo-Pacific, and Pacific Ocean portions of the range of this species. Phylogenetic analyses using maximum likelihood methods and Bayesian inference identified three distinct lineages with no clear geo-graphic delineations or morphological discrimina-tions. Phylogeographic structure analysis showed high levels of genetic connectivity in the most wide-spread lineage, lineage C and low levels of connectiv-ity in lineage B. This study provides significant phylogenetic evidence for cryptic lineages within this complex and confirms that cryptic lineages of S. cf. lessonianaoccur in sympatry at both small and large spatial scales. Furthermore, it suggests that two closely related co-occurring cryptic lineages have pronounced differences in population structure, implying that Guest editors: Erica A. G. Vidal, Mike Vecchione & Sigurd
von Boletzky / Cephalopod Life History, Ecology and Evolution
S. H. Cheng (&)P. H. Barber
Department of Ecology and Evolutionary Biology, University of California-Los Angeles, Los Angeles, CA, USA
e-mail: [email protected]
F. E. AndersonA. Bergman
Department of Zoology, Southern Illinois University, Carbondale, IL, USA
G. N. Mahardika
Fakultas Kedokteran Hewan, Universitas Udayana, Sesetan-Denpasar, Bali, Indonesia
Z. A. Muchlisin
Koordinatorat Kelautan dan Perikanan, Universitas Syiah Kuala, Banda Aceh, Indonesia
B. T. Dang
Institute of Biotechnology and the Environment, Nha Trang University, Nha Trang, Vietnam
H. P. Calumpong
Institute of the Environment and Marine Science, Silliman University, Dumaguete, Philippines
K. S. MohamedV. Venkatesan
Molluscan Fisheries Division, Central Marine Fisheries Research Institute (CMFRI), Cochin, Kerala, India
G. Sasikumar
underlying differences in ecology and/or life history may facilitate co-occurrence. Further studies are needed to assess the range and extent of cryptic speciation throughout the distribution of this complex. This information is extremely useful as a starting point for future studies exploring the evolution of diversity withinSepioteuthisand can be used to guide fisheries management efforts.
Keywords Cryptic diversityMarine MyopsidaeSepioteuthisSquids Phylogenetics
Introduction
Tropical coral reefs contain approximately one-third of all described marine organisms. However, it is widely acknowledged that biodiversity counts in marine environments are grossly underestimated (Sala & Knowlton,2006; Bickford et al.,2007) and only 10% of existing reef species (*93,000 species) have been
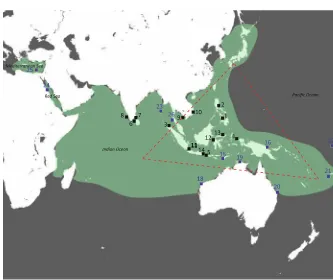
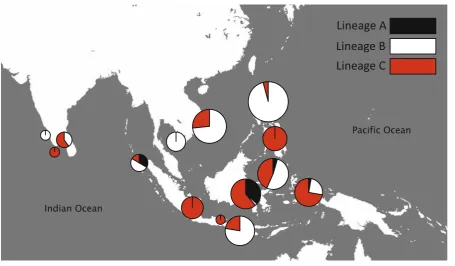
discovered and described (Reaka-Kudla, 1997). In part, this underestimation is due to high levels of cryptic/sibling species (Knowlton,1993,2000). This presents a huge challenge to cataloguing marine biodiversity as such species complexes lack traditional morphological differences and may differ in physiol-ogy, behavior, or chemical cues (Knowlton, 1993) which would only be obvious with sufficient observa-tion and comparison. In particular, the global epicenter of marine biodiversity, a region called the Coral Triangle (Fig.1) comprises just 1% of global ocean area yet contains the highest number of described species in the marine realm (Briggs,1999), including many cryptic and/or endemic species (Allen & Werner,
2002; Allen,2008; Anker,2010). Furthermore, strong genetic breaks across many taxonomic groups (e.g., Carpenter et al., 2011) including damselfish (Drew et al.,2008; Leray et al.,2010), giant clams (DeBoer et al.,2008; Nuryanto & Kochzius,2009), gastropods (Crandall et al.,2008), seastars (Williams & Benzie,
1997), pelagic fishes (Fauvelot & Borsa,2011), benthic crustaceans (Barber & Boyce, 2006; Barber et al.,
2006,2011), and neritic reef fishes (Planes & Fauvelot,
2002; Ovendon et al.,2004; Gaither et al.,2009,2011), indicate a potential for many more cryptic taxa. However, most of the above studies have focused on benthic invertebrates. Considerably less is known
about larger organisms, especially those of commercial importance such as pelagic fishes and cephalopods.
Recent revisions within the Indo-West Pacific region (including the Coral Triangle) documented numerous new cephalopod species particularly among Sepiidae (cuttlefishes), Loliginidae (neritic myopsid squids), and littoral octopods (Natsukari et al., 1986; Norman & Sweeney,1997; Norman & Lu,2000; Okutani,2005). Genetic evidence for cryptic species complexes in cuttlefishes (Anderson et al., 2011), myopsid squids (Vecchione et al., 1998; Okutani, 2005), and neritic loliginid and cuttlefish species (Yeatman & Benzie,
1993; Izuka et al., 1994, 1996a, b; Triantafillos & Adams,2001,2005; Anderson et al.,2011) suggests that the diversity of cephalopods in the Indo-Pacific exceeds current taxonomic delineations and needs to be explored further. However, to date, many studies suggesting cryptic diversity within these groups have been limited in geographic scope and use different sources of information to infer cryptic species, making compre-hensive diversity assessments very difficult.
One nominal cephalopod species in particular, the big-fin reef squidSepioteuthiscf.lessoniana, Lesson, 1830 is a common, commercially harvested squid throughout the Indo-Pacific region. Substantial mor-phological and genetic evidence indicate that extre-mely high levels of cryptic diversity exist within this taxon. A taxonomic revision by Adam (1939), synon-omized 12 Indo-West PacificSepioteuthisspecies into S. cf.lessoniana, relegating any noted differences to geographic variability.S. cf. lessonianaranges from the central Pacific Ocean (Hawaii) to the western Indian Ocean (Red Sea) and into the eastern Mediter-ranean via Lessepsian migration (Salman,2002; Mie-nis,2004; Lefkaditou et al.,2009). Evidence for cryptic species inS. cf.lessonianafirst arose in Japan, with the recognition of three distinct color morphs and corre-sponding isozyme differentiation inS.cf.lessoniana harvested from around Ishigakijima in Okinawa Pre-fecture in Southwestern Japan (Izuka et al., 1994,
boundaries (Jackson & Moltschaniwsky,2002). How-ever, these studies only document cryptic diversity in two point locations within a very broad range.
Despite their importance in sustaining local econ-omies and food security of Indo-West Pacific com-munities, near-shore cephalopods, including S. cf. lessoniana, within the Coral Triangle and the sur-rounding Indo-West Pacific are relatively understud-ied. This study aims to provide an in-depth assessment of S. cf. lessoniana cryptic diversity in the region. Given the wide applicability of molecular methods for cryptic species detection, both mitochondrial and nuclear DNA evidence will be used to provide a phylogenetic assessment of the species complex.
Methods
Collection localities and sampling techniques
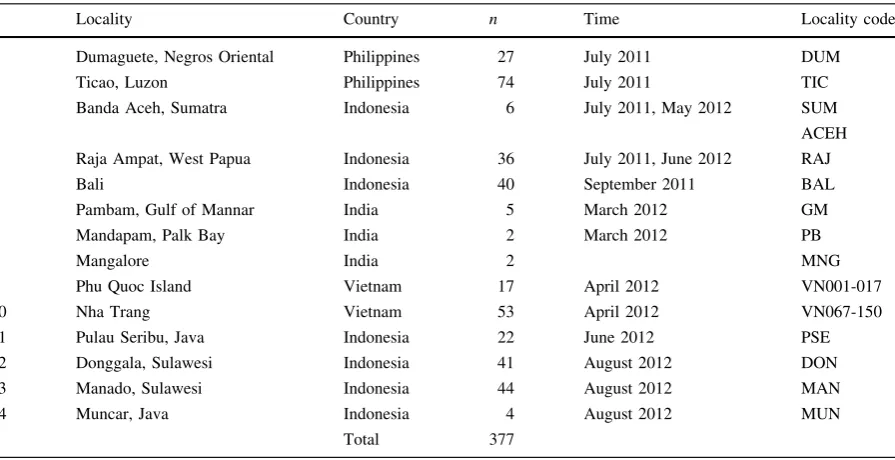
A total of 377 juvenile and adult S. cf. lessoniana specimens were collected from local fish markets and via hand jigging (day and night) from 14 locations
throughout Indonesia, the Philippines, Vietnam, and Southern India (Fig.1; Table1) from 2011 to 2012. Fishing localities of most samples were not more than
*10–20 km offshore judging from interviews with
fishermen and type of vessel and motor used. Samples obtained from the markets had been collected primarily using hand jigs over reef and sea grass beds and occasionally via beach seines in sea grass habitats (Ticao, Luzon, Philippines). Fishing forS.cf. lesson-ianamostly took place at night, with the exception of samples caught in Pulau Seribu, Indonesia. Mantle tissue was preserved in 95% ethanol. Voucher speci-mens were preserved in 10% formalin when available.
DNA extraction and amplification
Total genomic DNA was extracted from 1 to 2 mg of ethanol-preserved mantle tissue using Chelex (Walsh et al., 1991). Two mitochondrial and two nuclear genes were amplified in this study: mitochon-drial cytochrome oxidase subunit 1 (CO1 or cox1), 16s ribosomal RNA (rrnL), rhodopsin, and octo-pine dehydrogenase (ODH). From the inferred Fig. 1 Range of Sepioteuthis cf. lessoniana and sampling
localities for this study.Areas highlighted in greenrepresent the reported range ofS.cf.lessoniana(Jereb & Roper,2010).Black
squaresindicate localities with the numerals corresponding to
mitochondrial lineages, two nuclear genes were amplified from a subset of individuals. The mitochon-drial genes were amplified together using a multiplex-ing approach usmultiplex-ing a Qiagen Multiplex kit followmultiplex-ing the standard published protocol for 25ll reactions. CO1 and 16s were amplified using universal HCO-2198 and LCO-1490 primers (Folmer et al., 1994) and 16sAR and 16sBR primers (Kessing et al., 1989), respectively. Rhodopsin and ODH were amplified using cephalopod specific primers (Strugnell et al.,
2005) in 25ll Amplitaq Hotstart PCR reactions. PCR thermal cycling parameters were as follows: initial denaturation for 94°C for 120 s, then cycling 94°C for 15 s, 36–68°C for 30 s, and 72°C for 30 s for 25–30 cycles, following by a final extension step of 72°C for 7 min. The following annealing temperatures were used: 36°C for CO1, 42°C for 16s, 55°C for rhodopsin, and 68°C for ODH. The resulting amplified products were cleaned up and sequenced at the UC Berkeley DNA Sequencing Facility. Samples collected from India were amplified and sequenced at the Anderson lab at Southern Illinois University-Carbondale following the protocols outlined in Anderson et al. (2011).
Data analysis
DNA sequences were edited and checked in Sequencher v 4.1 (Gene Codes, Ann Arbor, MI, US). Sequences for
each gene region were aligned using the CLUSTALW plug-in implemented in Geneious. As the 16s alignment was characterized by a number of large gaps (n=5), the initial alignment was realigned to an invertebrate 16s structural constraint sequence (Apis mellifera) with RNAsalsa (Stocsits et al.,2009) using default parame-ters. Unique haplotypes were identified among the sampled individuals for all gene regions using the DNAcollapser tool in FaBox (Villesen,2007). For each individual gene dataset, Kimura-2-parameter distances and haplotype diversity (with standard error) were calculated within and between each lineage in Arlequin 3.5.1.2 (Excoffier & Lischer,2010).
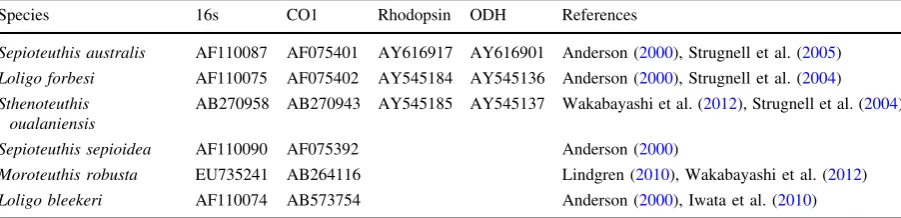
Individual gene alignments were first analyzed with both maximum likelihood methods (RAxML 7.3.2) and Bayesian inference (MrBayes 3.1.2) on the CIPRES Science Gateway (Miller et al.,2010) using sequences of Sepioteuthis australis,Loligo bleekeri, and Sthenoteuthis oualaniensis obtained from Gen-Bank (Table2) as outgroups. Total sequence data from 87 representative individuals were then concat-enated in Mesquite into three datasets—mitochondrial genes, nuclear genes, and all genes. After comparing the results from individual and concatenated datasets, the mitochondrial dataset were run using 70 additional individuals that were not amplified for nuclear genes to assign lineage identity.Sepioteuthis sepioideaand S. australis sequences from GenBank were used as Table 1 Collection localities and sample sizes
Locality Country n Time Locality code
1 Dumaguete, Negros Oriental Philippines 27 July 2011 DUM
2 Ticao, Luzon Philippines 74 July 2011 TIC
3 Banda Aceh, Sumatra Indonesia 6 July 2011, May 2012 SUM
ACEH
4 Raja Ampat, West Papua Indonesia 36 July 2011, June 2012 RAJ
5 Bali Indonesia 40 September 2011 BAL
6 Pambam, Gulf of Mannar India 5 March 2012 GM
7 Mandapam, Palk Bay India 2 March 2012 PB
8 Mangalore India 2 MNG
9 Phu Quoc Island Vietnam 17 April 2012 VN001-017
10 Nha Trang Vietnam 53 April 2012 VN067-150
11 Pulau Seribu, Java Indonesia 22 June 2012 PSE
12 Donggala, Sulawesi Indonesia 41 August 2012 DON
13 Manado, Sulawesi Indonesia 44 August 2012 MAN
14 Muncar, Java Indonesia 4 August 2012 MUN
outgroups (Table2). Each concatenated dataset was partitioned into individual genes. RAxML was run for single and combined datasets using the GTR-GAMMA model for both bootstrapping and maximum likelihood search. Node support was estimated using 1,000 rapid bootstrap replicates and nodes with greater than 50% support were used to construct the final consensus tree. Bayesian phylogenetic analyses were implemented in MrBayes 3.1.2. Default values for prior parameters were used in the analysis. Each dataset was run for 5,000,000–7,500,000 generations after which the average standard deviation of split frequencies fell below the stop value of 0.01. Datasets were run with a mixed model and gamma rate distribution (?G). The final consensus tree was
constructed using the fifty-percent majority rule and resulting posterior probability values for each node were used as estimates of clade support.
The previous methods estimated gene trees, indi-cating the history of that particular gene, and not necessarily the lineages or species. Incomplete lineage sorting can result in discordance between inferred gene trees and between the gene trees and species trees, resulting in incorrect inferences about phyloge-netic relationships (Maddison,1997; Nichols,2001). All four genes were concatenated into a partitioned dataset and analyzed using a locus, multi-species coalescent framework employed in *BEAST (Heled & Drummond, 2010) to estimate the most likely species tree. Each of the 87 individuals was assigned to one of three distinct lineages (lineage A, B, or C) identified in the concatenated datasets. Nucle-otide substitution model parameters were estimated for each individual gene dataset using jModelTest (Guindon & Gascuel, 2003; Darriba et al., 2012).
Models with the best AIC score that could be implemented in *BEAST were chosen. Each MCMC analysis was conducted for 100,000,000 generations (sampling every 1,000 steps with a 15% burn-in determined from trace plots and estimated samples sizes). A Yule process tree prior and an uncorrelated lognormal relaxed clock branch length prior were used for all analyses. All other priors were left at default values. Convergence of the posterior and parameters was assessed by examining likelihood plots in Tracer v1.4 (Rambaut & Drummond,2007). Final best tree was determined from 255,000 combined post-in samples from the three runs.
Validation of lineages
To explore the validity of lineages inferred from the previous gene and species tree techniques, we used a Bayesian species delimitation method implemented through the Bayesian Phylogenetics and Phylogeog-raphy (BP&P version 2.2) program (Yang & Rannala,
2010). This coalescent-based method is designed to estimate the posterior distribution for different species delimitation models using a reversible-jump Markov chain Monte Carlos (rjMCMC) algorithm on a user-provided guide tree with priors for ancestral popula-tion size (h) and root age (s0). At each bifurcation of the guide tree, the rjMCMC algorithm estimates the marginal posterior probability of speciation (from here on, termed ‘‘speciation probability’’). We invoked the 50% majority rule for inferring the likelihood of a speciation or splitting event.
We used BP&P to estimate the posterior probabilities of splitting events to validate the lineages inferred from Table 2 GenBank accession numbers and outgroups used in this study to infer phylogenetic relationships within theS.cf.lessoniana species complex
Species 16s CO1 Rhodopsin ODH References
Sepioteuthis australis AF110087 AF075401 AY616917 AY616901 Anderson (2000), Strugnell et al. (2005)
Loligo forbesi AF110075 AF075402 AY545184 AY545136 Anderson (2000), Strugnell et al. (2004)
Sthenoteuthis oualaniensis
AB270958 AB270943 AY545185 AY545137 Wakabayashi et al. (2012), Strugnell et al. (2004)
Sepioteuthis sepioidea AF110090 AF075392 Anderson (2000)
Moroteuthis robusta EU735241 AB264116 Lindgren (2010), Wakabayashi et al. (2012)
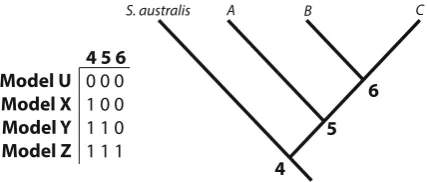
our phylogenetic analyses using all combined loci. The rjMCMC analyses were each run for 300,000 generations (sampling interval of five) with a burn-in period of 24,000, producing consistent results for all separate analyses. For each analysis, we used algo-rithm 0 with fine-tuning to achieve dimension matching between delimitation models with different numbers of parameters. Each species delimitation model (Fig.2) was given equal prior probability (0.25). We modified the species tree from *BEAST by removing two of the outgroups (Sthenoteuthis oualaniensis and Loligo forbesi) to use as the guide tree for BP&P. We removed these two distant outgroups as we were not delimiting species from different genera. Within this tree, we treatS. australis as a type of ‘‘control,’’ as it is a morphologically and phylogenetically valid species (Anderson,2000; Jereb & Roper, 2006), thus it should be delimited from the S. cf.lessoniana complex.
Assignment of prior distributions can significantly affect the posterior probabilities calculated for each model (Yang & Rannala,2010). Thus, we tested the influence of different divergence scenarios by consid-ering different combinations of the priors for ancestral population size (h) and root age (s0). The combina-tions of priors assumed three scenarios: (1) large ancestral population size h*G(1,10) and deep
divergencess0*G(1,10), (2) small ancestral
popu-lation size h *G(2,2000) and shallow divergences
s0*G(2,2000), and (3) large ancestral population
sizes h*G(1,10) and shallow divergences s0*
G(2,2000). This third combination represents the most conservation combination of priors that should favor models with fewer species (Yang & Rannala,2010).
Phylogeographic patterns within lineages
Genetic diversity and differentiation were investigated between populations within lineages B and C to assess likely factors influencing genetic structure. Lineage A was excluded from phylogeographic analyses as this clade only contained 20–24 individuals and the sample sizes were too small to conduct tests with any reliability. For lineages B and C, populations with n\10 were omitted from analyses. Five localities were also omitted from analysis due to small sample sizes (all three sites from India and Banda Aceh, Sumatra and Muncar, Java in Indonesia). Diversity indices (haplotype diversity, nucleotide diversity, and associated standard deviations) were calculated each locality for each lineage using Arlequin 3.5.1.2 (Table 4). Patterns of phylogeographic structure among sampled localities were assessed. Percent variation within and among localities in each lineage, f-statistics (/ST), and locality pairwise comparisons (/ST) were calculated using an analysis of molecular variance (AMOVA).
Results
Sequence variation
Screening of mitochondrial DNA regions CO1 (675 bp) and 16s (549 bp) in 379 and 371 individuals, respectively, yielded 157 and 89 unique haplotypes. From the subset of 267 and 282 individuals screened for nuclear DNA regions rhodopsin (542 bp) and ODH (866 bp) 27 and 158 unique haplotypes were found, respectively. The gene regions analyzed were very different in terms of variability. Mitochondrial CO1 and 16s and nuclear ODH had a higher propor-tion of variable sites than nuclear rhodopsin.
Phylogenetic relationships
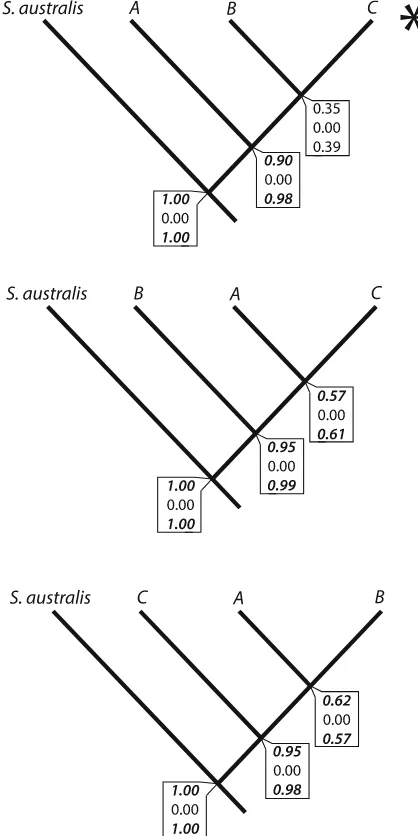
Phylogenies recovered from all analyzed datasets resolved the same set of monophyletic lineages in both maximum likelihood and Bayesian inference method-ologies. Three well-supported lineages (average sup-port values—lineage A [BPP 0.997, MLB 96.33%], lineage B [BPP 0.983, MLB 93.67%], and lineage C [BPP 0.813, MLB 69.00%] where BPP is Bayesian posterior probability and MLB is maximum likelihood Fig. 2 Species delimitation models on a fully resolved guide
tree generated from *BEAST. Each model represents a tree with different nodes bifurcated (denoted by1) or collapsed (denoted by0). For example,model Xretains the bifurcation atnode 4, but
hasnodes 5and6collapsed, indicating that lineagesA,B,and
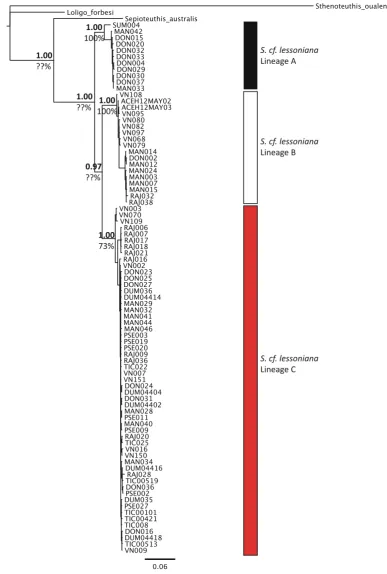
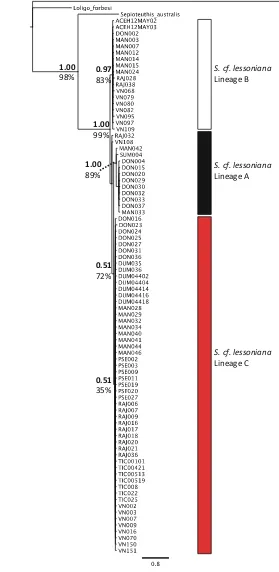
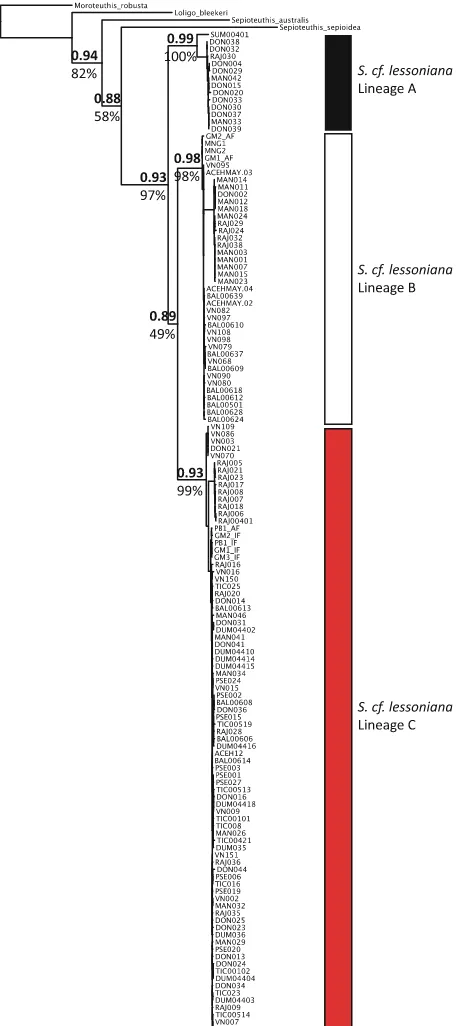
bootstrap support) were resolved in each dataset, comprising the same individuals in each analysis. Topologies resolved between mitochondrial and nuclear datasets were not always concordant. In both maximum likelihood and Bayesian consensus trees for the all gene dataset and the mitochondrial gene dataset, lineages B and C were sister to each other (Figs. 3, 5). However, in the nuclear genes dataset, lineages A and C were sister to each other (Fig.4). However, for all datasets, the support values for that particular node are low (BPP 0.51–0.89, MLB 49–72%), indicating that the relationship between those lineages is not well-resolved and further statis-tical assessment is needed. The maximum clade credibility species tree topology (determined from 255,000 post burn-in tree topologies) is concordant with the hypothesis of three distinct lineages withinS. cf. lessoniana (Fig.6). Similar to the maximum likelihood and Bayesian analyses of the concatenated datasets, each lineage had very high support values and large divergences between lineages.
The results from the Bayesian species delimitation for this species complex show variable support for three independent lineages (Fig.7). When assuming large ancestral population sizes and deep divergences or large ancestral population sizes and shallow diver-gences, there was strong support for the bifurcation between lineages A and B (posterior probability [0.50) as well as between lineages A and C (posterior
probability[0.50) (Fig.7). Our outgroup,S. australis, consistently demonstrated independence with strong support (posterior probability=1.00). However, under a divergence scenario with small ancestral population sizes and shallow divergence, we did not have any support for bifurcation of any nodes on the guide tree, including between the S. cf. lessoniana species complex andS. australis(posterior probabil-ity=0.00, Fig.7). Previous simulations with varia-tions in thehprior indicate that BP&P is particularly sensitive to small ancestral population sizes, and thus this outcome is likely a result of this (Leache´ & Fujita,
2010; Yang & Rannala, 2010). The topology of the guide tree also influenced the number of evolutionary lineages inferred, for example, our second and third guide trees support three independent lineages (Fig.7). Placement of divergent lineages as sister taxa can inflate what BP&P regards as a speciation event (Leache´ & Fujita, 2010). This emphasizes the need for a reliable guide tree for accurate species
delimitation estimates as random rearrangements of the tips impacts how many species are delimited. BP&P supports two to three evolutionary lineages depending on the guide tree topology.
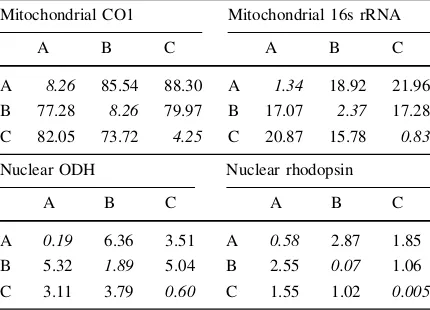
While all three lineages were consistently recov-ered from all individual and concatenated genetic datasets, average divergence between each lineage varied depending on the gene region in question. In all datasets, distance between lineages was always much higher than intra-lineage values (Table 3). However, K2P distances between mitochondrial lineages were much greater than the distance separating the same lineages in the nuclear datasets (Table3). This is reflected in the deeper phylogenetic relationships that were resolved in the mitochondrial trees (Fig.5). Furthermore, genetic substructuring within the mito-chondrial lineages was present and absent in the nuclear lineages (Table3). Comparing lineages, hap-lotype diversity was comparatively similar in lineages B and C in all genes analyzed. Lineage A had comparatively much lower haplotype diversity than lineages B and C in all genes, except CO1 (Table4). In the analyses with representative individuals, lineage C seemed to be the most commonly found among all sampled sites (Fig.8). When examining the frequency of each lineage in all sampled individuals (including individuals with identical haplotypes), the representa-tions of lineages B and C were much more common than lineage A (Fig. 8; Table5).
Distribution and phylogeography
S. cf. lessoniana Lineage A
S. cf. lessoniana Lineage C S. cf. lessoniana Lineage B 1.00
100%
1.00 73% 1.00 100%
0.97 ??% 1.00 ??% 1.00
??%
S. cf. lessoniana Lineage A
S. cf. lessoniana Lineage C S. cf. lessoniana Lineage B 0.97
83% 1.00
98%
1.00 99%
1.00 89%
0.51 72%
0.51 35% Fig. 4 Rhodopsin
(Rhd)?octopine
dehydrogenase (ODH) gene tree.Values above the node are Bayesian posterior probabilities andvalues
beloware bootstrap support
Fig. 5 Mitochondrial CO1 (CO1)?16s rRNA (16s) gene tree.Values above the nodeare Bayesian posterior probabilities andvalues
beloware bootstrap support
true indicator of occurrence as sample sizes between locations are extremely varied (Table 5). Haplotype diversity within each lineage was very high for the mitochondrial genes and for ODH (Table5). There was not a clear pattern of difference between each lineage in terms of haplotype diversity as they were all similarly high. Rhodopsin had much lower levels of haplotype diversity, particularly for lineages A and C (Table5). This corresponded to very low levels of variation between individuals seen in this gene region. AMOVA results suggest that there is significant genetic substructuring between the three localities (Bali, Manado and Nha Trang) sampled in lineage B. Overall /ST was very high for all gene regions for lineage B with the majority of variation explained by among population differentiation. Comparing the population pairwise/STvalues from all gene regions, samples from Manado were significantly strongly differentiated from Bali and Nha Trang (Table6). There was low differentiation between Bali and Nha Trang, but this value was not significant. Haplotype diversity of each population from the mitochondrial data indicated that diversity is comparably high in Manado and Bali, but slightly lower in Nha Trang (Table5). Nucleotide diversity is low for all localities. Conversely, AMOVA results for lineage C suggest limited genetic substructuring between eight geo-graphic localities sampled (Donggala, Dumaguete, Manado, Nha Trang, Phu Quoc, Pulau Seribu, Raja
Ampat, and Ticao). Overall/STwas fairly low for all gene regions with the majority of variation explained by within locality differentiation (Table 6). Among population variation is driven by high levels of genetic 0 . 0 3
Fig. 6 Maximum clade credibility species tree determined from 255,000 post burn-in topologies from *BEAST.Values at
the nodesare posterior probabilities
Fig. 7 Bayesian species delimitation results for the
Sepioteu-thiscf.lessonianaspecies complex assuming four species guide
trees with the species tree from *BEAST denoted with a
asterisk. Speciation probabilities from each combination of
priors forhands0are provided for each node with probabilities greater than 0.50 highlighted in boldand italics. Toph and
s0*G(1,10); middle h and s0*G(2,2000); bottom h*G(1,10); ands0*G(2,2000). Different arrangements of
differentiation in mitochondrial gene regions between both Nha Trang and Raja Ampat and all localities. This pattern was not observed in the ODH dataset, rather only Raja Ampat was significantly differenti-ated from all localities save Nha Trang and Phu Quoc. All other localities at all gene regions had very low levels of differentiation in relationship to each other (Table5). All populations were characterized by high haplotype diversity and low nucleotide diversity in both mitochondrial genes and the ODH gene (Table5). Rhodopsin had very low levels of haplotype and nucleotide diversity (Table5) and was found to contain numerous individuals with identical sequences.
Discussion
In lieu of obvious and observable morphological differences, use of molecular genetic tools has proved to be a powerful way to detect cryptic species via the phylogenetic species concept (rev. Bickford et al.,
2007). Using this technique, many marine species that were once considered cosmopolitan are actually com-prised of many genetically distinct species (Sole´-Cava et al.,1991; Knowlton et al.,1992; Colborn et al.,2001; Westheide & Schmidt, 2003; Anderson et al., 2011). The data collected in this study allowed for a robust and extensive phylogenetic assessment of theS.cf. lesson-iana complex. Analyses of both mitochondrial and nuclear genes consistently recovered three well-sup-ported reciprocally monophyletic lineages from across the Coral Triangle (Figs.3,4,5,6). Deep divergences among lineages were found in mitochondrial (73–82% for CO1, 16–21% for 16s based on Kimura 2-parameter (K2P) distances) genes. Shallower divergences were observed in nuclear genes (4–5% for ODH and 1–3% for Rhd). The divergences found between lineages exceed values commonly observed for congeneric species (Avise, 2000) and similar very deep diver-gences in mitochondrial gene regions have been reported in cephalopods (Strugnell & Lindgren,2007) including theSepia pharoanis(Anderson et al.,2011) and Pareledone turqueti(Allcock et al., 2011) com-plexes. Furthermore, greater inter-lineage versus intra-lineage K2P distances along with reciprocal monophyly of each lineage provides extremely strong evidence that each of these lineages represents independent evolu-tionary trajectories typical of species and higher taxa that have evolved over long periods of time (Donoghue,
1985). All four gene trees, mitochondrial, and nuclear Table 3 Pairwise differences within and between lineages of
S.cf.lessonianacomplex based on Kimura-2-parameter values
Mitochondrial CO1 Mitochondrial 16s rRNA
A B C A B C
A 8.26 85.54 88.30 A 1.34 18.92 21.96
B 77.28 8.26 79.97 B 17.07 2.37 17.28
C 82.05 73.72 4.25 C 20.87 15.78 0.83
Nuclear ODH Nuclear rhodopsin
A B C A B C
A 0.19 6.36 3.51 A 0.58 2.87 1.85
B 5.32 1.89 5.04 B 2.55 0.07 1.06
C 3.11 3.79 0.60 C 1.55 1.02 0.005
Average within-lineage pairwise difference on the diagonal (X), average number of pairwise between lineages above diagonal (Y) and average corrected between lineage pairwise difference below diagonal (Y-(Y?X)/2). All data values are significant (P\0.01)
Table 4 Haplotype diversity within resolved lineages ofS.cf.lessonianacomplex
Mitochondrial CO1 Mitochondrial 16s rRNA
A B C A B C
Hap. Div 0.947±0.034 0.847±0.032 0.935±0.011 Hap. Div 0.884±0.36 0.893±0.014 0.870±0.016
Sample size 20 115 244 Sample size 24 118 229
Nuclear ODH Nuclear rhodopsin
A B C A B C
Hap. Div 0.763±0.130 0.994±0.004 0.974±0.005 Hap. Div 0.442±0.133 0.763±0.038 0.392±0.045
datasets produced concordant topologies indicating the absence of hybridization or introgression and the presence of reproductive isolation (Mayr,1942; Dobz-hansky,1970) despite co-occurrence at multiple sites. Inferences from species tree estimations and species delimitation methods support at least two to three evolutionary independent lineages (Figs.6,7) under a conservative approach. Fulfillment of multiple species concept criteria lends very strong support for species status to these cryptic lineages ofS.cf.lessoniana.
Of all Loliginidae,S.cf.lessonianahas the largest distribution. Within this genus,S. sepioideais restricted to the Caribbean andS. australisto southern Australia and New Zealand (Jereb & Roper,2010). Past biogeo-graphic hypotheses forSepioteuthisindicate the migra-tion of a Tethyan relic following the break-up of Pangaea from the Atlantic into the Pacific Ocean (Anderson, 2000). For S. cf. lessoniana, Anderson (2000) hypothesized that it diverged from its Caribbean sister taxon and spread through the Pacific through the Indian Ocean and eventually to the Red Sea and Mediterranean, subsequently becoming extinct in the East Pacific (2000). With a nearly cosmopolitan distribution, one would assume that S. cf. lessoniana must have much greater dispersal potential than its
sister taxa. However, characteristics of paralarval and adult life history indicate thatS.cf.lessonianais likely the least dispersive of all Loliginidae. Hatchlings ofS. cf. lessoniana are among the largest (4–10 mm) (Segawa, 1987; Jivaluk et al., 2005) in the family. These large hatchlings possess well-developed nervous systems (Shigeno et al.,2001) and are strong swimmers (Kier, 1996; Thompson & Kier, 2001), thus highly unlikely to behave as a ‘‘passive’’ disperser. In fact, even among other loliginid species with much smaller sizes at hatching (e.g., Loligo opalescens 3–4 mm; Fields, 1965) there is strong evidence for advanced paralarval navigation in order to entrain themselves in favorable oceanographic areas (Okutani & McGowan,
1969; Zeidberg & Hamner,2002). Specifically, para-larvalS.cf.lessonianaorient over dark areas indicating active navigation to reef habitat (Lee et al.,1994) and demonstrate active hunting and shoaling behavior shortly after hatching (Choe,1966; Sugimoto & Ikeda,
2012).
shelter on the reef during the day and feed on it in the evenings. While they can make large vertical migra-tions (*100 m, Jereb & Roper, 2006), they are
commonly observed in extremely shallow waters
(1–3 m) in multiple areas of their range (pers. obs.). Furthermore, egg masses are commonly found depos-ited in shallow areas (majority 1–10 m) on reefs, debris, and mooring lines (Wada & Kobayashi,1995, Table 5 Diversity indices (haplotype diversity (hap. div.) and nucleotide diversity (nuc. div.) for each locality and lineage using four gene regions
Locality n Marker Lineage B Lineage C
n.p. Hap. Div Nuc. Div n.p. Hap. Div Nuc. Div
1 Dumaguete, Negros Oriental
Philippines
27 mtCO1 – 27 0.93±0.04 0.003±0.002
mt16s – 30 0.45±0.10 0.001±0.001
nucODH 2 * * 29 0.74±0.07 0.001±0.001
nucRhd – 20 0.00±0.00 0.000±0.000
2 Ticao, Luzon
Philippines
74 mtCO1 4 * * 71 0.89±0.03 0.002±0.002
mt16s 3 * * 52 0.58±0.07 0.001±0.001
nucODH 4 * * 59 0.74±0.03 0.0003±0.0004
nucRhd 3 * * 53 0.00±0.00 0.000±0.000
4 Raja Ampat, West Papua
Indonesia
36 mtCO1 9 * * 26 0.95±0.03 0.014±0.007
mt16s 9 * * 27 0.68±0.06 0.006±0.004
nucODH 7 * * 25 0.82±0.07 0.001±0.001
nucRhd 6 * * 26 0.08±0.07 0.0002±0.0003
5 Bali
Indonesia
40 mtCO1 31 0.62±0.10 0.001±0.001 9 * *
mt16s 31 0.53±0.10 0.001±0.001 9 * *
nucODH 1 * * –
nucRhd 1 * * –
9 Phu Quoc Island
Vietnam
17 mtCO1 – 17 0.73±0.11 0.004±0.003
mt16s – 17 0.57±0.13 0.002±0.001
nucODH – 17 0.85±0.07 0.001±0.001
nucRhd 15 0.00±0.00 0.003±0.002
10 Nha Trang
Vietnam
53 mtCO1 41 0.59±0.09 0.006±0.004 14 0.84±0.07 0.013±0.007
mt16s 40 0.23±0.09 0.0005±0.0006 14 0.60±0.08 0.002±0.002
nucODH 36 0.96±0.02 0.001±0.001 12 0.85±0.07 0.001±0.001
nucRhd 35 0.17±0.08 0.000±0.000 13 0.15±0.13 0.000±0.000
11 Pulau Seribu, Java
Indonesia
22 mtCO1 – 26 0.86±0.07 0.003±0.002
mt16s – 25 0.47±0.11 0.001±0.001
nucODH – 16 0.78±0.07 0.001±0.001
nucRhd 16 0.13±0.11 0.000±0.000
12 Donggala, Sulawesi
Indonesia
41 mtCO1 1 * * 25 0.90±0.05 0.006±0.003
mt16s 1 * * 25 0.53±0.11 0.002±0.001
nucODH 1 * * 17 0.76±0.08 0.0001±0.0002
nucRhd 1 * * 20 0.00±0.00 0.000±0.000
13 Manado, Sulawesi
Indonesia
44 mtCO1 23 0.73±0.07 0.003±0.003 19 0.82±0.07 0.002±0.001
mt16s 25 0.48±0.09 0.001±0.001 19 0.37±0.14 0.001±0.001
nucODH 15 0.48±0.15 0.000±0.000 14 0.57±0.13 0.0001±0.0002
nucRhd 17 0.00±0.00 0.000±0.000 16 0.00±0.00 0.000±0.000
pers. obs.). Availability of suitable habitats may be a limiting factor for long-distance migration, as the short lifespan of the squid needs to be weighed against finding areas for feeding and spawning.
In the Coral Triangle, the Indonesian Throughflow transports water at 209106 m3/s from the Pacific to
the Indian Ocean (Godfrey, 1996; Gordon & Fine,
1996), while surface currents can reach speeds of 1 m/s (Wyrtki,1961), posing strong limits to migration for adult S. cf. lessoniana. While S. cf. lessoniana are strong swimmers, energetic limits restrict movement and adult squid actively seek out specific current regimes to conserve energy (O’Dor et al.,2002). The physical barriers of the Coral Triangle have been well-demonstrated to pose limits to gene flow and dispersal in many diverse marine organisms (e.g., DeBoer et al.,
2008; Barber et al., 2011; Fauvelot & Borsa, 2011). While in the present study, all three lineages are co-distributed over the Coral Triangle, they demonstrate markedly different patterns of population differentia-tion. Particularly, AMOVA results do not indicate any barriers to gene flow in lineage C, while lineage B showed higher levels of genetic differentiation among localities (Table5). Unfortunately, sample sizes were large enough for analyses in only three out of the nine localities for lineage B. However, in the three localities (Manado, Bali, and Nha Trang) examined, there are strong genetic breaks suggesting that gene flow and dispersal may be limited between geographic areas. Fast currents, deep water, landmasses, and long distances in particular separate these three localities. Overall, the biological characteristics of this squid— coastal spawning and feeding habitat, large hatchling size, and restricted adult movement and behavior—
provide decreased opportunity and ability for wide-spread dispersal. In light of the pronounced genetic divergence and evidence for at least two to three delimited species in the present study and the life history of S. cf. lessoniana, the evolution of cryptic species is expected given the ample opportunities for genetically isolated populations.
While the biological characteristics ofS.cf. lesson-ianalend itself to scenarios of high rates of divergence and speciation, the co-occurrence of these cryptic species raises more complex questions regarding the evolution and ecology of this species complex. Previ-ous studies detected genetically distinct cryptic species of S.cf.lessonianawith varying degrees of morpho-logical variation co-occurring in two relatively small geographic locations (Izuka et al.,1994; Triantafillos & Adams,2005). Triantafillos & Adams theorized that the co-occurrence in Shark Bay, Australia was a result of an occasional overlap between an Indian Ocean and Pacific Ocean species that otherwise have non-over-lapping distributions (2005). However, this present study indicates that co-occurrence seems to be quite widespread (Fig. 6) from Indian Ocean to western Pacific locations. While it could be theorized that the co-occurrence in the Coral Triangle is overlap between Indian and Pacific Ocean sister taxa, more sampling at the edges of the range (e.g., Hawaii, Oceania nations, and eastern Africa) is needed to confirm.
The detection of co-occurring cryptic species raises interesting questions concerning the ecology and evolution of these species. However, more pressingly, it also raises serious questions about the validity of biological and ecological characteristics determined for S. cf. lessoniana. For example, the flexible Table 6 Genetic differentiation (AMOVA) results for populations of each lineage that had sequence data forn[10
mtco1 mt16s nucODH
n n.p. % ST P n n.p. % ST P n n.p. % ST P
Lineage B 95 3 105 4 58 3
Among populations 77.51 0.775 0.000 86.14 0.861 0.000 51.33 0.513 0.000
Within populations 22.49 13.86 48.67
Lineage C 225 8 209 8 189 8
Among populations 23.24 0.232 0.000 22.70 0.227 0.000 5.75 0
Within populations 76.76 77.30 94.25
reproductive strategies demonstrated by Pecl (2001) and Jackson & Moltschaniwsky (2002) which identi-fied marked spatial and temporal heterogeneity for growth and life history characteristics in S. cf. lessoniana, may actually represent different life histories between the cryptic species. Furthermore, these squids have been observed to spawn at different seasons, on different substrates, and with different egg morphologies throughout their range (Rao, 1954; Segawa,1987; Ueta & Jo,1989; Chotiyaputta,1993; Segawa et al.,1993a,b; Izuka et al.,1994) raising the possibility that these variations may actually be fixed characteristics for each species.
The three lineages were present in markedly different abundances at all sites (Fig.6). Lineage C was appears to be most abundant, while Lineages B and A were less abundant, but co-occurred with lineage C and occasion-ally each other (Fig.6). Analyses were not conducted for lineage A due to small sample size. However, the low abundance of lineage A suggests that it either occurs in habitats not usually fished or it has a much more restricted distribution. While these differences may be due to differences in sampling effort or gear used, they may be rooted in different ecological, behavioral, or biological characteristics of the three cryptic species. Particularly, sympatric co-occurrence of closely related species in marine environments has been attributed to factors such as climatic gradients, asynchrony of maturation, habitat specificity, and ecological niche partitioning [e.g.,Aurelia aurita(Schroth et al.,2002), marine microbes (rev. Fenchel, 2005), Micromonas microeukaryotic alga (Slapeta et al.,2006),Amphipholis squamatabrittle stars complex (Sponer & Roy,2002)]. S.cf.lessoniana’s large range encompasses a plethora of diverse physical and biological factors resulting in many different habitats, ecological communities, and ocean-ographic regimes that could facilitate co-occurrence. However, these questions require much more in-depth investigations.
Conclusions
These results expand on previous studies of S. cf. lessoniana in Shark Bay, Australia (Triantafillos & Adams, 2005) and Ishigaki, Japan (Segawa et al.,
1993b; Izuka et al., 1994), which suggested the presence of cryptic co-occurring lineages. These studies in Australia and Japan only focused on small spatial areas and found evidence for sympatric cryptic species with limited morphological differences. Upon expanding the range of study to the Indo-Pacific and Indian Oceans, we found similar results of cryptic species occurring sympatrically (Fig.6). Like these previous studies, recovered cryptic lineages from this study were strongly differentiated and separated by large genetic distances (Tables3, 5). However, because these studies employed allozymes, it is impossible to determine whether these are the same cryptic lineages detected in this study or whether there may more than three cryptic species ofS.cf. lesson-iana. Our use of CO1 DNA sequence data, the universal barcode marker (Hebert et al.,2003; Allcock et al.,2011) will lay the groundwork for comparison of squid populations from other regions, allowing the determination of how many cryptic species exist in this taxon. However, this study provides a phylogenetic basis for species delimitation, but for a comprehensive taxonomic reassessment, these results need be com-bined with detailed morphological characterizations.
S.cf.lessonianais of economic interest throughout its range, supporting commercial, and artisanal fish-eries (Chikuni,1983; Soselisa et al.,1986; Sudjoko,
1987; Chotiyaputta, 1993; Tokai & Ueta, 1999; Nateewathana et al.,2000; FAO,2009). Maintenance of sustainable fisheries is dependent on accurate life history and growth information, particularly as suc-cessful recruitment and population abundance for squids are dependent on specific environmental con-ditions (Boyle & Boletzky,1996; Forsythe et al.,2001; Agnew et al., 2005; Pecl & Jackson, 2008). Thus, flexible growth and reproductive strategies may rep-resent a viable natural mechanism to cope with changing conditions, avoiding major crashes in pop-ulation biomass. However, in light of the genetic evidence of widespread co-occurring cryptic species presented in this study, it is absolutely crucial that efforts are undertaken to accurately determine specific life histories for each species.
Table 7 GenBank accession numbers for sequences generated in this study
ID No. Isolate CO1 16s ODH Rhd
ACEH12MAY05 C KF052359 KF052136
ACEH12MAY02 B KF052360 KF052137 KF052498 KF052275
ACEH12MAY03 B KF052361 KF052138 KF052499 KF052276
ACEH12MAY04 B KF052362 KF052139
BAL00501 B KF052363 KF052140
BAL00604 C KF052364 KF052141
BAL00606 C KF052365 KF052142
BAL00608 C KF052366 KF052143
BAL00609 B KF052367 KF052144
BAL00610 B KF052368 KF052145
BAL00612 B KF052369 KF052146
BAL00613 C KF052370 KF052147
BAL00614 C KF052371 KF052148
BAL00618 B KF052372 KF052149
BAL00624 B KF052373 KF052150
BAL00628 B KF052374 KF052151
BAL00637 B KF052375 KF052152
BAL00639 B KF052376 KF052153
DON002 B KF052377 KF052154 KF052500 KF052277
DON004 A KF052378 KF052155 KF052501 KF052278
DON013 C KF052379 KF052156
DON014 C KF052380 KF052157
DON015 A KF052381 KF052158 KF052502 KF052279
DON016 C KF052382 KF052159 KF052503 KF052280
DON020 A KF052383 KF052160 KF052504 KF052281
DON021 C KF052384 KF052161
DON023 C KF052385 KF052162 KF052505 KF052282
DON024 C KF052386 KF052163 KF052506 KF052283
DON025 C KF052387 KF052164 KF052507 KF052284
DON027 C KF052388 KF052165 KF052508 KF052285
DON029 A KF052389 KF052166 KF052509 KF052286
DON030 A KF052390 KF052167 KF052510 KF052287
DON031 C KF052391 KF052168 KF052511 KF052288
DON032 A KF052392 KF052169 KF052512 KF052289
DON033 A KF052393 KF052170 KF052513 KF052290
DON034 C KF052394 KF052171
DON036 C KF052395 KF052172 KF052514 KF052291
DON037 A KF052396 KF052173 KF052515 KF052292
DON038 A KF052397 KF052174
DON039 A KF052398 KF052175
DON041 C KF052399 KF052176
DON044 C KF052400 KF052177
DUM035 C KF052401 KF052178 KF052516 KF052293
Table 7 continued
ID No. Isolate CO1 16s ODH Rhd
DUM04402 C KF052403 KF052180 KF052518 KF052295
DUM04403 C KF052404 KF052181
DUM04404 C KF052405 KF052182 KF052519 KF052296
DUM04410 C KF052406 KF052183
DUM04414 C KF052407 KF052184 KF052520 KF052297
DUM04415 C KF052408 KF052185
DUM04416 C KF052409 KF052186 KF052521 KF052298
DUM04418 C KF052410 KF052187 KF052522 KF052299
GM1_AF B KF019365 KF019356
GM1_IF C KF019366 KF019357
GM2_AF B KF019367 KF019358
GM2_IF C KF019368 KF019359
GM3_IF C KF019369 KF019360
MAN001 B KF052411 KF052188
MAN003 B KF052412 KF052189 KF052523 KF052300
MAN007 B KF052413 KF052190 KF052524 KF052301
MAN011 B KF052414 KF052191
MAN012 B KF052415 KF052192 KF052525 KF052302
MAN014 B KF052416 KF052193 KF052526 KF052303
MAN015 B KF052417 KF052194 KF052527 KF052304
MAN018 B KF052418 KF052195
MAN023 B KF052419 KF052196
MAN024 B KF052420 KF052197 KF052528 KF052305
MAN026 C KF052421 KF052198
MAN027 C KF052422 KF052199
MAN028 C KF052423 KF052200 KF052529 KF052306
MAN029 C KF052424 KF052201 KF052530 KF052307
MAN032 C KF052425 KF052202 KF052531 KF052308
MAN033 A KF052426 KF052203 KF052532 KF052309
MAN034 C KF052427 KF052204 KF052533 KF052310
MAN040 C KF052428 KF052205 KF052534 KF052311
MAN041 C KF052429 KF052206 KF052535 KF052312
MAN042 A KF052430 KF052207 KF052536 KF052313
MAN044 C KF052431 KF052208 KF052537 KF052314
MAN046 C KF052432 KF052209 KF052538 KF052315
MNG1 B KF019370 KF019361
MNG2 B KF019371 KF019362
PB1_AF C KF019372 KF019363
PB1_IF C KF019373 KF019364
PSE001 C KF052433 KF052210
PSE002 C KF052434 KF052211 KF052539 KF052316
PSE003 C KF052435 KF052212 KF052540 KF052317
PSE005 C KF052436 KF052213
Table 7 continued
ID No. Isolate CO1 16s ODH Rhd
PSE009 C KF052438 KF052215 KF052541 KF052318
PSE011 C KF052439 KF052216 KF052542 KF052319
PSE015 C KF052440 KF052217
PSE019 C KF052441 KF052218 KF052543 KF052320
PSE020 C KF052442 KF052219 KF052544 KF052321
PSE024 C KF052443 KF052220
PSE027 C KF052444 KF052221 KF052545 KF052322
RAJ00401 C KF052445 KF052222
RAJ005 C KF052446 KF052223
RAJ006 C KF052447 KF052224 KF052546 KF052323
RAJ007 C KF052448 KF052225 KF052547 KF052324
RAJ008 C KF052449 KF052226
RAJ009 C KF052450 KF052227 KF052548 KF052325
RAJ016 C KF052451 KF052228 KF052549 KF052326
RAJ017 C KF052452 KF052229 KF052550 KF052327
RAJ018 C KF052453 KF052230 KF052551 KF052328
RAJ020 C KF052454 KF052231 KF052552 KF052329
RAJ021 C KF052455 KF052232 KF052553 KF052330
RAJ023 C KF052456 KF052233
RAJ024 B KF052457 KF052234
RAJ028 C KF052458 KF052235 KF052554 KF052331
RAJ029 B KF052459 KF052236
RAJ030 A KF052460 KF052237
RAJ032 B KF052461 KF052238 KF052555 KF052332
RAJ035 C KF052462 KF052239
RAJ036 C KF052463 KF052240 KF052556 KF052333
RAJ038 B KF052464 KF052241 KF052557 KF052334
SUM004 A KF052465 KF052242 KF052558 KF052335
TIC00101 C KF052466 KF052243 KF052559 KF052336
TIC00102 C KF052467 KF052244
TIC00103 C KF052468 KF052245
TIC00421 C KF052469 KF052246 KF052560 KF052337
TIC00513 C KF052470 KF052247 KF052561 KF052338
TIC00514 C KF052471 KF052248
TIC00519 C KF052472 KF052249 KF052562 KF052339
TIC008 C KF052473 KF052250 KF052563 KF052340
TIC016 C KF052474 KF052251
TIC022 C KF052475 KF052252 KF052564 KF052341
TIC023 C KF052476 KF052253
TIC025 C KF052477 KF052254 KF052565 KF052342
VN002 C KF052478 KF052255 KF052566 KF052343
VN003 C KF052479 KF052256 KF052567 KF052344
VN007 C KF052480 KF052257 KF052568 KF052345
Acknowledgments We would like to thank M. J. Aidia, I. Zulkarnaini, A. Muhadjier, H. Nuetzel, S. Simmonds, A. Wahyu, D. Willette, M. Weber, and R. Rachmawati for assistance in sampling collection and field expeditions, K. Carpenter (ODU) for funding and facilitation of sample collection. We would also like to thank U.S. National Science Foundation Partnerships in International Research and Education (NSF-PIRE) Grants 1036516 (to P.H. Barber), the Explorer’s Club research grants, the Lemelson Foundation and the UCLA Center for Southeast Asian Studies research grants (to S.H. Cheng), and the Southern Illinois University REACH award (to A. Bergman) for funding and support.
References
Adam, W., 1939. Cephalopoda part I. Le genre Sepioteuthis Blainville, 1824. Siboga-Expeditie, Monographie LVa: 1–33.
Agnew, D. J., S. L. Hill, J. R. Beddington, L. V. Purchase & R. C. Wakeford, 2005. Sustainability and management of southwest Atlantic squid fisheries. Bulletin of Marine Science 76: 579–593.
Allcock, A. L., I. Barratt, M. Eleaume, K. Linse, M. D. Norman, P. J. Smith, D. Steinke, D. W. Stevens & J. M. Strugnell, 2011. Cryptic speciation and the circumpolarity debate: a case study on endemic Southern Ocean octopuses using the CO1 barcode of life. Deep Sea Research II 58: 242–249. Allen, G. R., 2008. Conservation hotspots and biodiversity and
endemism for Indo-Pacific coral reef fishes. Aquatic Con-servation: Marine and Freshwater Ecosystems 18: 541–556. Allen, G. R. & T. B. Werner, 2002. Coral reef fish assessment in the ‘‘Coral Triangle’’ of southeastern Asia. Environmental Biology of Fishes 65: 209–214.
Anderson, F. E., 2000. Phylogeny and historical biogeography of the loliginid squids (Mollusca: Cephalopoda) based on mitochondrial DNA sequence data. Molecular Phyloge-netics and Evolution 15: 191–214.
Anderson, F. E., R. Engelke, K. Jarrett, T. Valinassab, K. S. Mohamed, P. K. Asokan, P. U. Zacharia, P. Nootmorn, C. Chotiyaputta & M. Dunning, 2011. Phylogeny of the
Sepia pharaonisspecies complex (Cephalopoda: Sepiida)
based on analyses of mitochondrial and nuclear DNA sequence data. Journal of Molluscan Studies 77: 65–75. Anker, A., 2010. New findings of rare or little-known alpheid
shrimp genera (Crustacea. Decapoda) in Moorea, French Polynesia. Zootaxa 2403: 23–41.
Avise, J. C., 2000. Phylogeography: The History and Formation of Species. Harvard University Press, Cambridge, MA. 447.
Barber, P. H. & S. L. Boyce, 2006. Estimating diversity of Indo-Pacific coral reef stomatopods through DNA barcoding of stomatopod larvae. Proceedings of the Royal Society B 273: 2053–2061.
Barber, P. H., M. V. Erdmann & S. Palumbi, 2006. Comparative phylogeography of the three codistributed stomatopods: origins and timing of regional lineage diversification in the Coral Triangle. Evolution 60: 1825–1839.
Barber, P. H., S. H. Cheng, M. V. Erdmann, K. Ten-ggardjaja & Ambariyanto, 2011. Evolution and conser-vation of marine biodiversity in the Coral Triangle: insights from stomatopod Crustacea. In Held, C., S. Koenemann & C. D. Schubart (eds), Phylogeography and Population Genetics of Crustacea. Crustacean Issues. CRC Press, Boca Raton.
Bickford, D., D. J. Lohman, N. S. Sodhi, P. K. L. Ng, R. Meier, K. Winker, K. K. Ingram & I. Das, 2007. Cryptic species as a window on diversity and conservation. Trends in Ecology and Evolution 22: 148–155.
Table 7 continued
ID No. Isolate CO1 16s ODH Rhd
VN015 C KF052482 KF052259
VN016 C KF052483 KF052260 KF052570 KF052347
VN068 B KF052484 KF052261 KF052571 KF052348
VN070 C KF052485 KF052262 KF052572 KF052349
VN079 B KF052486 KF052263 KF052573 KF052350
VN080 B KF052487 KF052264 KF052574 KF052351
VN082 B KF052488 KF052265 KF052575 KF052352
VN086 C KF052489 KF052266
VN090 B KF052490 KF052267
VN095 B KF052491 KF052268 KF052576 KF052353
VN097 B KF052492 KF052269 KF052577 KF052354
VN098 B KF052493 KF052270
VN108 B KF052494 KF052271 KF052578 KF052355
VN109 C KF052495 KF052272 KF052579 KF052356
VN150 C KF052496 KF052273 KF052580 KF052357
Boyle, P. & S. V. Boletzky, 1996. Cephalopod populations: definitions and dynamics. Philosophical Transactions of the Royal Society B: Biological Sciences 351: 985–1002. Briggs, J. C., 1999. Coincident biogeographic patterns:
Indo-West Pacific Ocean. Evolution 53: 326–335.
Carpenter, K. E., P. H. Barber, E. D. Crandall, M. C. A. Ablan-Lagman, Ambariyanto, G. N. Mahardika, B. M. Manjaji-Matsumoto, M. A. Juinio-Menez, M. D. Santos, C. J. Starger & A. H. A. Toha, 2011. Comparative phyloge-ography of the Coral Triangle and implications for marine management. Journal of Marine Biology 2011: 1–14. Chikuni, S., 1983. Cephalopod resources in the Indo-Pacific
region. In Caddy, J. F. (ed.), Advances in Assessment of World Cephalopod Resources. FAO Fisheries Technical Paper 231: 264–305.
Choe, S., 1966. On the eggs, rearing, habits of the fry, and growth of some Cephalopoda. Bulletin of Marine Science 16: 330–348.
Chotiyaputta, C., 1993. Cephalopod resources of Thailand. In Okutauni, T., R. O’Dor & T. Kubodera (eds), Recent Advances in Fisheries Biology. Tokai University Press, Tokyo: 71–80.
Colborn, J., R. E. Crabtree, J. B. Shaklee, E. Pfeiler & B. W. Bowen, 2001. The evolutionary enigma of bonefishes
(Albulaspp.): cryptic species and ancient separations in a
globally distributed shorefish. Evolution 55: 807–820. Conservation International, 2012. Coral Triangle Initiative Map.
http://www.conservation.org/where/oceans/CTI/Pages/ map.aspx. Accessed November 3, 2012.
Crandall, E. D., M. A. Frey, P. K. Grosberg & P. H. Barber, 2008. Contrasting demographic history and phylogeo-graphical patterns in two Indo-Pacific gastropods. Molec-ular Ecology 17: 611–626.
Darriba, D., G. L. Taboada, R. Doallo & D. Posada, 2012. jModelTest 2: more models, new heuristics and parallel computing. Nature Methods 9: 772.
DeBoer, T. S., M. D. Subia, M. V. Erdmann, K. Kovitvongsa & P. H. Barber, 2008. Phylogeography and limited genetic connectivity in the endangered boring giant clam across the Coral Triangle. Conservation Biology 22: 1255–1266.
Dobzhansky, T., 1970. Genetics of the Evolutionary Process. Columbia University Press, New York.
Donoghue, M. J., 1985. A critique of the biological species concept and recommendations for a phylogenetic alterna-tive. The Bryologist 88: 172–181.
Drew, J., G. R. Allen, L. Kaufman & P. H. Barber, 2008. Endemism and regional color and genetic differences in five putatively cosmopolitan reef fishes. Conservation Biology 22: 965–975.
Excoffier, L. & H. E. L. Lischer, 2010. Arlequin suite ver 3.5: a new series of programs to perform population genetics analyses under Linux and Windows. Molecular Ecology Resources 10: 564–567.
FAO, 2009. FAO Yearbook. Fishery and Aquaculture Statistics. Food and Agriculture Organization of the United Nations, Rome.
Fauvelot, C. & P. Borsa, 2011. Patterns of genetic isolation in a widely distributed pelagic fish, the narrow-banded Spanish mackerel (Scomberomorus commerson). Biological Jour-nal of the Linnean Society 104: 886–902.
Fenchel, T., 2005. Cosmopolitan microbes and their ‘‘cryptic’’ species. Aquatic Microbial Ecology 41: 49–54.
Fields, W.G., 1965. The structure, development, food relations, reproduction, and life history of the squidLoligo opale-scenBerry. California Department of Fish and Game, Fisheries Bulletin 131: 108.
Folmer, O., M. Black, W. Hoeh, R. Lutz & R. Vrijenhoek, 1994. DNA primers for amplification of mitochondrial cyto-chromecoxidase subunit 1 from diverse metazoan inver-tebrates. Molecular Marine Biology and Biotechnology 3: 294–299.
Forsythe, J. W., L. S. Walsh, P. E. Turk & P. G. Lee, 2001. Impact of temperature on juvenile growth and age at first egg-laying of the Pacific reef squidSepioteuthis lessoniana reared in captivity. Marine Biology 138: 103–112. Gaither, M. R., R. J. Toonen, D. R. Robertson, D. Planes & B.
W. Bowen, 2009. Genetic evaluation of marine biogeo-graphical barriers: perspectives from two widespread Indo-Pacific snappers (Lutjanus kasmiraandLutjanus fulvus). Journal of Biogeography 2009: 1–15.
Gaither, M. R., B. W. Bowen, T. Bordenave, L. A. Rocha, S. J. Newman, J. A. Gomez, L. van Herwerden & M. T. Craig, 2011. Phylogeography of the reef fishCephalopholis argus (Epinephelidae) indicates Pleistocene isolation across the Indo-Pacific barrier with contemporary overlap in the Coral Triangle. BMC Evolutionary Biology 11: 189–204. Godfrey, J. S., 1996. The effect of the Indonesian throughflow on ocean circulation and heat exchange with the atmo-sphere: a review. Journal of Geophysical Research 101: 12217–12237.
Gordon, A. L. & R. A. Fine, 1996. Pathways of water between the Pacific and Indian oceans in the Indonesian seas. Nature 379: 146–149.
Guindon, S. & O. Gascuel, 2003. A simple, fast and accurate method to estimate large phylogenies by maximum-like-lihood. Systematic Biology 52: 696–704.
Hebert, P. D. N., A. Cywinska, S. L. Ball & J. R. DeWaard, 2003. Biological identifications through DNA barcodes. Proceedings of the Royal Society London B 270: 313–321. Heled, J. & A. J. Drummond, 2010. Bayesian inference of species trees from multilocus data. Molecular Biology and Evolution 27: 570–580.
Iwata, Y., P. Show, E. Fujiwara, K. Shiba, Y. Kakiuchi & N. Hirohashi, 2010. Postcopulatory sexual selection drives intra-specific sperm dimorphism. Unpublished. GenBank Direct Submission. Accessed September 1, 2012. Izuka, T., S. Segawa, T. Okutani & K. Numachi, 1994. Evidence
on the existence of three species in the oval squid
Sepio-teuthis lessonianacomplex in Ishigaka Island, Okinawa,
Southwestern Japan, by isozyme analysis. The Japanese Journal of Malacology Venus 53: 217–228.
Izuka, T., S. Segawa & T. Okutani, 1996a. Biochemical study of the population heterogeneity and distribution of the oval squid Sepioteuthis lessoniana complex in southwestern Japan. American Malacological Bulletin 12: 129–135. Izuka, T., S. Segawa & T. Okutani, 1996b. Identification of three
species in oval squid,Sepioteuthis lessonianacomplex by chromatophore arrangements on the funnel. The Japanese Journal of Malacology Venus 55: 139–142.
Indo-Pacific squidSepioteuthis lessoniana(Cephalopoda: Loli-ginidae). Marine Biology 140: 747–754.
Jereb, P. & C. F. E. Roper, 2006. Cephalopods of the Indian Ocean. A review. Part I. Inshore squids (Loliginidae) col-lected during the International Indian Ocean Expedition. Proceedings of the Biological Society of Washington 119(1): 91–136.
Jereb, P. & C. F. E. Roper, 2010. Cephalopods of the World: An Annotated and Illustrated Catalogue of Cephalopod Spe-cies Known to Date. Volume 2. Myopsid and Oegopsid Squids. FAO Species Catalogue for Fishery Purposes. No. 4, Vol. 2. Rome.
Jivaluk, J., J. Nabhitabhata, A. Nateewathana & P. Wtprasit, 2005. Description of the Thai type of bigfin reef squid,
Sepioteuthis lessoniana, hatchling with note on
compari-son to Japanese types. Phuket Marine Biological Center Research Bulletin 66: 117–126.
Kessing, B., H. Croom, A. Martin, C. McIntosh, W. O. McMil-lan & S. Palumbi, 1989. A Simple Fool’s Guide to PCR. Department of Zoology, University of Hawaii, Honolulu. Kier, W. M., 1996. Muscle development in squid: ultrastructural
differentiation of a specialized muscle fiber type. Journal of Morphology 229: 271–288.
Knowlton, N., 1993. Sibling species in the sea. Annual Review of Ecology and Systematics 24: 189–216.
Knowlton, N., 2000. Molecular genetic analyses of species boundaries in the sea. Hydrobiologia 420: 73–90. Knowlton, N., E. Weil, L. A. Weigt & H. M. Guzman, 1992.
Sibling species inMontastraea annularis, coral bleaching and the coral climate record. Science 255: 330–333. Leache´, A. D. & M. K. Fujita, 2010. Bayesian species
delimi-tation in West African forest geckos (Hemidactylus fasci-atus). Proceedings of the Royal Society B 277: 3071–3077. Lee, P. G., P. E. Turk, W. T. Yang & R. T. Hanlon, 1994. Biological characteristics and biomedical applications of the squidSepioteuthis lessonianacultured through multiple generations. The Biological Bulletin 186: 328–341. Lefkaditou, E., M. Corsini-Foka & G. Kondilatos, 2009.
Description of the first Lessepsian squid migrant,
Sepio-teuthis lessoniana (CEPHALOPODA: Loliginidae), the
Aegean Sea (Eastern Mediterranean). Mediterranean Marine Science 10: 87–97.
Leray, M., R. Beldade, S. J. Holbrook, R. J. Schmitt, S. Planes & G. Bernardi, 2010. Allopatric divergence and speciation in coral reef fish: the three-spot dascyllus,Dascyllus
trima-culatus, species complex. Evolution 64: 1218–1230.
Lindgren, A. R., 2010. Molecular inference of phylogenetic relationships among Decapodiformes (Mollusca: Cepha-lopoda) with special focus on the squid Order Oegopsida. Molecular Phylogenetics and Evolution 56: 77–90. Maddison, W. P., 1997. Gene trees in species trees. Systematic
Biology 46: 523–536.
Mayr, E., 1942. Systematics and the Origin of Species. Columbia University Press, New York.
Mienis, H. K., 2004. New data concerning the presence of Lessepsian and other Indo-Pacific migrants among the molluscs in the Mediterranean Sea with emphasis on the situation in Israel. Turkish Journal of Aquatic Life 2: 117–131.
Miller, M. A., M. T. Holder, R. Vos, P. E. Midford, T. Liebo-witz, L. Chan, P. Hoover & T. Warnow, 2010. The CIPRES
Portals. CIPRES. 2009-08-04.http://www.phylo.org/sub_ sections/portal. Accessed August 4, 2009 (Archived by WebCite(r) athttp://www.webcitation.org/5imQlJeQa). Nateewathana, A., A. Munprasit & P. Dithachey, 2000.
Sys-tematics and distribution of oceanic cephalopods in the South China Sea, Area 3: Western Philippines. In Pro-ceedings of the Third Technical Seminar on Marine Fish-ery Resources Survey in the South China Sea, Area 3: Western Philippines, 13–15 July 1999, Bangkok, Thailand, Vol. 41: 76–100.
Natsukari, Y., Y. Nishiyama & Y. Nakanishi, 1986. A pre-liminary study on the isozymes of the loliginid squid,
Photololigo edulis(Hoyle, 12885). Report on Cooperative
Study onPhotololigo edulisin Southwestern Japan Sea: 145–151.
Nichols, R., 2001. Gene trees and species trees are not the same. Trends in Ecology and Evolution 16: 358–364.
Norman, M. D. & C. C. Lu, 2000. Preliminary checklist of the cephalopods of the South China Sea. The Raffles Bulletin of Zoology Supplement 8: 539–567.
Norman, M. D. & M. J. Sweeney, 1997. The shallow-water octopuses (Cephalopoda: Octopodidae) of the Philippines. Invertebrate Taxonomy 11: 89–140.
Nuryanto, A. & M. Kochzius, 2009. Highly restricted gene flow and deep evolutionary lineages in the giant clamTridacna
maxima. Coral Reefs 28: 607–619.
O’Dor, R. K., S. Adamo, J. P. Aitken, Y. Andrade, J. Finn, R. T. Hanlon & G. D. Jackson, 2002. Currents as environ-mental constraints on the behavior, energetics and distri-bution of squid and cuttlefish. Bulletin of Marine Science 71: 601–617.
Okutani, T., 2005. Past, present and future studies on cephalo-pod diversity in tropical west Pacific. Phuket Marine Bio-logical Center Research Bulletin 66: 39–50.
Okutani, T. & J. A. McGowan, 1969. Systematics, distribution, and abundance of the epiplanktonic squid (Cephalopoda, Decapoda) larvae of the California Current, April, 1954– March, 1957. In Arrhenius, G. O. S., C. S. Cox, E. W. Fager, C. H. Hand, T. Newberry & M. B. Schaefer (eds), Bulletin of the Scripps Institution of Oceanography 14.
Ovendon, J. R., J. Salini, S. O’Connor & R. Street, 2004. Pro-nounced genetic population structure in a potentially vagile fish species (Pristipomoides multidens, Teleosteo; Perci-formes; Lutjanidae) from the East Indies triangle. Molec-ular Ecology 12: 1991–1999.
Pecl, G. T., 2001. Flexible reproductive strategies in tropical and temperate Sepioteuthis squids. Marine Biology 138: 93–101.
Pecl, G. T. & G. C. Jackson, 2008. The potential impacts of climate change on inshore squid: biology, ecology and fisheries. Reviews in Fish Biology and Fisheries 18: 373–385. Pecl, G. T., S. Tracey, J. Semmens & G. D. Jackson, 2006. Use
of acoustic telemetry for spatial management of southern calamary,Sepioteuthis australis, a highly mobile inshore squid species. Marine Ecology Progress Series 328: 1–15. Planes, D. & C. Fauvelot, 2002. Isolation by distance and vicariance drive genetic structure of a coral reef fish in the Pacific Ocean. Evolution 56: 378–399.