DECADAL FOREST COVER LOSS ANALYSIS OVER INDIAN FORESTS USING MODIS 250M IMAGERY
R. Suraj Reddya,*, Gaurav Srivastavaa, G. Rajashekara, C.S.Jhaaand V.K. Dadhwalb
aForestry and Ecology Group, National Remote Sensing Centre, Hyderabad- 500 037 (suraj.nrsc, gaurav.sri333, grajashekar, chandra.s.jha)@gmail.com
bNational Remote Sensing Centre, Hyderabad- 500 037 – [email protected]
Commission VIII, WG VIII/7
KEY WORDS: Forest disturbance, Change detection, Integrated Forest Z-score (IFZ), MODIS, Time series.
ABSTRACT:
India is endowed with a rich forest cover. Over 21% of country’s area is covered by forest of varied composition and structure. Due to large amount of carbon stored in forests and their role in land surface and climatic processes, it is important to monitor forests for effective management and modeling studies. The disturbance regimes associated with forest regeneration and recovery, occurring in a heterogeneous matrix of confounding land covers makes forest monitoring an involved and complex task. Over a 13 year period (2000 – 2013), detection of forest cover loss at regional scale using a coarse resolution imaging sensor (MODIS - 250m) in Indian forests is attempted in the present study. MODIS provides a rich basis for forest cover monitoring at regional scales on an interannual to decadal timescales due its huge database and high temporal frequency. Forest cover loss across different forest types in parts of Maharashtra, Odisha, Chhattisgarh and Telangana states were identified using a forest-likelihood and a multi-thresholding approach. The study reveals that considerable amount of deforested patches exist over the study areas during the 2000 to 2013. Results also suggested that the detection accuracy improved with the increase of fraction of deforestation in the MODIS pixel, but still relatively small changes were also detected.
1. INTRODUCTION
Forest cover loss contributes to greenhouse gases emissions, majorly carbon dioxide, from the terrestrial biosphere into the atmosphere (Houghton, 2005). Tropical deforestation is considered to be the second largest source of anthropogenic emissions with an estimated value of 0.3 to 0.8 Pg C yr−1 into the atmosphere in the 1980’s, 0.5 to 3.0 Pg C yr−1 in the 1990’s and 0.81 to 2.2 Pg C yr−1 in the 2000’s (Achard et al., 2004; Baccini et al., 2012; DeFries et al., 2002). The wide range of emission estimates is mainly due to uncertainties in both deforestation and biomass density estimates. Therefore, more reliable and accurate quantification of forest cover change is needed for global change studies in reducing uncertainties in carbon emission estimates and for evaluating the effectiveness of environmental policies aiming at reducing emissions from deforestation and forest degradation (REDD+).
Satellite remote sensing is a promising tool for characterizing the current forest state and forest change dynamics. The range and complexity in forest composition and structure as well as variations in the intra and inter annual phenology makes it challenging to identify forest disturbances. Over the past 4 decades, several methods have been developed to map forest cover loss due to deforestation, forest mortality and urbanization at local scales using Landsat (Collins and Woodcock, 1994; Huang et al., 2010; Skole and Tucker, 1993) and at regional scales using coarse resolution Advanced Very High Resolution Radiometer (AVHRR) and Moderate Resolution Imaging Spectroradiometer (MODIS) (Broich et al., 2011; Coops et al., 2009; Ehrlich et al., 1994; Hansen et al., 2008; Young and Wang, 2001).
Since 2000, the availability of MODIS data at various spatial resolutions (250m, 500m, and 1000m) with high revisit
capability has provided an improved basis for regional and global land cover change mapping. Generally, the spatial scale of changes in forest cover is relatively small for a snapshot and temporally they may be sudden to gradual. But over a period of time, it is noticed that the deforested patches increase to a considerable spatial extent and thus could be detected using MODIS 250m imagery. Earlier studies used MODIS data in conjunction with Landsat type datasets to estimate net forest loss using regression models (Hansen et al., 2008; Hayes and Sader, 2001). Other methods such as change indices (Coops et al., 2009), temporal trajectory based change detection algorithms (Huang and Friedl, 2014) and classification (Carroll et al., 2011) are also used to provide change information at native MODIS resolution, but often do not employ the multi-temporal information.
The main objective of the present study is to develop a method for use of temporal information to provide more efficient and accurate identification of change locations. The method uses single season multi-date images to determine forest cover loss across Indian forest types between 2000 and 2013. The high revisit capability and wide spectral range (0.4µm to 14.4 µm) of MODIS makes it ideal for regional change detection study, especially in tropics, where data quality is highly effected due to cloud cover and aerosol contamination. Due to coarse spatial resolution of MODIS (250m), a window of 13 years (2000-2013) was chosen to identify large-scale deforested patches.
2. DATA AND METHODS
using a histogram slicing approach and secondly use a multi-thresholding criterion to detect forest loss areas.
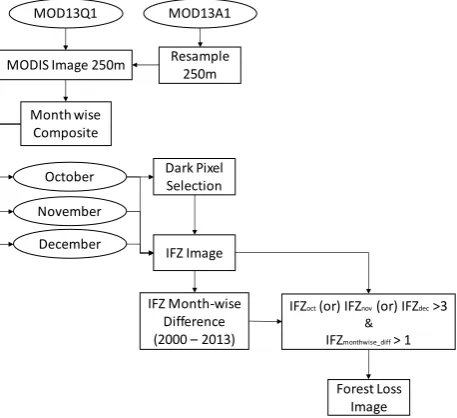
Figure 1. Flowchart of methodology used for pre-processing and forest loss area detection using MODIS Imagery
2.1 IFZ Calculation
Forests appear as darkest vegetated surfaces in satellite images acquired during growing (leaf-on) season in visible and shortwave infrared bands due to substantial shadow casting within the tree canopy (Huang et al., 2008). Most forest disturbance events result in abrupt spectral changes due to sudden reduction and removal of forest canopy cover and woody biomass. The present methodology uses forest samples to normalize the image radiometry and to calculate forest likelihood measure. Since the forest pixels are darkest vegetated pixels, they are generally located towards the lower end of the histogram. When there are enough pixels in a given area, they tend to make a forest peak and thus could be delineated using histogram slicing. Automatic delineation of forest pixels is thereby achieved by identifying forest peak and then thresholding the satellite image using threshold values defined by forest peak (Figure 2).
Since water pixels can also be located at the lower end of the histogram (i.e. where forest pixels are located), MODIS Water mask (MOD44W) was used to remove water pixels wrongly identified as forest pixels. For uniform selection of forest pixels across different types in a given image, moving local window (20 x 20 km) was used for the forest peak delineation. The identified forest samples are used to calculate an integrated forest z-score (IFZ), which is indicative of the likelihood of each pixel being a forest pixel. Integrated forest z-score can be forest samples for band i spectral values respectively. NB is the total number of bands.
MODIS red band (620-670 nm) at 250m (MOD09Q1) was used
SWIR bands are resampled from 500m to 250m (MOD09A1), were used to calculate IFZ. Normalized Difference Vegetation Index (NDVI) at 250m was also used in IFZ calculation instead of NIR band since it does not directly correlate with disturbance events.
IFZ is an inverse measure of the likelihood of a pixel being forest pixel. Low IFZ value near to 0 implies that the pixels are close to spectral center of forest pixels, while those with high IFZ values are likely to be non-forest pixels. When there is a sudden change in the forest cover of a pixel there is abrupt increase in the IFZ value. If such increase is observed consistently over time, it is termed as deforested pixel. On assuming forest pixels with in an image have a normal distribution, statistically over 99% of forest pixels will have IFZ value less than 3. Conversely, pixels with IFZ values greater than 3 are most likely non-forested pixels.
Figure 2. Identification of forest Peak using histogram constructed using red band reflectance in a local window (20km x 20km). Forests appear darkest in IFZ Image as reference to forest in standard False Color Composite (FCC).
2.2 Change Detection
entire growing season of 2000 and 2013 is consistently above a threshold of 1. The thresholds were chosen to achieve least error of commission (i.e. identifying very confident change locations). The entire algorithm was automated and has been implemented in MATLAB.
3. RESULTS
The algorithm was tested in forests in parts of Maharashtra, Odisha, Chhattisgarh and Telangana states. Several hotspot locations were identified as forest cover loss pixels affected by
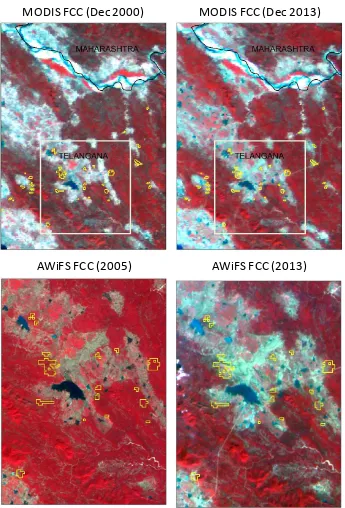
change events during 2000 to 2013. Figure 3 shows a hotspot location of forest cover loss occurred in Telangana state. Forest cover loss was largely attributed to logging events.
The sub-window shows a total of 212 pixels identified as forest cover loss (Figure 3). The identified forest cover loss pixels were verified/validated using high resolution IRS AWiFS Imagery. Visual interpretation in several areas of forest cover loss was found to be well in accordance with IRS AWiFS Imagery.
Figure 3. Forest Cover Loss areas as identified using MODIS imagery and verified visually using high resolution IRS AWIFS Imagery. The change areas indicate a change year in between 2005 to 2013 as the forest pixels were undisturbed till 2005.
MODIS FCC (Dec 2000)
MODIS FCC (Dec 2013)
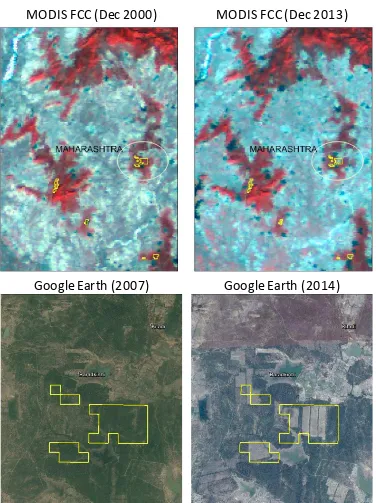
Since MODIS is a coarse resolution satellite (250m), the entire area (250m x 250m) may not have been affected but the fraction of vegetation loss is enough to alter the spectral signature of the pixel. In order to assess the sensitivity of fraction of vegetation cover loss in a given pixel, the images are visually verified using
very high resolution Google earth imagery (Figure 4). It has appeared that the method was sensitive to forest cover loss attributing to about 50% within the MODIS 250m pixel.
Figure 4. The areas of forest cover loss as identified using MODIS imagery. The deforested patches show a change in between 2007 to 2014 as verified using very high resolution Google Earth Imagery.
4. Conclusions
A multi-temporal approach for detection of forest cover loss using MODIS 250m imagery was developed and evaluated in the present study. Due to coarse resolution imagery, our results depend on size and intensity of change event. However, the results of the study states that there has been several hotspot
results presented in this paper indicate that the current methodology was effective, but it has to be tested in other Indian forest types to evaluate the sensitivity of the thresholds used. While the paper uses two year images to identify forest cover loss locations, the availability of huge time series of MODIS imagery could as well be used to examine the forest cover changes at a finer time scale (every 2-3 years) to label
MODIS FCC (Dec 2000)
MODIS FCC (Dec 2013)
global concern of forest loss, identifying the change locations effectively would help the policy makers for effective management.
5. References
Achard, F., Eva, H.D., Mayaux, P., Stibig, H.-J., Belward, A., 2004. Improved estimates of net carbon emissions from land cover change in the tropics for the 1990s. Global Biogeochem. Cycles 18.
Baccini, A., Goetz, S.J., Walker, W.S., Laporte, N.T., Sun, M., Sulla-Menashe, D., Hackler, J., Beck, P.S.A., Dubayah, R., Friedl, M.A., Samanta, S., Houghton, R.A., 2012. Estimated carbon dioxide emissions from tropical deforestation improved by carbon-density maps. Nat. Clim. Chang.
Broich, M., Hansen, M.C., Potapov, P., Adusei, B., Lindquist, E., Stehman, S. V., 2011. Time-series analysis of multi-resolution optical imagery for quantifying forest cover loss in Sumatra and Kalimantan, Indonesia. Int. J. Appl. Earth Obs. Geoinf. 13, 277–291.
Carroll, M., Townshend, J., Hansen, M., DiMiceli, C., Sohlberg, R., Wurster, K., 2011. MODIS Vegetative Cover Conversion and Vegetation Continuous Fields, in: Land Remote Sensing and Global Environmental Change. Springer, pp. 725–745.
Collins, J.B., Woodcock, C.E., 1994. Change detection using the Gramm-Schmidt transformation applied to mapping forest mortality. Remote Sens. Environ.
Coops, N.C., Wulder, M.A., Iwanicka, D., 2009. Large area monitoring with a MODIS-based Disturbance Index (DI) sensitive to annual and seasonal variations. Remote Sens. Environ. 113, 1250–1261.
DeFries, R.S., Houghton, R.A., Hansen, M.C., Field, C.B., Skole, D., Townshend, J., 2002. Carbon emissions from tropical deforestation and regrowth based on satellite observations for the 1980s and 1990s. Proc. Natl. Acad. Sci. U. S. A. 99, 14256–14261.
Ehrlich, D., Estes, J.E., Singh, A., 1994. Applications of NOAA-AVHRR 1 km data for environmental monitoring. Int. J. Remote Sens.
Hansen, M.C., Roy, D.P., Lindquist, E., Adusei, B., Justice, C.O., Altstatt, A., 2008. A method for integrating MODIS and Landsat data for systematic monitoring of forest cover and change in the Congo Basin. Remote Sens. Environ. 112, 2495–2513.
doi:10.1016/j.rse.2007.11.012
Hayes, D.J., Sader, S.A., 2001. Comparison of
ChangeDetection Techniques for Monitoring Tropical Forest Clearing and Vegetation Regrowth in a Time Series. Photogramm. Eng. Remote Sens. 67, No. 9, 1067–1075.
Houghton, R.A., 2005. Aboveground forest biomass and the global carbon balance. Glob. Chang. Biol. 11, 945–958.
Huang, C., Goward, S.N., Masek, J.G., Thomas, N., Zhu, Z., Vogelmann, J.E., 2010. An automated approach for reconstructing recent forest disturbance history using dense Landsat time series stacks. Remote Sens. Environ. 114, 183–198.
Huang, C., Song, K., Kim, S., Townshend, J.R.G., Davis, P., Masek, J.G., Goward, S.N., 2008. Use of a dark object concept and support vector machines to automate forest cover change analysis. Remote Sens. Environ. 112, 970– 985.
Huang, X., Friedl, M.A., 2014. Distance metric-based forest cover change detection using MODIS time series. Int. J. Appl. Earth Obs. Geoinf. 29, 78–92.
Skole, D., Tucker, C., 1993. Tropical deforestation and habitat fragmentation in the Amazon: satellite data from 1978 to 1988. Science 260, 1905–1910.