SPECTRAL ANALYSIS OF DIFFERENT VEGETATION COVER USING THE
HYPERION SENSOR - A CASE STUDY IN THE STATE OF RIO DE JANEIRO - BRAZIL
E. M. F. R. de Souza a b, , R. S. Vicens a, A. E. P. Rosa a, C. B. M. Cruz b a
UFF, Dept. of Geography, Federal University Fluminense, Brazil, Niteroi - (elizabethmfr, rsvicens, anely2509)@gmail.com
b
UFRJ, Dept. of Geography, Federal University of Rio de Janeiro, Brazil, Rio de Janeiro, ([email protected])
Commission VII/3
KEY WORDS: Hyperespectral, Vegetation cover, Landscape, Remote Sensing, Atlantic Forest.
ABSTRACT:
The knowledge about of land use and current status of vegetation represent important steps in understanding the spatial dynamics in areas with increased removal of vegetation and human disturbance. This feature is very common in its Brazil considering the biophysical diversity observed. In this sense, interest in patterns and processes that lead to environmental changes has been receiving great support from geoprocessing and remote sensing for monitoring, environmental and planning of natural resources. Following this trend, the study uses products from hyperspectral geotechnology to identify new methods of analysis of the landscape, in areas with vegetation remnants of Atlantic Forest in the State of the Rio de Janeiro.
1. INTRODUCTION
1.1 Relevance of the Research
This study seeks to determine the classification targets that represent the vegetation Atlantic Forest using hyperspectral remote sensing. Actions focused on environmental management and control of deforestation will be benefited with the results.
In this context is important to note that the use of geotechnologies, especially the remote sensing techniques already were adopted in studies of different vegetation covers during the '40s through the use of the aerial photographs. The results obtained by RADAM Brazil represent an important milestone for the application of this tool. This aspect is important because show the beginning to specific applications in landscape and the classification of images or photos for the generation of thematic maps.
According Ponzoni and Shimabukuro (2007) during the 80 begin the activities for the classification of different vegetation cover with an emphasis on qualitative analysis. The context begins to change from the 90's. In this moment arise new studies with remote sensing to explore the quantitative aspects, from the study of correlation between the biophysical and geophysical parameters of the environment, and radiometric data extracted from the images.
1.2 Objectives and Study Area
The aim of this study is to explore a geotechnology still little known among specialists in geosciences, especially geography, in order to identify the stages of vegetative conservation, considering the different spectral responses of vegetation in a section with the availability of hyperspectral images, in the State of Rio de Janeiro - Brazil. They are specifics objectives: Analysis of hyperspectral images and spectral responses for the different types surface, highlighting the spectral responses obtained for the structures of forest fragments in approximate.
scale of 1:100,000, using the samples and analysis of resulting graphs.
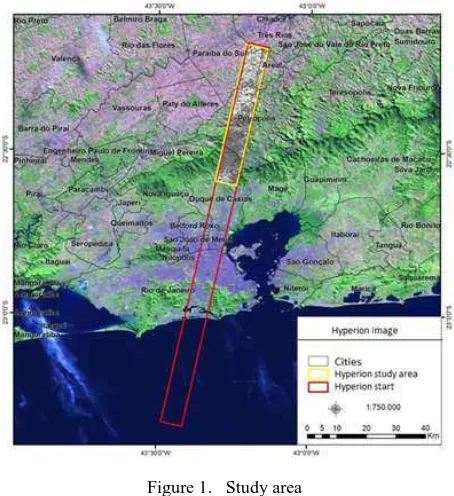
The study area covers the cities of Paraíba do Sul, Areal, Petrópolis and Duque de Caxias, in the Rio de Janeiro state. The Figure 1 highlights the study area.
Figure 1. Study area
According to Souza (2009) the knowledge about the spectral behavior of vegetation is essential for the correct extraction of different classes from the images.
According to Goel (1988), the radiation detected by the sensors is a function of parameters of the radiation source, the atmosphere, canopy of the trees, soil, parameters of the sensor. So what is actually measured by a remote sensor come from a International Archives of the Photogrammetry, Remote Sensing and Spatial Information Sciences, Volume XXXIX-B7, 2012
XXII ISPRS Congress, 25 August – 01 September 2012, Melbourne, Australia
plant canopy can not be explained only by the characteristics of this canopy. This way is important to know every the characteristics of the landscape.
2. METHODS
2.1 Techniques and Softwares
The methodology implemented for this study addressed the acquisition of Hyperion satellite imagery, pre-processing to the scenes, samples selection for appointment of vegetation classes and analysis of results from the spectral response graphs for each class.
The acquisition was made by access to e-mail address: http://glovis.usgs.gov. The image used was acquired by the sensor on July 13, 2010.
During the pre-processing was used the software ENVI and the tool hyperion_tools.sav that allowed the inclusion of scenes and correction of the noise characteristics, in the form L1R. Later was selected the tool for converting raw data into a new file format has the ENVI software. This procedure was necessary because the step of atmospheric correction of images requires scenes with the extension feature of the software.
Para a realização da correção atmosférica foi utilizado o modulo FLAASH (Fast Atmospheric sigt Analyst Line of the Spectral Hypercube) presente no software ENVI. The parameters adopted for the implementation of atmospheric correction were:
- sensor altitude: 705 km (above sea level);
- mean elevation of the image area 0.6 km (kilometers above the sea); provided by the Brazilian Institute of Geography and Statistics - IBGE, and orthophotos on the same scale. With the support of this material were collected 23 control points for the implementation of the adjustment of the scenes and another 21 points to verify the results obtained. The orthorectification was performed at the PCI Geomatics OrthoEngine software version 10. To evaluate the results obtained by the geometric correction, the bands were compared before and after the orthorectification, and classified according to Standard Cartographic Accuracy - PEC, according to current law in Brazil. The PEC is a statistical indicator of dispersion on the 90% probability, which defines the accuracy of cartographic works on a national scale. The probability of 90% corresponds to 1.6449 times the standard error.
After adjusting the image was carried out field work to identify different classes of vegetation and the stages of conservation. Some samples were selected. Were considered: Pasture - P, Capoeira - S, Early Stage in Forest Conservation – F1, Forest Conservation Internship in Secondary - F2 and Advanced Internship in Forest Conservation - F3. Among the parameters considered for this classification is the species diversity and degree of canopy closure.
Finally, after completion of the image processing , some curves were created representing the spectral reflectance of the objects. In this stage was is possible identify the different responses for each class.
3. RESULTS AND DISCUSSION
The atmospheric correction enabled the improvement in spectral response of the targets, especially in areas with vegetation cover.
The results observed after the orthorectification of the scene showed that the product meets the class B to a scale of 1:50,000 as indicated by PEC.
3.1 Vegetation cover
During the field work were initially identified Pasture samples as seen in Figure 2. This class is very common, especially near the roads.
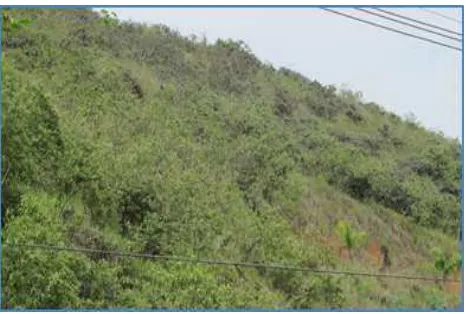
Figure 3. Types of vegetation - Capoeira International Archives of the Photogrammetry, Remote Sensing and Spatial Information Sciences, Volume XXXIX-B7, 2012
XXII ISPRS Congress, 25 August – 01 September 2012, Melbourne, Australia
The figure 4 shows the area with example to Early Stage in Forest Conservation . It’s possible observes the existence of few species.
Figure 4. Types of vegetation - Early Stage in Forest Conservation
The Figure 5 shows the area vegetation classified as Forest Conservation Internship in Secondary. There is a clear difference in the texture of the vegetation and a more diversity species.
Figure 5. Types of vegetation – Forest Conservation Internship in Secondary
The Figure 6 show a sample of the Advanced Internship in Forest Conservation.
Figure 6. Types of vegetation – Advanced Internship in Forest Conservation.
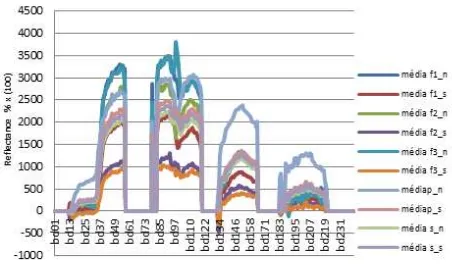
After identification of classes for field work were generated graphics reflectance curves for each class. The results are shown in Figure 7.
Figure 7. Reflectance of different vegetation cover
All classes considered in the study had different spectral responses, allowing to separate the targets. The location of the sample and the influence of topography are important factors to define and differentiate each class.
The classes F1, F2, F3 and pasture showed different spectral responses, considering the average of the samples. By analyzing separately each class is it possible see the difference between the samples in front of the north position or the south. Some classes F1 and F2 showed similar responses and were eliminated during the analysis. Some classes had interference from shadows, because it is a region with great variation in topography and floristic diversity.
This initial analysis identified the different responses of each coverage that will generate a more detailed mapping of each vegetation type. The classification will be made in next stage using object-oriented classification.
4. CONCLUSIONS
The vegetation is the target of many strategies for conservation in Brazil. The use of a hyperspectral sensor is intended to support the demands for use and land cover classification, of the different stages of conservation of vegetation in the areas of interest. In future steps will be carried out further analysis to identify new classes, as well the as comparison with data collected in the new field. The remote sensing Hyperspectral has been shown promise for the analysis the vegetation.
5. REFERENCES
Ponzoni, F. J.; Shimabukuru, Y. E. Sensoriamento Remoto no Estudo da Vegetação. São José dos Campos. Sindicato Nacional de Editores de Livros. 2007.
Souza, A. A. Estudo de Fitofisionomias de cerrado com dados de sensor Hyperion/EO-1. Dissertação de Mestrado em Sensoriamento Remoto - Instituto Nacional de Pesquisas Espaciais, São José dos Campos, 117p. 2009.
Goel, N.S. Models of vegetation canopy reflectance and their use in estimation of biophysical parameters from reflectance data. Remote Sensing Reviews, v.4, p. 1-24, 1988.
International Archives of the Photogrammetry, Remote Sensing and Spatial Information Sciences, Volume XXXIX-B7, 2012 XXII ISPRS Congress, 25 August – 01 September 2012, Melbourne, Australia