International Journal of Scientific and Research Publications, Volume 6, Issue 3, March 2016 124 ISSN 2250-3153
www.ijsrp.org
Comparative Study between Data Flow Diagram and Use
Case Diagram
Arwa Y. Aleryani
Saba University, Yemen
Abstract- Most of information systems use nowadays were modeled and documented using structured approach. Expansion of these systems in terms of functionality and maintainability requires shift towards object-oriented documentation and design, which has been widely accepted by the business. In this paper, we compared between Data flow diagram and Use case diagram to find out the strengths and weakness over each of them. As a result, the author concluded that DFD still powerful tool through system analysis and design process, and can be included in object- oriented approach.
Index Terms- System analysis and design, traditional approach, object- oriented approach, data flow diagram, use case diagram.
I. INTRODUCTION
ost of the information systems in use nowadays were modeled and documented using structured approach [1]. These systems were developed in languages that have become out-dated now [2]. The structured approaches are used to represent the dynamic and behavioral view of the system. It is a tool for system analysis that designs the system as a hierarchy of functions. The structured approach is based on graphical tools (such as DFD, decision tree, decision tables etc.) application. The most important diagram used in structured approach is Data Flow Diagram (DFD) [3]. Other diagrams like Structure chart, State machine, ER Diagrams are less useful. DFD’s are having certain advantages over them. The hierarchal structure of DFD provides different abstraction level which is very useful in system designing [2].
The object oriented approach combine data and associated methods in to a single unit called object for developing complex systems. Unified Modeling Language (UML) has now become the most important tool for model Object-Oriented systems and model creation. UML is a collection of diagrams that is used to model the different aspects of object oriented software. UML is widely used for modeling complex systems [4]. Use-Case diagrams are very important tool of UML and the developers can rely upon Use-Case diagrams for analysis of the system [3].
II. RESEARCH THEORETICAL
Data Flow Diagram (DFD)
Data Flow Diagram (DFD) was first proposed by Larry Constantine the original developer of structured design at 1970s [5].
DFD is the primary artifact and is required be created for every systems in structured approach. It has hierarchal structure,
which provides different abstraction level, useful in system designing.
Besides, DFD is such a fundamental artifact that clearly shows the structure of a system. Other artifacts use the information provided by the DFD to represent dynamic aspect of the system [6], [2]. Data flow diagram is a graphical representation of the flow of data through an information system [7]. It shows data flow from external into the system and shows how the data moved from one process to another process.
DFD Component
A data flow diagram illustrates the processes, data stores, and external entities in a business or other system and the connecting data flows, [8]. There are only four symbols for a data flow diagram: (1) Squares or Ovals represent external entities: it is a person or a group of people outside the control of the system being modeled. It represents where information comes from and where it goes. (2) Circles or Rounded Rectangles: they represent processes within the system. They show a part of the system that transforms inputs into outputs. The name of the process in the symbols usually explains what the process does so that it is generally used with verb-object phase. (3) Arrows: they represent the data flows. They can be either be electronic data or physical items or both. The name of the arrows represents the meaning of the packet (data or items) that flow along. In addition, arrows in data flow diagrams show direction to indicate whether data or items are moving out or into a process. (4) Open-ended Rectangles: they represent data stores, including both electronic stores and physical stores. Data stores might be used for accumulating data for a long or short period of times.
Use Case Diagram (UCD)
A use case diagram was proposed by Ivar Jacobson by 1986 [9]. A use case is a methodology used in system analysis to identify, clarify, and organize system requirements. Use case diagrams are employed in UML (Unified Modeling Language), a standard notation for the modeling of real-world objects and systems [10]. In the Unified Modeling Language (UML), a use case diagram is a sub class of behavioral diagrams.[11] Use Case Diagram is one of the Object Oriented Diagrams. It shows how a system interacts with the external entities. So, it is relatively sparse about the details of how the system behaves internally and how the external environment is arranged.
Use Case Diagram Components
There are four major symbols in the Use Case Diagrams: (1) Actor: is a person, group of people, organization, or external system the plays a role in one or more interactions with the
International Journal of Scientific and Research Publications, Volume 6, Issue 3, March 2016 125 ISSN 2250-3153
www.ijsrp.org
system. Furthermore, it can be networks, communication devices, computers, or other programs on the same computer. It is represented by stick figure. (2) Use cases: describe a sequence of actions. Those actions must provide the measurable value to an actor. It is represented by horizontal ellipse. (3) Associations: interaction described by a use case. It is represented by lines connecting between use cases and actors with an optional arrowhead on one end of the line. Notice that the arrowheads in use case diagram is used for indicating the direction of the initial invocation of the relationship or to indicate the primary actor (4) System boundary: is the rectangle around the use cases, anything within this boundary is the functionality in scope of the system.
III. LITERATURE REVIEW
Kith et. al. [12] they compared between DFD and Use case through working library system. They came up that when using case diagrams without a context it is difficult to form a process view because use case are disjointed, DFD on the other hand gives a process view of the system. Further decomposition of processes provides a functional view.
Tiwari et. al. [3] they presented an approach that combines the DFD with the UML diagrams. They combined of both approaches to be beneficial for the developers. They merged data flow diagrams with Unified Modeling Language diagrams (use-case & class diagrams). They developed a model in which the use-case diagrams and class diagrams to be combined with the data flow diagrams. Their work is just a theoretical approach. Munassar, et. al. [11] they compared between Traditional Approach and Object-Oriented Approach in Software Engineering Development. Their comparison came up that traditional approach has a lot of models that deal with different types of projects but all of them lack flexibility to deal with other kinds of projects like Object-Oriented. In the other hand object– oriented Software Engineering (OOSE) is an object modeling language and methodology. Their table of the comparison listed some points such as: Traditional approach uses common processes likes: analysis, design, implementation, and testing. It depends on the size of projects and type of projects. In the other hand Object-oriented approach uses UML notation likes: use case, class diagram, communication diagram, development diagram and sequence diagram. It depends on the experience of the team and complexity of projects through the numbers of objects.
Atif, et. al. [2] They presented a survey of the existing data flow diagram to Unified Modeling language (UML) transformation techniques. They observed that most of the transformation approaches are rule based, which are incomplete and defined at abstract level that does not cover in depth transformation and automation issues. From their comparison of the existing DFD-to-UML design transformation techniques, they observed that different analysts/designers have their own interpretation of different DFD graphical symbols as DFD has informal syntax.
IV. RESEARCH METHODOLOGY
The main objective of this research is to compare between DFD and use case to understand each of them and find the difference between them.
V. DISCUSSION
From the literature review and from author experience, both diagrams have the mean of graph shape which is considered understandable by customers. Both of them present the system functions and how the data moving through the system. When deal with large system, DFD becomes difficult to understand and starts to be crowded with DFD sub function.
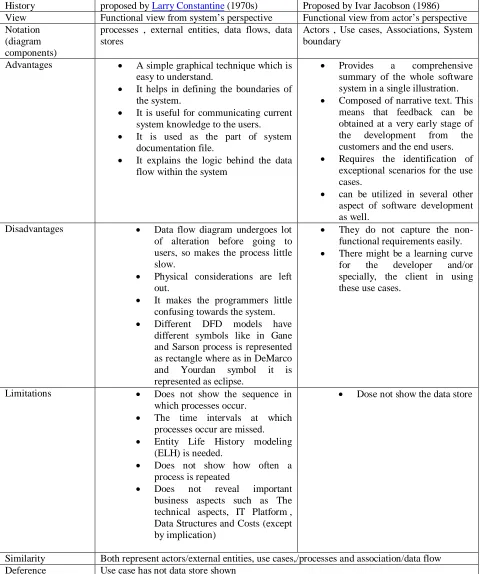
From table (1,2) we can see both of them take the same way to model the system, no big different to change the symbol of external entity/actor from rectangle to person symbol. In the same time we can realize the absent of data stores in UCD. From table (3) what is not shown in DFD or UCD, they appear in different tools. If all these details should be included at DFD or UCD; they will be very difficult for user to understand
VI. CONCLUSION
To conclude the above discussion, we think that DFD still powerful and can be included in object- oriented approach. UCD can be used as a first draft between system analyst and customer discussion, then the system analyst can go to DFD as a formal modeling for the system. System analyst should put on mind the following when using DFD:
1. The functions should be numbered as they start. 2. Use only one type of symbols
3. The data flow might be numbered and only its number be presented on the data flow arrow which presented on DFD, that make the diagram more understandable. Their name might be written separately in a table to clarify their meaning.
REFERENCES
[1] Yourdon, E. (1989). Modern Structured Analysis. Yourdon Press. Upper Saddle River, NJ. Newcombe, P. and Doblar, R. A. (2001 December). Automated Transformation of legacy systems. Crosstalk, 14, 18-22. [2] Atif A. A. Jilani , Muhammad Usman, Aamer Nadeem, Zafar I. Malik ,
Zahid Halim(2011), Comparative Study on DFD to UML Diagrams Transformations, World of Computer Science and Information Technology Journal(WCSIT) Vol. 1, No.1,10-16, 2011.
[3] Tiwari, K., Tripathi, A., Sharma, S., Dubey, V. (2012 ) Merging of Data Flow Diagram with Unified Modeling Language, International Journal of Scientific and Research Publications, Volume 2, Issue 8, August 2012 [4] Ileana Ober, “More meaningful UML Models”, TELELOGIC, 2000 IEEE
Journal.
[5] Wikipedia available at https://en.wikipedia.org/wiki/Data_flow_diagram, Seen 5 October 2015.
[6] Kendall, K. E., Kendall J. E. (1999). System Analysis and Design. (3rd Edition), Prentice Hall
[7] Rob, P.; Coronel, C. (2007), Database Systems: Design, Implementation, and Management, Sixth Edition.
International Journal of Scientific and Research Publications, Volume 6, Issue 3, March 2016 126 ISSN 2250-3153
www.ijsrp.org
[9] Use case diagram (1), available via
http://en.wikipedia.org/wiki/Use_case_diagram, Last modified 18 September 2015, seen in2015-10-06
[10] Use case diagram (2) available via
http://whatis.techtarget.com/definition/use-case-diagram seen October 2015-10-04
[11] Munassar, N. ; Govardhan, A. (2011) Comparison between Traditional Approach and Object-Oriented Approach in Software Engineering
Development, IJACSA, International Journal of Advanced Computer Science and Applications, Vol. 2, No. 6,
[12] Keith, J.; Kohlamn, R. (2006) Majik Consulting white paper series ABN 87 007 192 109
AUTHORS
First Author – Arwa Y. Aleryani, Saba University, Yemen
DFD
Notation Function Shape
External entity it is a person or a group of people outside the system plays a role in one or more interactions with your system, it represents where information comes from and where it goes
Process It shows all the functions of the system
Data flow show direction to indicate whether data or items are moving out or into a process
Data store Where data of the system has been stored
Use Case
Notation Function Shape
Actor it is a person or a group of people outside the system plays a role in one or more interactions with the system, it represents where information comes from and where it goes
Use cases It shows all the functions of the system
Association represents the connecting between use cases and actors
System boundary Determent the system boundary
Compression between DFD and Use Case
Topic DFD Use Case
External
entity
Process
N0 of process
data
International Journal of Scientific and Research Publications, Volume 6, Issue 3, March 2016 127 ISSN 2250-3153
www.ijsrp.org
History proposed by Larry Constantine (1970s) Proposed by Ivar Jacobson (1986) View Functional view from system’s perspective Functional view from actor’s perspective Notation
(diagram components)
processes , external entities, data flows, data stores
Actors , Use cases, Associations, System boundary
Advantages • A simple graphical technique which is easy to understand.
• It helps in defining the boundaries of the system.
• It is useful for communicating current system knowledge to the users.
• It is used as the part of system documentation file.
• It explains the logic behind the data flow within the system
• Provides a comprehensive summary of the whole software system in a single illustration.
• Composed of narrative text. This means that feedback can be obtained at a very early stage of the development from the customers and the end users.
• Requires the identification of exceptional scenarios for the use cases.
• can be utilized in several other aspect of software development as well.
Disadvantages • Data flow diagram undergoes lot of alteration before going to users, so makes the process little slow.
• Physical considerations are left out.
• It makes the programmers little confusing towards the system.
• Different DFD models have different symbols like in Gane and Sarson process is represented as rectangle where as in DeMarco and Yourdan symbol it is represented as eclipse.
• They do not capture the non-functional requirements easily.
• There might be a learning curve for the developer and/or specially, the client in using these use cases.
Limitations • Does not show the sequence in which processes occur.
• The time intervals at which processes occur are missed.
• Entity Life History modeling (ELH) is needed.
• Does not show how often a process is repeated
• Does not reveal important business aspects such as The technical aspects, IT Platform , Data Structures and Costs (except by implication)
• Dose not show the data store
Similarity Both represent actors/external entities, use cases,/processes and association/data flow Deference Use case has not data store shown