HYPERSPECTRAL IMAGE SHARPENING BASED ON EHLERS FUSION
S. Xu a, *, M. Ehlers a
a Institute of Computer Science, Osnabrueck University, Wachsbleiche 27, 49090 Osnabrueck, Germany - (shaojuan.xu, manfred.ehlers)@uos.de
Commission III, WG III/6
KEY WORDS: Data Fusion, Hyperspectral Image, Pansharpening, Ehlers Fusion, IHS Transform, High-Pass Filter, Band-Pass Filter
ABSTRACT:
As the application of hyperspectral images is increasing, many researchers attempt to extend existing pansharpening techniques to hyperspectral images. This paper focuses on the application of Ehlers fusion to hyperspectral image sharpening. Ehlers fusion involves two crucial algorithms: filter technique in the frequency domain and intensity transform. In this study, different filter types and intensity transform methods were analysed separately. With a combination of filter types and intensity transforms, the fusion procedure was implemented to test data sets. The spectral profiles of the pixels of the images were then used as a tool to control the quality of the fused image. Finally, the performance of Ehlers fusion is compared with Principle Component (PC) analysis, Gram-Schmidt transform (Gram-Schmidt), High-Pass Filtering in the spatial domain (HPF), and Wavelet Principal Component (Wavelet-PC) analysis using the same input data. The comparison shows that Ehlers high-pass filter fusion shows outstanding performance both on spatial enhancement and colour preservation.
1. INTRODUCTION
In the remote sensing community, pixel based image fusion mainly aims to improve the image spatial resolution, as a sharp image is much easier for target detection and for humans to perceive. The process is also called pansharpening since a high-resolution panchromatic image is used to enhance the high-resolution of a multispectral image. To a certain extent, a pansharpening of hyperspectral images is an extension of pansharpening multispectral images. However, this term is not suitable anymore when the source data is not a single-band panchromatic image, but rather consists of a set of bands. Selva et al. (2015) defined a new paradigm hyper-sharpening because multispectral or hyperspectral images could be used instead of panchromatic images as source data to improve low spatial resolution.
Even though it is not clear yet which number of bands should be set to distinguish between multispectral images and hyperspectral images, this paper targets images with hundreds of bands, which clearly belong to the hyperspectral category. Other than many bands, a hyperspectral image typically has continuous bands and very small bandwidths. This makes it possible to derive reflectance curves for each pixel, which provide the fundamental information for estimating the physical properties of the substance (Ben-Dor et al., 2013). As the application of hyperspectral images is increasing, many have implemented pansharpening algorithms to hyperspectral images (Cetin and Musaoglu, 2009; Gomez et al., 2001; Zhang et al., 2013). This paper focuses on the application of Ehlers fusion to hyperspectral images. Ehlers fusion results in outstanding pansharpen outcomes to multispectral images (Ehlers et al., 2010), but its performance in hyperspectral images has not been studied yet.
The fusion procedure combines two steps of processing. Firstly, the multispectral image is transformed into an intensity, hue, and saturation (IHS) space, then the intensity component is further transformed into a frequency domain by using a Fast Fourier transform (FFT). Later, the Intensity component is low-pass
* Corresponding author
filtered while the pan image is high-pass filtered. The ideal way is to remove the high frequency part from the intensity component and replace it with the high frequency part from the pan image. At the end, the new intensity component together with the original hue and saturation are transformed back to Red Green and Blue (RGB) space (Klonus and Ehlers, 2007). This algorithm needs to be adjusted to fuse hyperspectral images. The procedure will be illustrated in section 4 in detail. Briefly, it involves two aspects: filtering in the frequency domain and intensity transform. This study analyses and modifies each aspect separately, aiming at an optimised hyperspectral image sharpening technique.
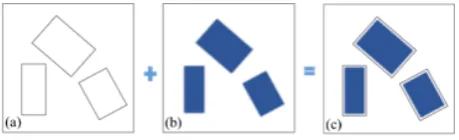
2. FILTERING IN THE FREQUENCY DOMAIN Image filtering in the frequency domain has been widely used in image processing, such as image smoothing, reducing periodic noise, and image sharpening (Gonzalez and Woods, 2007). In the pansharpening context, the goal of using a Fourier transform is to extract spatial information such as lines and edges from source images (high spatial resolution) and then integrate them into the target image (low spatial resolution). At the same time, the spectral information (colour) of the target image should be minimally changed. In this way, it reaches the ideal pansharpening goal. This can be illustrated by figure 1.
Figure 1. Ideal spatial enhancement procedure. (a) is the source image for spatial information input. (b) is the target image whose spectral information should be preserved. (c) represents
The Fourier transform separates an image into its various frequency components, of which high frequencies represent the edges or lines of the image. Therefore, a high frequency pass filter can be applied to extract high frequencies of an image. Basically, there are three typical high-pass filters in the frequency domain (Gonzalez and Woods, 2007):
0
n = order of the Butterworth filter H (u, v) = filter function
D (u, v) = distance between a point (u, v) in the frequency domain and the centre of the frequency rectangle
The more information is removed the larger the cut-off of the filter. Figure 2b and 2c show two ideal filters working on a 512 × 512 pixel grayscale image (Figure 2a). While a cut-off of 25 leaves sufficient image structures, a cut-off of 50 leaves much less information (Figure 2c and 2b). Besides the cut-off size, filter types also have different filtering effects on the image. Figures 2d, 2e, and 2f show that with a filter size of 100, Gaussian and Butterworth methods show a smoother filtered result than the
ideal filter. Figures 2d, 2e, and 2f were enhanced using equalisation, because the original images are like figure 2b, almost completely black and illegible. In general, ideal filtering has the disadvantage of introducing ringing artefacts and Gaussian filter may be considered to be the smoothest of all filters (Gonzalez and Woods, 2007).
Inspired by the fact that the cut-off size of high-pass filters affects the filtering results, a band-pass filter was also taken into consideration. A band-pass filter allows high frequencies within a determined range to pass through. Butterworth and Gaussian band filters can be realised by the multiplication of a high-pass filter and a low-pass filter (Equation 4), where the low-pass filter and high-pass filter can be transferred with equation 5.
( , ) ( , ) ( , )
The ideal band-pass filter is defined as equation 6 where D0 and D1 represent two frequency cut-offs.
0 1
Figure 2. Different high-pass effects. (a) is the original grayscale image (512 × 512 pixels). (b) is the ideal high-pass filtered image (cut-off size of 50). (c) is the ideal high-pass filtered image (cut-off size of 25). (d) is the Gaussian high-pass filtered image (cut-off size of 100) with further enhancement. (e) is the Butterworth high-pass filtered image (cut-off size of 100) with further enhancement.
In next step, three types of band-pass filters were applied to the image and the cut-off is between 100 and 150. From the test image, the parterre area with clear edges and vegetation coverage was inspected more closely. It has twelve concrete frames, the three times three frames in the middle are covered by vegetation (Figure 3a). As mentioned before, an ideal fusion algorithm should enhance edges without changing the spectral information in homogeneous areas (Ehlers et al., 2010). In this case study, the homogeneous region is represented by the vegetation area. From this point of view, the Gaussian band-pass filtered image is the perfect source image for resolution enhancement. Figure 3d shows that it preserves the edges of the parterre, while it generates no values for the inside vegetation area. Later, spectral information of the target image is preserved despite this input. Gaussian high pass filtered images do not have such clean inputs (Figure 3f) as it keeps structure in the vegetated area. Figure 3d and 3e show Ideal and Butterworth band-pass filter retains much more information in the vegetation area and the ringing artefacts from Ideal pass filter are even more obvious.
Figure 3. Different filters and their effects (with a closer look of the parterre area); (a) is a photo of the parterre area taken in the field; (b) is the original grayscale image; (c) is the ideal
band-pass filtered image (cut-off range from 100 to 150); (d) is the Gaussian band-pass filtered image (cut-off range from 100 to 150); (e) is the Butterworth band-pass filtered image (cut-off range from 100 to 150); (f) is the high-pass filtered image
(cut-off range size of 100)
3. INTENSITY TRANSFORM
IHS colour transform has been widely used in remote sensing image fusion. An RGB colour image is transformed into another set of three images: intensity, hue and saturation images. Among these three images, intensity captures the spatial information of the original colour image, while hue and saturation keep the spectral information (Pohl and van Genderen, 2017). Through this operation, the spatial and spectral information can be separated from each other. Furthermore, in IHS space, each component can be changed independently, without influencing each other (Ling et al., 2007). In conclusion, the transform makes it possible to enhance the spatial information without affecting spectral information. The original transformation operation was limited at the RGB three bands image, but this problem has been
solved by updated algorithms such as the generalized IHS (Tu et al., 2001) and modified IHS (Siddiqui, 2003). Ehlers fusion directly extends to more bands by using multiple IHS transformations until the number of bands is exhausted (Ehlers et al., 2010).
An alternative is the intensity transformation which is tailored for hyperspectral images. Padwick et al. (2010) provided a strategy to transfer N bands image into a single intensity component and N-1 angles on the hypersphere. The transform is between the native colour space and the hyperspectral colour space (HCS), based on the transform between n-dimensional Cartesian space and n-dimensional hyperspectral space.
2 2 2 native colour space, φn is the angles variables which define the colour or hue. The reverse transformation is:
1 cos 1
As with the IHS transform, once the image is transformed into HCS, the intensity can be modified without the changing spectral information. This study tested both intensity transformation methods. Results are illustrated in section 5.
4. OVERALL WORKFLOW OF SHARPENING HYPERSPECTRAL IMAGES
Figure 4. Overall workflow of sharpening hyperspectral images
In the sharpening procedure, the intensity transformation section has two options: IHS transformation or HCS transformation. No matter which option is taken, the intensity derived is then transformed into frequency domain by a fast Fourier transformation. Later, the high frequency component of the target image will be filtered out by a low-pass filter and replaced by the high frequency component from an image with higher resolution. The high frequency input from the source image is obtained through a high-pass filter or band-pass filter. Figure 5 shows the intensity enhancement procedure.
Figure 5. Intensity enhancement procedure (based on the flowchart from Klonus and Ehlers (2007)
5. EXPERIMENTS AND RESULTS
The hyperspectral image used in this study was obtained during a flight campaign carried out by the German Space Centre in 2003 over the city of Osnabrueck. The data was collected with the HyMap airborne hyperspectral scanner and recorded as 3 m pixel size raster images with 126 bands. It has a bandwidth of approximately 16 nm and covers the wavelength between 400 nm and 2500 nm. After atmospheric and geometric correction, a study area near the Castle of Osnabrueck was selected. It was chosen due to its mixture of buildings and vegetation. The sharpness of the edges of the buildings represents the spatial resolution whereas the colour of the homogeneous vegetation indicates the spectral preservation. The high-resolution image is an aerial photo produced by the Local Earth Observation system developed at the Bochum University of Applied Sciences (Bäumker and Heimes, 2001). It has red, green, and blue bands and has been ortho-rectified. The spatial resolution is 0.5 m.
In this study, both the red band alone and spectral average of the three bands were taken to replace the role of pan image. Interestingly, if the aerial photo is also transformed into IHS space with the most commonly used transformation methods, the intensity will be (Al-Wassai et al., 2011):
3
R G B
I = + + (15)
This means that the pan band is replaced by the intensity component of the RGB image. The test in this section was conducted in MATLAB R2016a and results displayed with the software ENVI 5.1. Firstly, the intensity of the aerial photo working as the pan image was tested. The hyperspectral image was transformed between colour and IHS space. Additionally, a Gaussian band-pass filter was applied to the frequency spectrum. The result (Figure 6a) shows excellent spatial improvement but disappointing colour distortion, especially in the building area. As of now, the cause of the colour distortion has not been determined. Therefore, the same procedure was tested with a high-pass filter. Visually, the result (Figure 6b) shows much less colour distortion, suggesting that the cause was the band-pass filter used. The procedure was repeated with the red band of the aerial photo as source data. The result shows colour distortion when band-pass filter used (Figure 6c) but no colour distortion with high-pass filter (Figure 6d). It could be ascertained that in this study, the band-pass filter has weak colour preservation performance.
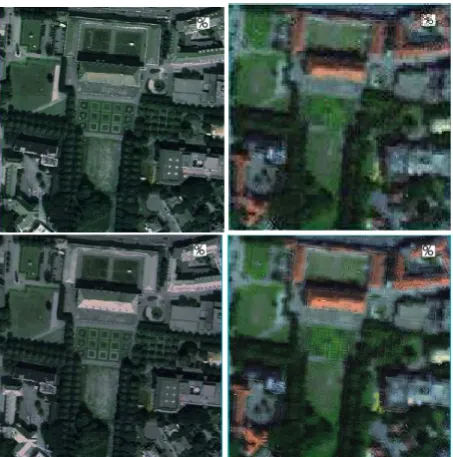
Figure 6. Ehlers hyperspectral image sharpen results from (a) spectral average of aerial photo as pan and band-pass filter with
cut-off ranges from 100 to 150; (b) spectral average of aerial photo as pan and high-pass filter with cut-off range of 100; (c) red band of aerial photo as pan and band-pass filter with cut-off
range from 100 to 150; (d) red band of aerial photo as pan and high-pass filter with a cut-off range of 100.
Figure 7. Quality control of fused images (Figure 6a and 6b) using spectral profile of selected pixels of (a) vegetation area
As in the case of application to hyperspectral images, reflectance curves of pixels are crucial. Here, the quality control is done by comparing the spectral profile of pixels between the original and fused images. Spectral profile plots the spectrum of all bands for the selected pixel. Figure 7 shows spectral profiles produced from fused images, with the grey curve derived from the original image, the black line from the high-pass filtered image and the blue line from band-pass filtered image. In both cases, spectral average of the aerial photo was taken as the pan substitute and an IHS transform was performed. Once again, the spectral information changed dramatically when the band-pass filter was applied. Even though the high-pass filter shows better results by visual evaluation, the spectral profiles illustrate disagreement between the original image and the fused image in the building area. In the vegetation area, high-pass filter shows better performance in preserving spectral information.
Figure 8. Quality control of fused images (IHS transform and HCS transform) using spectral profile of selected pixels of (a)
vegetation area and (b) buildings
Later, the HCS method is used for intensity transformation. By visual inspection, one difference can be seen when comparing them with results from IHS transformation. Thus, the fused image is not necessarily shown here. It is sufficient to present the
spectral profile of the results. The spectral curve proves these two intensity transformations have influenced the fusion results in the same way.
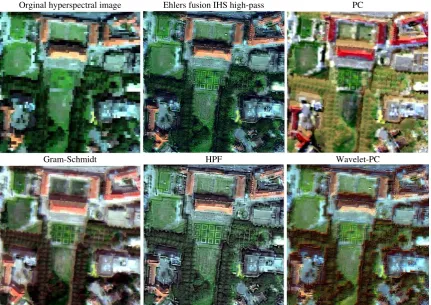
6. COMPARISON WITH OTHER FUSION METHODS To give an impression of the other fusion methods working on the same dataset, the following algorithms were also tested: Principle Component (PC) analysis, Gram-Schmidt transform (Gram-Schmidt), High-Pass Filtering in the spatial domain (HPF), and Wavelet Principal Component (Wavelet-PC) analysis. As these methods were developed for pansharpening multispectral images, a pan image is needed. The benefit of using a pan image is that it often covers the spectral range of the multispectral image. It contains essentially the same spatial information as the multispectral image. However, the spectral range of hyperspectral images is broader than that of pan images. That means that if there is a structure in bands which are out of the pan spectral span, it cannot be sharpened. Here, there is no larger difference if the pan image is taken or another band is taken. Since there is no pan image available in this study, for all algorithms both the red band and an averaged RGB image were tested. The test was done with software packages ERDAS IMAGINE 2014 and ENVI 5.1. The results show no big difference if the red band or the averaged RGB image was used as source data. Here, the outcome from the latter case are presented as an example. From visual inpection, figure 9 show that PC and Gram-Schmidt methods produce obvious colour distortion. Wavelet-PC produces no significant spatial improvement yet colour mismatch, and obvious artefacts. Ehlers fusion and HPF produce spatial enhancement and colour preservation, while Ehlers also results in better colour preservation.
Orginal hyperspectral image Ehlers fusion IHS high-pass PC
Gram-Schmidt HPF Wavelet-PC
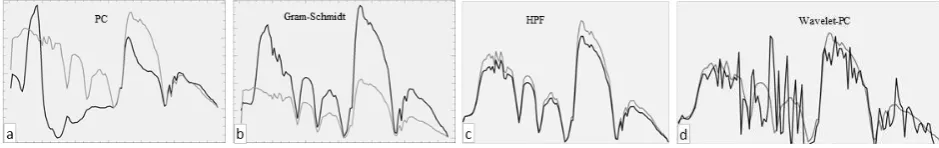
Figure 10. Quality control using spectral profile of a selected pixel of vegetation area. Grey line is from original image and black lines are from (a) PC, (b) Gram-Schmidt, (c) HPF and (d) wavelet-PC sharpened images
Figure 11. Quality control using spectral profile of a selected pixel of building area. Grey line is from original image and black lines are from (a) PC, (b) Gram-Schmidt, (c) HPF and (d) wavelet-PC sharpened images
Quality assessment is also done by comparing the spectral profiles of sharpened images with the original hyperspectral images. The outcome from Ehlers fusion is already presented in section 5, thus it is not repeated here. Figure 10 shows in the case that the spectral profiles of a pixel from vegetation area, all algorithms more or less preserve the spectral information of the orginal hypersectral image. However, when a pixel is taken from the building area, the spectral profiles vary dramatically. All of the methods have changed the original different spectral information. PC and Wavelet methods produced the biggest deviation from original image. The results from Ehlers fusion and HPF show relatively small variation.
The Ehlers fusion in ERDAS uses IHS transformation and pass filter. The results here show small differences with the high-pass result from the section 5 because results were displayed in different software environments (that requires different formats).
7. CONCLUSION AND DISCUSSION
In brief, this study first tested different high-pass filter techniques towards an ideal input for spatial enhancement of hyperspectral images. In the parterres area, Gaussian band-pass filtered images generated no value in the vegetation area but kept the fringes’ information. Thus, this filter was taken as the first choice for a data test. However, the fused image shows colour distortion in the building area. Therefore, Gaussian high-pass was then also implemented in the fusion process. The outcomes highlight that the band-pass filter produced excellent spatial improvement but worse spectral preservation than the high-pass filter. Meanwhile, two intensity transform techniques were also tested. In summary, the whole test procedure can be described as a combination of two filter types and two intensity transform approaches. The results show that IHS transformation has no better spectral information preservation than HCS.
It is still uncertain why the band-pass filter caused colour distortion. One possible explanation is because the band-pass filter in this study was obtained by multiplying a high-pass filter with a low pass-filter. Gonzalez and Woods(2007) provided other methods to apply band-pass filters which could be further tested. The quality control was not only done by visual evaluation, but also by comparison with the original spectral profile of pixels from vegetation and building areas. Since each spectral profile is produced from one pixel of the selected land cover type (such as
vegetation), it cannot represent the complete information of this land cover type within the entire image. In the future, land cover classification results of fused image can be further tested for quality control.
Several other fusion algorithms were also investigated with the same datasets. Among those test results, Wavelet-PC showed the lowest performance. This also agrees with the conclusion of other researchers such as Cetin and Musaoglu (2009). PC and Gram-Schmidt showed colour disagreement. This could be due to the fact that the red band or averaged RGB image was used as the pan image. HPF and Ehlers high-pass filter fusion showed outstanding performance both on spatial enhancement and – especially the latter – on colour preservation.
ACKNOWLEDGEMENTS
We would like to express our appreciation to Dr.-Ing. Christine Pohl for her valuable and constructive feedback and the suggestions for this paper.
REFERENCES
Al-Wassai, F.A., Kalyankar, N. V, Al-Zuky, A.A., 2011. The IHS Transformations Based Image Fusion. Int. J. Adv. Res. Comput. Sci. 2, 70–77.
Bäumker, M., Heimes, F.J., 2001. New Calibration and Computing Method for Direct Georeferencing of Image and Scanner Data Using the Position and Angular Data of an Hybrid Inertial Navigation System, in: OEEPE Workshop, Integrated Sensor Orientation. pp. 1–17.
Ben-Dor, E., Schläpfer, D., Plaza, A.J., Malthus, T., 2013. Hyperspectral Remote Sensing, in: Airborne Measurements for Environmental Research. Wiley-VCH, Weinheim, pp. 413–456. doi:10.1002/9783527653218.ch8
Ehlers, M., Klonus, S., Johan Åstrand, P., Rosso, P., 2010. Multi-sensor image fusion for pansharpening in remote sensing. Int. J. Image Data Fusion 1, 25–45. doi:10.1080/19479830903561985
Gomez, R.B., Jazaeri, A., Kafatos, M., 2001. Wavelet-based hyperspectral and multispectral image fusion Richard, in: Roper, W.E. (Ed.), Aerospace/Defense Sensing, Simulation, and Controls. International Society for Optics and Photonics, pp. 36–42. doi:10.1117/12.428249
Gonzalez, R.C., Woods, R.E., 2007. Digital Image Processing, 3rd ed. Prentice Hall International, Upper Saddle River, NJ.
Klonus, S., Ehlers, M., 2007. Image Fusion Using the Ehlers Spectral Characteristics Preservation Algorithm. GIScience Remote Sens. 44, 93–116. doi:10.2747/1548-1603.44.2.93
Ling, Y., Ehlers, M., Usery, E.L., Madden, M., 2007. FFT-enhanced IHS transform method for fusing high-resolution satellite images. ISPRS J. Photogramm. Remote Sens. 61, 381–392. doi:10.1016/j.isprsjprs.2006.11.002
Padwick, C., Scientist, P., Deskevich, M., Pacifici, F., Smallwood, S., 2010. WorldView-2 Pan-Sharpening, in: ASPRS 2010 Annual Conference. San Diego, CA, pp. 26– 30.
Pohl, C., van Genderen, J., 2017. Remote Sensing Image Fusion: A Practical Guide. CRC Press, Boca Raton.
Selva, M., Aiazzi, B., Butera, F., Chiarantini, L., Baronti, S., 2015. Hyper-sharpening: A First Approach on SIM-GA Data. IEEE J. Sel. Top. Appl. Earth Obs. Remote Sens. 8, 3008–3024. doi:10.1109/JSTARS.2015.2440092
Siddiqui, Y., 2003. The modified IHS method for fusing satellite imagery, in: ASPRS 2003 Annual Conference Proceedings. Anchorage, AK, pp. 5–9.
Tu, T.-M., Su, S.-C., Shyu, H.-C., Huang, P.S., 2001. A new look at IHS-like image fusion methods. Inf. Fusion 2, 177–186. doi:10.1016/S1566-2535(01)00036-7
Zhang, Z., Shi, Z., An, Z., 2013. Hyperspectral and panchromatic image fusion using unmixing-based constrained nonnegative matrix factorization. Opt. - Int. J. Light Electron Opt. 124, 1601–1608. doi:10.1016/j.ijleo.2012.04.022