R. Li a,b*, X. Ma a,b,Y. Cheng a,b, W. Ye a,b, S. Guo a,b, G. Tang a,b, Z. Wang a,b, T Gao a,b, Y. Huang a,b, X. Li a,b , G. Qiao a,b,*, Y. Tian a,b, T. Feng a,b, X. Tong a,b
a College of Surveying and Geo-Informatics, Tongji University, 1239 Siping Road, Shanghai, China
b Center for Spatial Information Science and Sustainable Development, Tongji University, 1239 Siping Road, Shanghai, China
Commission III, WG III/9
KEY WORDS: Ice velocity, East Antarctica, ARGON, Landsat
ABSTRACT:
Ice flow velocity is a vital parameter for estimating the ice mass balance of glaciers in Antarctica. Especially long time serial observation of the surface velocity is of great significance to assessing the relationship between Antarctic ice materials and global climate change. However, the existing research on Antarctic ice velocity based on remote sensing data since 1970s due to the harsh climate in Antarctica. This paper presents an ice flow velocity estimating method includes image pre-processing, geometric model reconstruction, image ortho-rectification and feature matching by using ARGON images token in 1963 and Landsat images collected form 1973 to 1989.Considering the temporal-spatial distributions of ARGON images and Landsat images in Antarctica, two different methods respectively based on ortho-photos pair and Non-Ortho photos are adopted in this paper. More specifically, when there exist two stereo pairs taken in different time in the glacier region, after being ortho-rectified, the stereo pairs can be used to calculate ice flow velocity based on feature matching method. Otherwise, a parallax decomposition method that separates the effect of the terrain relief from the ice flow motion is applied when there only exists one stereo pair with a certain time interval. With this method, glacier surface velocity is available in the glacier region lacked enough stereo pairs. The methods mentioned above for estimating ice flow velocity are applied in Totten, Amery and Fimbul, etc. in eastern Antarctica. Furthermore, a 1960-80s ice flow speed map in the main glaciers of East Antarctica is produced for the first time.
1. INTRODUCTION
Ice flow velocity and its variation is important feature of glaciers and is a vital parameter in assessing the balance of Antarctic ice sheets, which can use to study the ice flux and ice shelf stability of Antarctic glaciers (Rignot et al., 2011). Moreover, the long time serial reconstruction of the ice flow field is helpful for the quantitative assessment and accurate prediction of sea level change caused by global climate change, which is critical to the study of the interaction between Antarctic ice sheets and global climate changing. There are two types’ methods of Antarctic ice velocity monitoring: the ground survey method and the remote sensing method. The ground survey method is the earliest method that used in the Antarctica, which measures the ice flow velocity mainly through snow stakes and GPS (Mellor, 1964; Dorrer et al., 1969; Swithinbank, 1969). The ground survey method using snow stakes and the GPS is the easiest way to measure the ice flow rate in the Antarctic, and long-term data is available through perennial measurements. Although this method is of high accuracy, ice flow measurement is constrained within small areas because of the harsh environment and the limited observation stations. Compared with field measurements, remote sensing method with high spatial resolution can carry out large-scale observation and measurement.
At present, there are two kinds of remote sensing methods for Antarctic ice flow velocity measurement, one is Interferometric Synthetic Aperture Radar (InSAR) technology (Goldstein et al., 1993), the other is the optical remote sensing images based feature tracking technique (Scambos et al., 1992). The InSAR method can use to probe the glacier flow velocity owing to its
interference coherence characteristics. This method was adopted by Richard et al. for the first time to detect the velocity in Rutford glacier using SAR images with a sampling interval of several days, and reached the level of accuracy and the accuracy of the vertical 4mm 1.5mm, and reached a vertical accuracy of 1.5 mm and a horizontal accuracy of 4 mm (Goldstein et al., 1993).
What’s more, the entire Antarctic ice flow map for the period from 2007-2009 was first produced by Rignot et al. using a large amount of synthetic aperture radar (SAR) images. The optical remote sensing images based feature tracking technique refers to a way to determine the corresponding points between two accurate geographical located images taken in different time. Thus, the velocity of the whole glaciers can be generated by measuring the distance between these corresponding points. The mentioned matching method can speed up by using Fourier transform in frequency domain (Scambos et al., 1992), or matching directly base on phase in the frequency domain (Reddy et al., 1996). Liu et al. introduced the idea of photogrammetry into the measurement of ice flow velocity, established a pyramid and triangulation of glacier images, further improved the matching accuracy and proposed a set of ideas about the image processing and the elimination of mismatches (Liu et al., 2012). The remote sensing method can effectively overcome the harsh environment of Antarctica and can carry out large-scale, long-term monitoring of the surface flow rate, but it is limited on high precision. Nevertheless, the remote sensing method mainly shows up in 1970s. Such as InSAR, compared to the optical satellite image, has high spatial resolution and could work around clock, but mainly shows up after 1990. Therefore, the time span of the existing data of ice flow rate is still relatively short, so it is
ICE VELOCITY MEASUREMENT IN EAST ANTARCTICA F
R
OM 1960s TO 1980s
BASED ON ARGON AND LANDSAT IMAGERY
very difficult to study and analysis the variation of the Antarctic ice shelves on a long time series. Another source of remote sensing data is the early satellite images recorded on films collected by the film-based satellites like ARGON. The declassification of Declassified Intelligence Satellite Photographs (DISP) includes CORONA, ARGON, LANYARD (Ruffer, 1995) made it possible to study the Antarctic ice shelves in 1960s. Compared to the recent images, those images are more difficult and challenging to deal with due to the poor data quality, large deformation, huge coverage and incomplete parameters, which create difficulties for the further research and application in Antarctica. The ARGON images as well as the recently remote sensing data (AVHRR, SPOT and SAR images) were used to detect the change of Antarctic ice flow over the past decades by Bindschadler, Vornberge (Bindschadler and Vornberge, 1998) and Jezek(Jezek et al., 1998). Zhou et al. proposed the method of bundle adjustment based on the unknown internal orientation, external orientation and lens distortion parameters, subsequently geo-positioned of the ARGON image of Greenland and ortho-rectified the images of 1962 and 1963 respectively (Zhou et al., 2002). Kim et al. used the method of spatial resection to geo-locate the ARGON image of Queen Maud Land precisely, then discussed the difference in this ice shelf between the 1963 ARGON image the 1997 RADARSAT-1 image (Kim et al., 2001). Kim and Jezek et al. used the ARGON images covering 62 scenes of the Antarctica to produce a mosaic of the entire Antarctic and extracted the coastline (Kim et al., 2007). Wang et al. used the control points acquired by WorldView images to geo-locate the Argon images at the Larsen ice shelf in the Antarctic Peninsula and measured the ice flow velocity for 1960s to 1970s (Wang et al., 2016).
As mentioned above, no existing Antarctic ice velocity maps are derived based on ARGON images and Landsat images from 1960s to 1980s, although such information is significant for the study on the response of Antarctic ice sheet to global climate. Therefore, this study using parallax decomposition technique through rigorous geometric positioning based on the history of the satellite image data such as 1960s ARGON images and Landsat images from 1970s to 1980s to acquire the Antarctic ice velocity from 1960s to 1980s, which can extend the time span of Antarctic ice flow to 1960s.
2. THREE METHODS FOR ICE FLOW SPEED ESTIMATION
2.1 Parallax-Decomposition-Based Hierarchically Image Matching
Parallax-decomposition-based hierarchically image matching method is suitable for film-based stereo ARGON images in Antarctic. The quality of ARGON image is relatively low and the image has many distortions, including lens distortion, atmospheric refraction, and earth curvature. The pre-processing of ARGON image involves denosing and image enhancement. The noise of ARGON image contained random speckle noise result from the degradation of chemical substances on the long-term film. In addition, the noises also had aperiodic stripes and scratches introduced by long-term conservation, and Newton’s rings emerged in the image caused during the scanning process (Lu et al., 2013). Some denoising methods were implemented to eliminate these noises (Ye et al., 2016). Furthermore, mean smoothing filter and an adaptive histogram equalization were used to enhance the ARGON image.
(EO) information. The IO parameters are determined by using Semi-automatic Recognition of Fiducial marks and second-order polynomial projection. And the initial value of EO parameters can be estimated through the Lagrange polynomial interpolation. The accurate EO parameters of the stereo ARGON images were implemented via Bundle Adjustment with LPS software (Leica Photogrammetric Suite, ERDAS IMAGINE by Intergraph).Then, several accurate and well-distributed tie points were selected in Bundle adjustment process and used to get the epipolar images through fundamental matrix with random-sample consensus algorithm (Hartley and Zisserman, 2003). The goal of epipolar image is to reduce search time in matching process. Considering the characteristics of different parallaxes for stereo images in two periods, the parallax decomposition was performed in ice flow field. After this process, the speed map and DTM were generated, respectively. The flow of processing includes hierarchically image matching through the top to the bottom level of the image pyramids, the matching process using normalized cross correlation (NCC) and triangulated irregular network (TIN) constraints, determination of the ice flow direction , parallax decomposition and estimation of the ice flow speed (Li et al., 2011; Li et al., 2016; Li et al., 2017).
2.2 Grid-Based NCC Image Matching
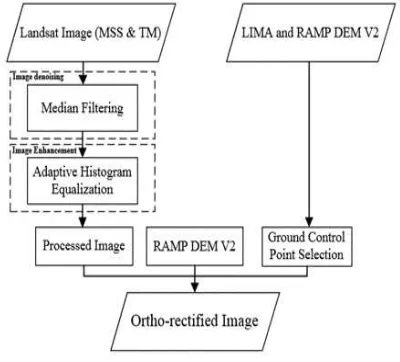
Grid-Based NCC image matching is fit for visible image used to derive ice velocity, such as Landsat 4/5 stereo image pairs. Due to the early Landsat images were not ortho-rectified, they were
orthorectified using the Toutin’s model (Toutin, 2004) in the
commercial software PCI, as shown in Figure 1. The overall matching details involve generating grid point-pairs (shift the mesh if prior), searching the candidates correspondence within a search window based on NCC constraints, finding the correspondences and computing the motion vector.
Figure 1. Flowchart of the proposed Landsat image orthorectification
2.3 Feature and Grid-Based Image Matching with Constraints
crevasses is a deep crack, found in an ice shelf or glacier, which is associated with shear stress generated. The correspondences should be selected on both sides of the crevasses, which could improve the accuracy of the correspondences. The ice-shelf front is generated owing to relatively fast at the bottom. And the selection of these correspondences should be in the middle of the edge or at each end of the ice-shelf front. The most difficult correspondences are in the longitudinal linear surface structures. Due to the direction is the same as the ice flow direction, they should be selected in broken or distinct texture in the longitudinal linear surface structures with the absence of reference. These three types of manually seed points selection and measurement are shown in Figure 2.
Figure 2. Example of manually seeds points selection and measurement. (a) and (b) are correspondences in crevasses from
1975 and 1988, (c) and (d) are correspondences in ice-shelf front from 1988 and 1989, (e) and (f) are correspondences in
longitudinal linear surface structures from 1973 and 1975.
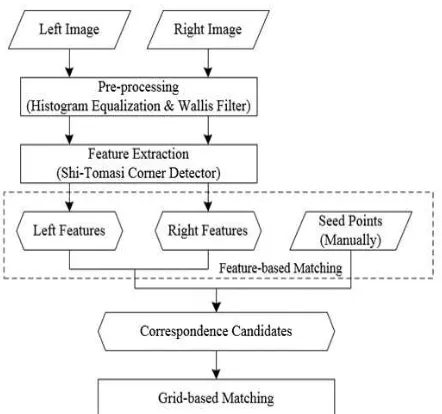
This matching method was carried out as described in the framework in Figure 3. Firstly, the preprocessing of the stereo ortho-images reduced noise and enhanced the ice flow surface texture using histogram equalization and Wallis filter. Secondly, the feature points extraction were detected by the Shi-Tomasi corner detector (Shi, 1994). And these correspondence candidates including manually seed points were matched by the NCC technique and TIN constraints. Finally, a dense matching step was performed by using NCC matching technique to build a speed map.
Figure 3. Flowchart of Feature and Grid-Based Image Matching with Constraints
3. DATA AND EXPERIMENTS
The Antarctic ice sheet was drained by systems including an area of slow sheet flow that converged into some relatively fast valley glacier or some special ice stream (Stephenson and Bindschadler, 1994). On arriving at the coast, these ice flowed to ice shelf limited by embayment and ice rise or calved off into the ocean. The study area are major glaciers in East Antarctica, including Amery, Totten, Rayner and Fimbul etc. The data sources are ARGON images and Landsat-1,2,3,4,5 images, respectively (Table 1). The spatial resolution of Landsat-1,2,3 image was approximately 79 m, but in the practical application, it resampled to 60 m (Northrop and Team L S, 2015).
Sensor Launched Terminated Resolution(m)
ARGON 2/17/1961 9/20/1964 140
Landsat-1 6/23/1972 1/6/1978 79 Landsat-2 1/22/1975 2/25/1982 79 Landsat-3 3/5/1975 3/31/1983 79 Landsat-4 7/16/1982 12/14/1993 30 Landsat-5 3/1/1984 6/5/2013 30 Table 1. Data sources in the study area
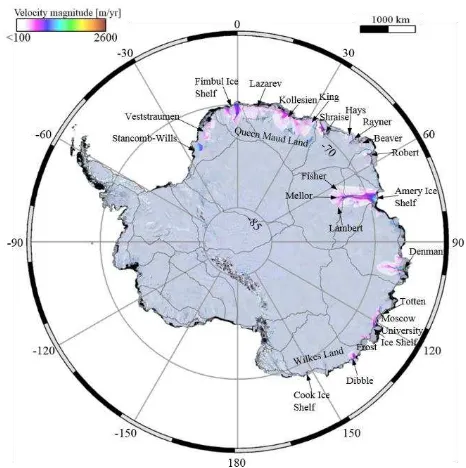
Figure 4. East Antarctic speed map from ARGON and Landsat-1,2,3,4,5 images, and overlaid on a improved Landsat Image
Mosaic of Antarctica (Hui, et.al, 2013)
4. CONCLUSION AND FUTURE WORK In this paper, three matching methods are proposed for building the ice flow speed map in East Antarctica for the first time. The research results support the following conclusions: (1) ice flow speed map in the main glaciers of East Antarctic from 1963 to 1980s is produced for the first time, including Totten, Amery, Fimbul, Rayner, etc. (2) Landsat images from 1970s to 1980s are well processed geometrically. A novel method is proposed to recover the camera poses of ARGON images and achieve a desired accuracy. Both satisfy the requirement for further ice velocity mapping. (3) Three methods for estimating ice velocity of Antarctic ice-sheets are adopted to cope with various image configurations and the ice flow speed maps are generated with relatively high accuracy. (4) Compared with recently Antarctic ice flow speed products, the ice flow pattern looks similar, but some speed changes in some local areas exist.
Further work will focus on the analysis of surface ice velocity changes (mass balance changes) as well as the interaction with the oceans and ice-sheets.
ACKNOWLEDGEMENTS
This work has been supported by National Key Basic Research Program of China (No. 2012CB957701).
REFERENCES
Bindschadler, R., & Vornberger, P. (1998). Changes in the West Antarctic ice sheet since 1963 from declassified satellite photography. Science, 279(5351), 689-692.
Dorrer, E., Hofmann, W., & Seufert, W. (1969). Geodetic Results of the Ross Ice Shelf Survey Expeditions, 1962-63 and 1965-66. Journal of Glaciology, 8(52), 67-90.
Goldstein, R. M., Engelhardt, H., Kamb, B., & Frolich, R. M. (1993). Satellite radar interferometry for monitoring ice-sheet motion: Application to an Antarctic ice stream.
Hui, F. M., Cheng, X., Liu, Y., Zhang, Y. M., Yufang, Y. E., & Wang, X. W., et al. (2013). An improved landsat image mosaic of antarctica. Science China Earth Sciences, 56(1), 1-12. Jezek, K. C., Sohn, H. G., & Noltimier, K. F. (1998, July). The RADARSAT Antarctic mapping project. In Geoscience and Remote Sensing Symposium Proceedings, 1998. IGARSS'98. 1998 IEEE International (Vol. 5, pp. 2462-2464). IEEE. Kim, K. T., Jezek, K. C., & Sohn, H. G. (2001). Ice shelf advance and retreat rates along the coast of Queen Maud Land, Antarctica. Journal of geophysical research, 106(C4), 7097-7106.
Kim, K., Jezek, K. C., & Liu, H. (2007). Orthorectified image mosaic of Antarctica from 1963 Argon satellite photography: image processing and glaciological applications. International Journal of Remote Sensing, 28(23), 5357-5373.
Liu, H., Wang, L., Tang, S. J., & Jezek, K. C. (2012). Robust multi-scale image matching for deriving ice surface velocity field from sequential satellite images. International journal of remote sensing, 33(6), 1799-1822.
Lu, M. F., Ni, G. Q., Bai, T. Z., Tao, R., & Zhang, F. (2013).
Method for suppressing the quantization error of Newton’s rings
fringe pattern. Optical Engineering, 52(10), 103105-103105. Li, R., Hwangbo, J., Chen, Y., & Di, K. (2011). Rigorous photogrammetric processing of HiRISE stereo imagery for Mars topographic mapping. IEEE Transactions on Geoscience and Remote Sensing, 49(7), 2558-2572.
Li, R., Ye, W., Kong, F., Qiao, G., Tong, X., & Ma, X., et al. (2016). A novel method for estimation of glacier surface motion in 1960s from argon kh-5 optical imagery. ISPRS - International Archives of the Photogrammetry, Remote Sensing and Spatial Information Sciences, XLI-B8, 521-524.
Li, R., Ye, W., Qiao, G., Tong, X., Liu, S., Kong, F., & Ma, X. (2017). A New Analytical Method for Estimating Antarctic Ice Flow in the 1960s From Historical Optical Satellite Imagery. IEEE Transactions on Geoscience and Remote Sensing, 55(5), 2771-2785.
Hartley, R., & Zisserman, A. (2003). Multiple view geometry in computer vision. Cambridge university press.
Mellor, M. (1964). Antarctic snow and ice studies (Vol. 2). American Geophysical Union.
Northrop, A., & Team, L. S. (2015). IDEAS–LANDSAT Products Description Document. United Kingdom: Telespazio VEGA UK Ltd.
Rignot, E., Mouginot, J., & Scheuchl, B. (2011). Ice flow of the Antarctic ice sheet. Science, 333(6048), 1427-1430.
Swithinbank, C. (1970). Ice movement in the mcmurdo sound area of antarctica.
Scambos, T. A., Dutkiewicz, M. J., Wilson, J. C., & Bindschadler, R. A. (1992). Application of image cross-correlation to the measurement of glacier velocity using satellite image data. Remote sensing of environment, 42(3), 177-186.
Shi, J. (1994, June). Good features to track. In Computer Vision and Pattern Recognition, 1994. Proceedings CVPR'94., 1994 IEEE Computer Society Conference on (pp. 593-600). IEEE. Stephenson, S. N., & Bindschadler, R. A. (1988). Observed velocity fluctuations on a major Antarctic ice stream. Nature, 334(6184), 695-697.
Toutin, T. (2004). Review article: Geometric processing of remote sensing images: models, algorithms and methods. International journal of remote sensing, 25(10), 1893-1924. Wang, S., Liu, H., Yu, B., Zhou, G., & Cheng, X. (2016). Revealing the early ice flow patterns with historical Declassified Intelligence Satellite Photographs back to 1960s. Geophysical Research Letters, 43(11), 5758-5767.
Ye, W., Qiao, G., Kong, F., Guo, S., Ma, X., Tong, X., & Li, R. (2016). RIGOROUS GEOMETRIC MODELLING OF 1960s ARGON SATELLITE IMAGES FOR ANTARCTIC ICE SHEET STEREO MAPPING. ISPRS Annals of Photogrammetry, Remote Sensing & Spatial Information Sciences, 3(3).