THE RELATIVE IMPORTANCE OF THREE SPECIFIC CLIMATIC FACTORS ON
NORTH AMERICAN BREEDING BIRD SPECIES RICHNESS
Mengdan Zhang a, Yi Lin a, * a
Institute of Remote Sensing and GIS, School of Earth and Space Sciences, Peking University, Beijing 100871, China
Commission IV, WG IV/3
KEY WORDS:Breeding bird species, bird richness, climatic influence, precipitation, vapour pressure, potential evapotranspiration
ABSTRACT:
Understanding of the relationships between bird species and environment facilitates protecting avian biodiversity and maintaining nature sustaining. However, the effects of many climatic factors on bird richness have not been fully grasped. To fill this gap, this study investigated the relationships between the richness of three typical North American breeding bird species and three climatic factors at the monthly scale. Based on the North American Breeding Bird Survey (BBS) data during 1967-2014, the relationships between the numbers of Carolina wren, Cerulean warbler, and Red-bellied woodpecker and the three climatic factors of precipitation, vapor pressure, and potential evapotranspiration were examined using the method of Pearson linear regression analysis. The results indicated that the three climatic factors have correlations with the richness of the breeding bird species but in different modes, e.g., strong correlations for the non-migratory species but weak correlations for the migratory species.
*
Email:yi.lin@pku.edu.cn
1. INTRODUCTION
Understanding of the interactions between various bird species and their environments is increasingly highlighted (e.g., Sauer et al., 1994; Link and Sauer, 1998; Bled et al., 2013; Goetz et al., 2014), especially in the context of global change. The relevant studies have been conducted in many fields concerning avian ecology, since the scientific inferences facilitate enhancing many studies and managements, e.g., guiding more effective policy-making for biodiversity conservation (Bellard et al., 2012).
The relative importance of different environmental variables in predicting bird species richness has been long investigated (e.g., Cueto and Casenave, 1999; Seoane et al., 2004; Coops et al., 2009; Hansen et al., 2011; Fitterer et al., 2012). Now, progress in remote sensing and ecological modelling can support a timely and robust analysis of more complicated ecological variables, such as 3D habitat structures that underlie large-scale patterns of breeding bird species richness (e.g., Bled et al., 2013; Goetz et al., 2014). However, the effects of the hydrology-typed climatic factors like precipitation, evapotranspiration and vapor pressure on bird species richness have not been fully examined.
In addition, the previous studies focusing on the interactions of bird species richness and environmental factors were generally conducted at the annual scales (Scott et al., 1994; Florent et al., 2013). This temporal scale cannot characterize the changes of the richness of different bird species along seasons. Thereby, the mechanisms underlying the influence and response between bird species richness and climatic factors at finer temporal scales have been unclear yet, particularly at the continental scales.
To address these gaps, this study investigated the relationships between the richness of different bird species and the values of different hydrology-typed climatic factors, which were compiled at the monthly scales both. The optimal relationship determined
for each bird species can reveal the dependence of that species to the related climatic factor.
2. MATERIALS AND METHODS
2.1 Study Area
The study area was located in the North American continent, briefly in U.S.A. as shown in Figure 1. The mainland of U.S.A. features a huge diversity of bird species and varying climate. Stretching from the East Coast to the eastern North Dakota, further down to Kansas, is the continental-humid climate that features four distinctive seasons and a large amount of annual precipitation, with places like New York City reaching about 50 inches on average. Starting at the southern border of the continental-humid climate zone to the Gulf of Mexico shows a subtropical climate. This region has the wettest cities in the contiguous U.S.A. with annual precipitation reaching about 67 inches in Mobile, Alabama. Stretching from the borders of the continental humid and subtropical climates and going west to the Cascades Sierra Nevada, south to the tip of Durango, north to the border with tundra climate, the steppe/desert climate is the driest climate in the U.S.A. In consequence, so many kinds of climates may relate to different modes of bird distributions.
2.2 Data of Bird Observation
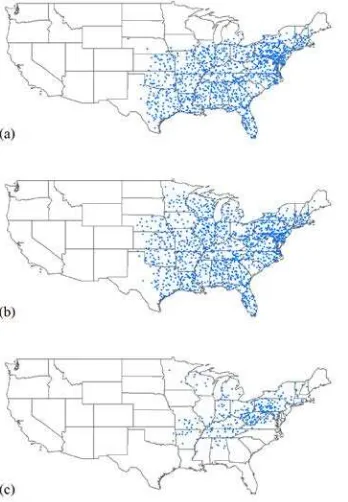
bird population data along the planned survey routes. Each survey route is 24.5 miles long with stops at 0.5 mile intervals. At each stop, a 3-minute bird counting was conducted. During the counting, every bird seen within a 0.25 mile radius or heard was recorded. Each survey started one-half hour before the local sunrise and lasted about 5 hours. Figure 1 illustrates the observation sites of the three bird species (2014) and each point is the start location of the related route. For each survey on a route, data collected include the number of stops on which the individuals and the total number of the individuals of a given species were detected. A variety of ancillary data such as the observer names and weather information were also recorded.
Figure 1. The maps illustrate the start locations of the survey routes (2014) for (a) Carolina wren, (b) Red-bellied woodpecker, and (c) Cerulean warbler.
In face of so high bird diversity, we conducted three case studies of Carolina wren, Cerulean warbler and Red-bellied woodpecker to investigate the relationships between bird species richness and climatic factors. We used the yearly summary data for each route from 1967 to 2014 as well as the synchronously recorded climatic variables. The total number of the survey routes is more than one hundred thousand and the number of the observed birds is more than nine hundred thousand. The statistics about the bird observations are listed in Table 1.
Species Habitat guild Routes Birds Carolina wren Open
woodland
48302 539803
Cerulean warbler Forest 14472 10157 Red-bellied
woodpecker
Forest 56766 380893
Table 1. Statistics of bird observations during 1967-2014. Habitat guilds were classified according to the rules of habitat type classifications proposed by the Cornell Lab of Ornithology.
2.3 Data of Climate Recording
The detailed climatic factors concerned in this study include precipitation (PRE, mm per month), vapor pressure (VAP, hectopascals (hPa)), and potential evapotranspiration (PET, mm per day), as illustrated in Figure 2 (2014). We used the datasets published by the Climatic Research Unit (CRU) (https://crudata.uea.ac.uk/), which has developed a series of data widely used in climate research. The CRU-distributed data were formatted into 0.5°×0.5° grids. The data related to the three climatic variables during 1966-2014 was acquired from the CRU website and used to analyse their influence on the richness of the three bird species.
Figure 2. Illustrations of the 0.5° rasterized maps showing the spatial distributions of the climatic factors (2014) for (a) PRE, (b) VAP, and (c) PET.
2.4 Data Preprocessing
The spatial resolution of the CRU data is 0.5°. For the purpose of conducting correlation analyses between bird richness and climatic factors, the data of bird observations was rastered into 0.5°×0.5°. The routes were projected into the geo-rasters, and the mean number of birds observed on all of the routes within one raster was assumed to represent the richness of that bird species in the related area. Some routes were not visited every year, and so, such routes were not considered in the following regression analysis.
2.5 Analysis of the Relationships between Bird Richness and Climatic Factors
parameters totally covering 19 months was correlated with the variable of bird richness individually. That is, the R-value between each 48-year set of bird observation data and each set of climatic data for each raster was calculated for 19 times. By comparing the resulting 19 Pearson correlation coefficients for each raster, we can find the climatic variable of which month had the strongest correlation with bird richness, namely, controlling the distribution of the bird species of interest.
3. RESULT AND DISCUSSION
3.1 The Rasterized Bird Richness Data
For each of the bird species test in this study, the routes for its observations each year were rasterized. Figure 3 illustrates the spatial distributions of the numbers of the three bird species in 2014.
Figure 3. Illustrations of the 0.5° rasterized maps showing the locations of the BBS routes (2014), with different colors indicating the numbers of the birds for (a) Carolina wren, (b) Cerulean warbler, and (c) Red-bellied woodpecker.
3.2 Relationships between Bird Richness and the Climatic Factors
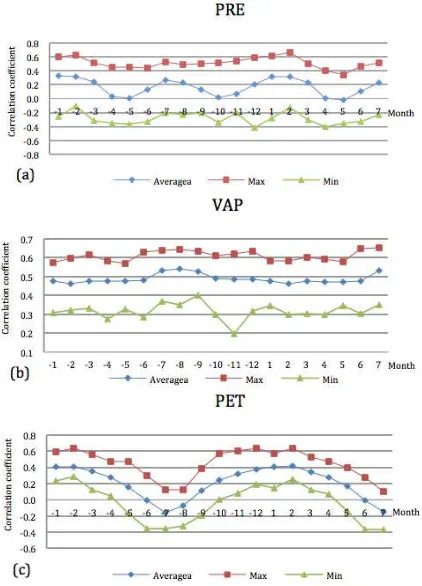
For each raster, the Pearson correlation coefficient between the number of each of the bird species and the value of each of the climatic factors was derived for the 48 years, and this operation was repeated for all of the cases of combination of the three bird species, the three climatic factors, and the 19 prescribed months. The statistical results averaged all over the study area are listed in Figures 4, 5 and 6, which relate to Carolina wren, Cerulean warbler, and Red-bellied woodpecker, respectively.
We can learn from these charts that the species of Carolina wren and Red-bellied woodpecker showed similar patterns but the R-values for Carolina wren, mostly, were correspondingly higher than that for Red-bellied woodpecker. The correlations for the Cerulean warbler species were distinctive to the patterns of the other two bird species.
Figure 4. The max (red), mean (blue), and min (green) correlation coefficients for Carolian wren, in terms of (a) PRE, (b) VAP, and (c) PET. The tick labels of x axis from -1 to 7 mean the months from last January to this July for each year.
(a) PRE, (b) VAP, and (c) PET. The tick labels of x axis from -1 to 7 mean the months from last January to this July for each year.
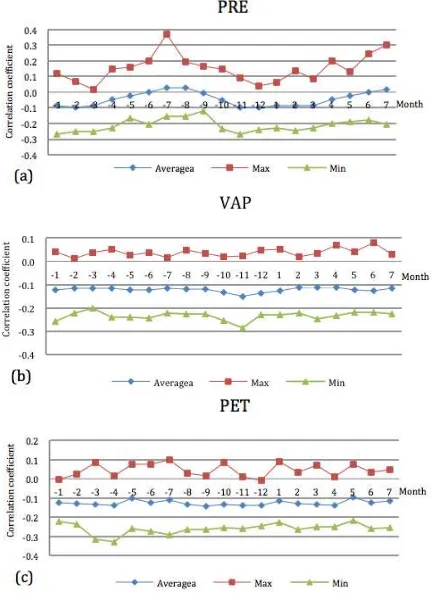
Figure 6. The max (red), mean (blue), and min (green) correlation coefficients for Cerulean warbler, in terms of (a) PRE, (b) VAP, and (c) PET. The tick labels of x axis from -1 to 7 mean the months from last January to this July for each year.
Specifically, for Carolina wren, the best correlation with PRE occurred in the January of the same year, with the determination coefficient of 0.33; the highest correlation with VAP emerged in the August of the last year, with the correlation coefficient of 0.45; the best correlation with PET happed in the February of the same year, with the coefficient of 0.42. It can be noticed that for VAP, the monthly correlation coefficients are relatively smooth. This is because vapor pressure rises and drops steadily within the study area.
For Red-bellied woodpecker, we found the similar performance. The best correlation with PRE occurred in the February of the same year, with the coefficient of 0.20; the highest correlation with VAP emerged in the December of the last year, with the correlation coefficient of 0.39; the best correlation with PET happed in the January of the same year, with the coefficient of 0.36. It can also be found that for VAP, the monthly correlation coefficients are relatively smooth, and the reason is similar to that for the Carolina wren species.
For Cerulean warbler, the correlations performed in a different way. Although it can be exposed that the best correlation with PRE occurred in the January of the same year, the correlations with VAP and PET were almost consistent. That is, the curves of the correlation coefficients are quite smooth and the absolute values are all between 0.1 and 0.2. In some special years, the absolute values are between 0.2 and 0.3. PRE
showed positive correlations in summer and negative correlations in winter, but VAP and PET both showed negative correlations for all of the months of interest.
One important reason of the Cerulean warbler species showing weak correlations with the three climatic factors lies in that the climatic data were obtained from their summer habitats. In fact, the Cerulean warbler species fly to south in the winter. Hence, their correlations, no doubt, did not follow the patterns of the other two non-migratory bird species.
The comparison between the three bird species showed that the three climatic factors are strongly correlated with the richness of the non-migratory bird species. This kind of bird species has strong relationships with vapor pressure, since vapor pressure is determined by the combination effect of water and temperature. This inference fits the finding in the previous study, namely, the abundance of breeding bird species is strongly correlated to the climatic factors of temperature and precipitation (Goetz et al, 2014).
Other factors possibly disturbing the results of the relationship derivation involve global decline in bird species richness, the increase of human population, and land use change (Allen and O’Connor, 2000), which influence bird breeding, growth and migratory. Specifically, for the study continent, the traditional habitats of birds have been widely cleaned up for other lands uses, especially in the western and southwestern parts of the breeding area. In this study, we did not take into account these influence factors, and the analyses were insufficient to fully reveal the relative importance of the three specific climatic factors on North American breeding bird species richness. The following work will add more variables such as vegetation structure and more influence factors into the analyses, in order to give more accurate predictions of the trends of the breeding bird species.
4. CONCLUSION
Based on the BBS bird data and the CRU climatic data, it was found that the richness of breeding birds for the three species of Carolina wren, Cerulean warbler and Red-bellied woodpecker had correlations with the three water-typed climatic factors of precipitation, vapor pressure and potential evapotranspiration but in different patterns, e.g., with strong correlations for the non-migratory species but weak correlations for the migratory species like Cerulean warbler.
ACKNOWLEDGEMENTS
This work was supported in part by the National Natural Science Foundation of China (Grant No. 41471281 and 31670718), in part by the Research Fund for Young Talent of Remote Sensing Science and Technology, and in part by the SRF for ROCS, SEM, China.
REFERENCES
Allen, A. P., O’Connor, R. J., 2000. Interactive effects of land use and other factors on regional bird distributions. J.
Biogeogr. 27 pp. 889–900.
Bled, F., Sauer, J., 2013. Modeling Trends from North American Breeding Bird Survey Data: A Spatially Explicit Approach. PLoS ONE 8(12).
Coops, N. C., Waring, R. H., Wulder, M. A., Pidgeon, A. M. and Radeloff, V. C., 2009. Bird diversity: a predictable function of satellite-derived estimates of seasonal variation in canopy light absorbance across the United States. J. Biogeogr. 36 pp. 905–18.
Cueto, V. R. and Casenave, J. L., 1999. Determinants of bird species richness: role of climate and vegetation structure at a regional scale. J. Biogeogr. 26 pp. 487–92.
Florent, Jean-Claude, 2013.Chimiotheque de petites molecules, outil de recherché pour la biologie chimique. Biologoe Aujourd hui.207 pp. 39-54.
Fitterer, J. L., Nelson, T. A., Coops, N. C., Wulder, M. A. and Mahony, N. A., 2012. Exploring the ecological processes driving geographical patterns of breeding bird richness in British Columbia. Canada Ecol. Appl. 23 pp. 888–903. Goetz, S. J., Sun, M., Zolkos, S., 2014. The relative importance of climate and vegetation properties on patterns of North American breeding bird species richness.
Environmental Research Letters 9.
Hansen, A. J., Phillips, L. B., Flather, C. H. and Robison-Cox J., 2011. Carrying capacity for species richness as a context for conservation: a case study of North American breeding birds. Glob. Ecol. Biogeogr. 20 pp. 817–31.
Lesak, A. A., Radeloff, V. C., Hawbaker, T. J., Pidgeon, A. M., Gobakken, T. and Contrucci, K., 2011. Modeling forest songbird species richness using LiDAR-derived measures of forest structure Remote Sens. Environ. 115pp. 2823–35.
Link, W.A., and J.R. Sauer, 1998. Estimating population change from count data: application to the North American Breeding Bird Survey. Ecological Applications 8:pp. 258-268.
Matthews, S. N., Iverson, L. R., Prasad, A. M. and Peters, M. P., 2007. A Climate Change Atlas for 147 Bird Species of the Eastern United States. [database] (Delaware, OH: Northern Research Station USDA Forest Service).
Matthews, S. N., Iverson, L. R., Prasad, A. M. and Peters, M. P., 2011. Changes in potential habitat of 147 North American breeding bird species in response to redistribution of trees and climate following predicted climate change. Ecography 34 pp. 933–45.
Sauer, J.R., G.W. Pendleton, and S. Orsillo, 1994. Mapping of bird dis- tributions from point count surveys. In C.J. Ralph, J.R. Sauer, and S. Droege, eds. Monitoring Bird Populations by Point Counts. Forest Service, Pacific Southwest Research Station, General Technical Report PSW-GTR-149 pp. 151-160.
Scott JM, Csuti, B., 1997. Gap analysis for biodiversity survey and maintenance. Biodiversity, II. Understanding and protecting our biological resources. (ed. By M.L. Reaka-Kudla, D.E. Wilson and E.O. Wilson), Joseph Henry Press, Washington, DC pp. 321–340.