STATISTIK PERKEBUNAN INDONESIA 2012-2014
TREE CROP ESTATE STATISTICS OF INDONESIA 2012-2014
Naskah/Manuscript
Direktorat Jenderal Perkebunan,
Directorate General of Estate Crops
Kementerian Pertanian
Ministry of Agriculture
Penasehat/Advisor:
Ir. MukƟ Sarjono, M.Sc.
PenyunƟ ng/Senior Editors:
Ir. Bambang Sad Juga, M.Sc.
Lucky Lukmana Sukriya R. SE, M.Sc.
Staf PenyunƟ ng/Editorial Staff s:
Yanuar Arianto, STP
Widya Khonik Zuraina, S.Si
Eko Pudjianto, S.Kom
Asep Udin, S.Kom
Neny KurniawaƟ , S.Si
Susilo Novianto DamarjaƟ , A.Md.
Diterbitkan oleh/Published by
Direktorat Jenderal Perkebunan
Directorate General of Estate Crops
Jl. Harsono RM No. 3 Gedung C
Pasar Minggu - Jakarta 12550
Kotak Pos 1060/Jkt,10010
Tlp. : 021 - 7815380 - 4
Fax. : 021 - 715486 - 7815586
Jakarta, Desember 2013
K
ontribusi subsektor perkebunan terhadap perekonomian nasional
pada tahun 2012 mencapai US$ 35,64 milyar atau setara dengan Rp.
427,68 triliun (asumsi 1 US$ = Rp. 12.000,-) yang melipuƟ ekspor
US$ 24,814 milyar, cukai rokok sebesar US$ 7,918 milyar dan bea keluar
(BK) kelapa sawit dan kakao sebesar US$ 2,908 milyar. Peran perkebunan
tersebut cenderung mengalami peningkatan dari tahun ke tahun dalam
memperkokoh pembangunan nasional. Agar informasi perkebunan dapat
tersebar secara luas, seƟ ap tahun diterbitkan Buku StaƟ sƟ k Perkebunan
Indonesia yang menyajikan data secara handal, sahih, objekif, mutakhir
dan konsisten.
S
taƟ sƟ k Perkebunan Indonesia Tahun 2012-2014 menyajikan data
luas areal, produksi, produkƟ vitas baik secara nasional maupun provinsi menurut
bentuk/status pengusahaannya yaitu Perkebunan Rakyat, Perkebunan Besar Negara dan
Perkebunan Besar Swasta. Penyajian data juga dilengkapi dengan data ekspor dan impor untuk
masing-masing komoditas yang mencakup negara tujuan/asal, volume dan nilai, harga di dalam
dan luar negeri serta untuk beberapa komoditas tertentu disajikan data keseimbangan dunia.
D
ata yang disajikan merupakan hasil sinkronisasi dan validasi data staƟ sƟ k perkebunan
2012-2014 yang dilaksanakan secara berjenjang dari Ɵ ngkat kabupaten sampai Ɵ ngkat
nasional dengan mengacu pada Pedoman Pelaksanaan Pengelolaan Data Komoditas
Perkebunan yang diterbitkan Direktorat Jenderal Perkebunan. Data tersebut melipuƟ angka
tetap (ATAP) Tahun 2012, angka sementara (ASEM) Tahun 2013 dan angka prakiraan (AESTI)
Tahun 2014. Data yang disajikan bersumber dari data primer yang dikumpulkan dari dinas yang
membidangi perkebunan di provinsi dan data sekunder yang dikuƟ p dari data yang diterbitkan
oleh Badan Pusat StaƟ sƟ k (BPS), Kementerian Perindustrian, Kementerian Perdagangan, Bank
Indonesia, dan publikasi yang diterbitkan oleh asosiasi-asosiasi perkebunan baik dalam maupun
luar negeri.
B
uku ini dapat diterbitkan, atas dukungan dan kerjasama yang baik dari berbagai pihak.
Untuk itu, pada kesempatan ini, kami mengucapkan terima kasih atas dukungan dan
kerjasama tersebut. Kami menyadari bahwa buku yang diterbitkan ini masih jauh dari
sempurna. Untuk itu, kriƟ k dan saran yang sifatnya membangun sangat diharapkan sebagai
bahan masukan dalam perbaikan penerbitan di masa datang.
S
emoga apa yang disajikan dalam buku ini dapat digunakan oleh berbagai kalangan dan
para pengguna data serta dapat dijadikan acuan dalam pengambilan kebijakan.
t
t
er
er
ha
ha
da
da
p
p
pe
pe
re
re
ko
ko
no
no
mi
mi
an
an
n
n
as
as
io
io
na
na
l
l
35,64 milyar atau setara dengan Rp.
K
Kata
ata PPengantar
engantar
Jakarta, Desember 2013
DIREKTUR JENDERAL PERKEBUNAN
Ir. Gamal Nasir, MS
NIP. 19560728 198603 1 001
T
he contribu on of Estate Crops Sub Sector to the na onal economy
in 2012 was US $ 35,64 billion or equivalent to Rp. 427,68 trillion
(assumed 1 US $ = Rp. 12.000) which consisted of export value of
US$ 24,814 billion, cigare e and tobacco customs of US $ 7,918 billion and
palm oil and cocoa export taxes of US $ 2,908 billion. That role of the estate
crops tends to increase signifi cantly from year to year in strengthening
na onal development. Furthermore, to spread estate crops informa on
widely, the Estate Crop Sta s cs of Indonesia is published every year that
presented reliable, valid, objec ve, up to date and consistent data.
T
he Estate Crop Sta s cs of Indonesia 2012-2014 presents area, produc on and produc vity
data by province and district level of Smallhoder, government and private estates. It is
completed by volume, value of both export and import data, price data for domes c and
world market and also world balance data for some commodi es.
D
ata presented are the result of synchroniza on and valida on of the estate crop sta s cal
data 2012-2014 which are held hierarchical from the district to the na onal level by
using guidelines of data management of estate crop commodi es. In this edi on, data
of the 2012 are presented as fi xed data, data of the 2013 are the preliminary data and data of
the 2014 are the es ma on. The primary data were collected from the Estate Crops Province
Level and the secondary data were collected from related ins tu on such as Board of Central
Sta s cs, Ministry of Industry, Ministry of Trade, Central Bank of Indonesia, the publica on of
Estate Commodity Associa ons and others.
I
t would have been impossible to compile this book without substan al support and
contribu on from many ins tu ons. At this opportunity, we would like to thank all for their
support and coopera on. We realize that the publica on s ll needs further improvement.
We would greatly appreciate comments and sugges ons for future improvement.
H
opefully this publica on will have high values for users and references for policy
makers.
o
o
no
no
my
my
trilli
on
P
Preface
reface
Jakarta, December 2013
DIRECTOR GENERAL OF ESTATE CROPS
Ir. Gamal Nasir, MS
NIP. 19560728 198603 1 001
Kata Pengantar
Preface
...
iii
DaŌ ar Isi
Contents
... v
DaŌ ar Gambar
List of Figures...
vi
DaŌ ar Tabel
List of Tables ...
vii
DDaftar
aftar
IIsi
si
D
Daftar
aftar
GGambar
ambar
LList of
ist of FFigures
igures
Gambar 1. Perbandingan Luas Areal dan Produksi Tebu Menurut
Status Pengusahaan Tahun 2012
Figure
Area and Produc on Comparison Graph of Sugar Cane by
Farming Category, 2012 ...
1
Gambar 2. Perkembangan Luas Areal, Produksi, ProdukƟ vitas dan
Volume Ekspor-Impor Tebu Tahun 2008 - 2012
Figure Area,
Produc on, Produc vity and Export-Import Volume Trend
Tabel 1.
Luas Areal dan Produksi Tebu Menurut Status Pengusahaan Tahun 1967-2014
Table
Area and Sugar Cane Produc on by Farming Category, 1967-2014 ...
3
Tabel 2.
Luas Panen dan Produksi Tebu Menurut Status Pengusahaan Tahun 1967-2014
Table
Harvested Area and Sugar Cane Produc on by Farming Category, 1967-2014
4
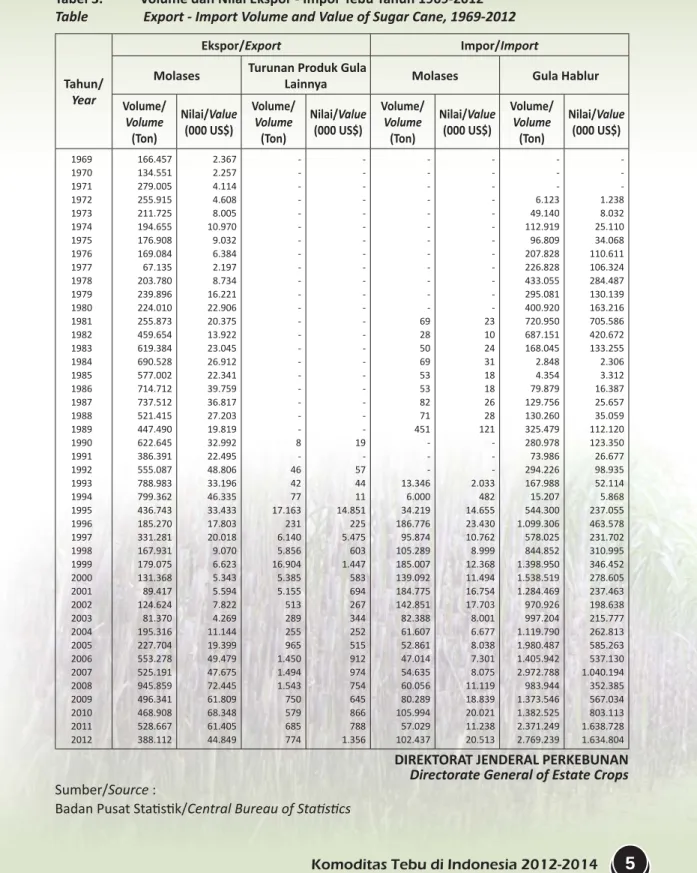
Tabel 3.
Volume dan Nilai Ekspor - Impor Tebu Tahun 1969-2012
Table
Export - Import Volume and Value of Sugar Cane, 1969-2012 ...
5
Tabel 4.
Luas Tanam dan Produksi Tebu Menurut Provinsi dan
Status Pengusahaan Tahun 2012
Table
Planted Area and Sugar Cane Produc on by Province and
Farming Category, 2012 ...
6
Tabel 5.
Luas Tanam dan Produksi Tebu Menurut Provinsi dan
Status Pengusahaan Tahun 2013*)
Table
Planted Area and Sugar Cane Produc on by Province and
Farming Category, 2013*) ...
7
Tabel 6.
Luas Tanam dan Produksi Tebu Menurut Provinsi dan
Status Pengusahaan Tahun 2014**)
Table
Planted Area and Sugar Cane Produc on by Province and
Farming Category, 2014**) ...
8
Tabel 7.
Luas Panen dan Produksi Tebu Menurut Provinsi dan
Status Pengusahaan Tahun 2012
Table
Harvested Area and Sugar Cane Produc on by Province and
Farming Category, 2012 ...
9
Tabel 8.
Luas Panen dan Produksi Tebu Menurut Provinsi dan
Status Pengusahaan Tahun 2013*)
Table
Harvested Area and Sugar Cane Produc on by Province and
Farming Category, 2013*) ...
10
Tabel 9.
Luas Panen dan Produksi Tebu Menurut Provinsi dan
Status Pengusahaan Tahun 2014**)
Table
Harvested Area and Sugar Cane Produc on by Province and
Farming Category, 2014**) ...
11
Tabel 10.
Jumlah Luas Areal dan Produksi Tebu Perkebunan Rakyat,
Besar Negara, Besar Swasta Nasional dan Besar Swasta Asing
(PR+PBN+PBSN+PBSA) Menurut Provinsi dan Keadaan Tanaman
Tahun
2012
ut Status Pengusahaan Tahun 1967-201
4
D
Daftar
aftar
TTabel
abel
Table
Area and Sugar Cane Produc on of Smallholder, Government,
Na onal Private and Foreign Private Estate by Province and
Tree Crops Classifi ca on, 2012 ...
12
Tabel 11.
Jumlah Luas Areal dan Produksi Tebu Perkebunan Rakyat,
Besar Negara, Besar Swasta Nasional dan Besar Swasta Asing
(PR+PBN+PBSN+PBSA) Menurut Provinsi dan Keadaan Tanaman
Tahun
2013*)
Table
Area and Sugar Cane Produc on of Smallholder, Government,
Na onal Private and Foreign Private Estate by Province and
Tree Crops Classifi ca on, 2013*) ...
13
Tabel 12.
Jumlah Luas Areal dan Produksi Tebu Perkebunan Rakyat,
Besar Negara, Besar Swasta Nasional dan Besar Swasta Asing
(PR+PBN+PBSN+PBSA) Menurut Provinsi dan Keadaan Tanaman
Tahun
2014**)
Table
Area and Sugar Cane Produc on of Smallholder, Government,
Na onal Private and Foreign Private Estate by Province and
Tree Crops Classifi ca on, 2014**) ...
14
Tabel 13.
Luas Areal dan Produksi Tebu Perkebunan Rakyat
Menurut Provinsi dan Keadaan Tanaman Tahun 2012
Table
Area and Sugar Cane Produc on of Smallholder by Province and
Tree Crops Classifi ca on, 2012...
15
Tabel 14.
Luas Areal dan Produksi Tebu Perkebunan Rakyat
Menurut Kabupaten dan Keadaan Tanaman Tahun 2012
Table
Area and Sugar Cane Produc on of Smallholder by District and
Tree Crops Classifi ca on, 2012...
16
Tabel 15.
Luas Areal dan Produksi Tebu Perkebunan Rakyat
Menurut Provinsi dan Keadaan Tanaman Tahun 2013*)
Table
Area and Sugar Cane Produc on of Smallholder by Province and
Tree Crops Classifi ca on, 2013*) ...
20
Tabel 16.
Luas Areal dan Produksi Tebu Perkebunan Rakyat
Menurut Provinsi dan Keadaan Tanaman Tahun 2014**)
Table
Area and Sugar Cane Produc on of Smallholder by Province and
Tree Crops Classifi ca on, 2014**) ...
21
Tabel 17.
Luas Areal dan Produksi Tebu Perkebunan Besar Negara
Menurut Provinsi dan Keadaan Tanaman Tahun 2012
Table
Area and Sugar Cane Produc on of Government Estate by
Province and Tree CropsClassifi ca on, 2012 ...
22
Tabel 18.
Luas Areal dan Produksi Tebu Perkebunan Besar Negara
Menurut Kabupaten dan Keadaan Tanaman Tahun 2012
Table
Area and Sugar Cane Produc on of Government Estate by
Tabel 19.
Luas Areal dan Produksi Tebu Perkebunan Besar Negara
Menurut Provinsi dan Keadaan Tanaman Tahun 2013*)
Table
Area and Sugar Cane Produc on of Government Estate by
Province and Tree CropsClassifi ca on, 2013*) ...
25
Tabel 19.
Luas Areal dan Produksi Tebu Perkebunan Besar Negara
Menurut Provinsi dan Keadaan Tanaman Tahun 2014**)
Table
Area and Sugar Cane Produc on of Government Estate by
Province and Tree CropsClassifi ca on, 2014**) ...
26
Tabel 21.
Luas Areal dan Produksi Tebu Perkebunan Besar Swasta Nasional
Menurut Provinsi dan Keadaan Tanaman Tahun 2012
Table
Area and Sugar Cane Produc on of Government Estate by
Province and Tree CropsClassifi ca on, 2014**) ...
27
Tabel 22.
Luas Areal dan Produksi Tebu Perkebunan Besar Swasta Nasional
Menurut Kabupaten dan Keadaan Tanaman Tahun 2012
Table
Area and Sugar Cane Produc on of Na onal Private Estate by
District and Tree Crops Classifi ca on, 2012 ...
28
Tabel 23.
Luas Areal dan Produksi Tebu Perkebunan Besar Swasta Nasional
Menurut Provinsi dan Keadaan Tanaman Tahun 2013*)
Table
Area and Sugar Cane Produc on of Na onal Private Estate by
Province and Tree Crops Classifi ca on, 2013*) ...
29
Tabel 24.
Luas Areal dan Produksi Tebu Perkebunan Besar Swasta Nasional
Menurut Provinsi dan Keadaan Tanaman Tahun 2014**)
Table
Area and Sugar Cane Produc on of Na onal Private Estate by
Province and Tree Crops Classifi ca on, 2014**) ...
30
Tabel 25.
Luas Areal dan Produksi Tebu Perkebunan Besar Swasta Asing
Menurut Provinsi dan Keadaan Tanaman Tahun 2012
Table
Area and Sugar Cane Produc on of Foreign Private Estate by
Province and Tree Crops Classifi ca on, 2012 ...
31
Tabel 26.
Luas Areal dan Produksi Tebu Perkebunan Besar Swasta Asing
Menurut Kabupaten dan Keadaan Tanaman Tahun 2012
Table
Area and Sugar Cane Produc on of Foreign Private Estate by
District and Tree Crops Classifi ca on, 2012 ...
32
Tabel 27.
Luas Areal dan Produksi Tebu Perkebunan Besar Swasta Asing
Menurut Provinsi dan Keadaan Tanaman Tahun 2013*)
Table
Area and Sugar Cane Produc on of Foreign Private Estate by
Province and Tree Crops Classifi ca on, 2013*) ...
33
Tabel 28.
Luas Areal dan Produksi Tebu Perkebunan Besar Swasta Asing
Menurut Provinsi dan Keadaan Tanaman Tahun 2014**)
Table
Area and Sugar Cane Produc on of Foreign Private Estate by
Tabel 29.
Luas Areal dan Produksi Tebu Perkebunan Rakyat
Penghasil Gula Merah Menurut Provinsi dan Keadaan Tanaman
Tahun
2012
Table
Area and Brown Sugar Produc on of Smallholder by Province and
Tree Crops Classifi ca on, 2012...
35
Tabel 30.
Luas Areal dan Produksi Tebu Perkebunan Rakyat
Penghasil Gula Merah Menurut Kabupaten dan Keadaan Tanaman
Tahun
2012
Table
Area and Brown Sugar Produc on of Smallholder by District and
Tree Crops Classifi ca on, 2012...
36
Tabel 31.
Luas Areal dan Produksi Tebu Perkebunan Rakyat
Penghasil Gula Merah Menurut Provinsi dan Keadaan Tanaman
Tahun
2013*)
Table
Area and Brown Sugar Produc on of Smallholder by Province and
Tree Crops Classifi ca on, 2013*) ...
38
Tabel 32.
Luas Areal dan Produksi Tebu Perkebunan Rakyat
Penghasil Gula Merah Menurut Provinsi dan Keadaan Tanaman
Tahun
2014**)
Table
Area and Brown Sugar Produc on of Smallholder by Province and
Tree Crops Classifi ca on, 2014**) ...
39
Tabel 33.
Volume dan Nilai Ekspor - Impor Tebu Menurut Negara Tujuan dan
Asal Tahun 2012
Table
Export - Import Volume and Value of Sugar Cane by Des na on and
Origin Country, 2012 ...
40
Tabel 34.
Perkembangan Harga Bulanan Gula Tebu di Pasar Dalam Negeri
Tahun
1997-2012
Table
Monthly Price of Sugar Cane in Domes c Market, 1997 - 2012 ...
42
Tabel 35.
Perkembangan Harga Bulanan Gula di Pasar Dunia Tahun 2006-2013
Gambar 1. Perbandingan Luas Areal dan Produksi Tebu Menurut Status Pengusahaan
Tahun 2012
Gambar 2. Perkembangan Luas Areal, Produksi, ProdukƟ vitas dan Volume Ekspor-Impor
Tebu Tahun 2008 - 2012
Figure Area,
ProducƟ on, ProducƟ vity and Export-Import Volume Trend Graph of Sugar
Cane, 2008 - 2012
Tabel 1.
Luas Areal dan Produksi Tebu Menurut Status Pengusahaan Tahun 1967-2014
Table
Area and Sugar Cane ProducƟ on by Farming Category, 1967-2014
Tahun/
Year
Luas Areal/Area (Ha)
Jumlah/
Total
Produksi/ProducƟ on (Ton)
Jumlah/
Total
PR/
Smallhoder
PBN/
Government
PBS/
Private
Smallhoder
PR/
PBN/
Government
PBS/
Private
1967 1968 1969 1970 1971 1972 1973 1974 1975 1976 1977 1978 1979 1980 1981 1982 1983 1984 1985 1986 1987 1988 1989 1990 1991 1992 1993 1994 1995 1996 1997 1998 1999 2000 2001 2002 2003 2004 2005 2006 2007 2008 2009 2010 2011 2012 2013 *) 2014**) 44.088 43.760 48.826 45.067 48.569 71.667 69.541 71.962 72.964 92.040 118.453 102.213 191.859 259.874 290.470 303.228 315.649 236.810 225.787 238.509 241.169 254.669 249.933 259.877 255.934 262.092 280.504 276.581 263.157 304.047 218.201 195.048 176.733 171.279 178.887 196.509 172.015 184.283 211.479 213.876 259.259 258.001 259.259 275.908 278.733 266.379 282.093 289.731 58.919 58.550 67.300 69.607 74.811 63.807 85.492 90.102 89.003 95.583 99.644 121.423 126.103 37.629 36.722 43.043 49.152 85.569 95.079 69.168 75.926 92.368 77.378 71.252 96.625 105.905 104.460 107.570 120.162 79.269 85.086 83.069 82.106 64.133 87.687 79.975 87.251 78.205 80.383 87.227 74.185 76.250 74.185 68.141 67.020 77.719 78.971 77.727 766 3.153 6.910 7.041 3.004 13.236 14.476 14.711 17.861 21.279 16.395 24.465 25.534 18.560 18.996 17.049 19.572 19.629 19.363 18.026 17.823 18.492 30.441 32.839 33.745 36.065 40.689 44.585 52.718 63.217 83.591 98.972 83.372 105.248 77.867 74.238 76.459 82.305 89.924 95.338 107.996 114.494 107.996 110.062 106.035 107.157 108.163 106.701 103.773 105.463 123.036 121.715 126.384 148.710 169.509 176.775 179.828 208.902 234.492 248.101 343.496 316.063 346.188 363.320 384.373 342.008 340.229 325.703 334.918 365.529 357.752 363.968 386.304 404.062 425.653 428.736 436.037 446.533 386.878 377.089 342.211 340.660 344.441 350.722 335.725 344.793 381.786 396.441 441.440 448.745 441.440 454.111 451.788 451.255 469.227 474.159 249.700 202.800 205.500 195.846 218.700 213.933 203.659 249.647 221.226 266.728 353.385 484.914 735.894 893.120 913.677 1.373.009 1.240.500 1.397.350 1.450.184 1.567.552 1.743.677 1.575.083 1.621.468 1.609.041 1.612.240 1.652.685 1.684.614 1.673.246 1.350.476 1.512.131 1.196.409 759.094 738.893 790.573 813.538 967.160 839.028 1.028.681 1.193.653 1.028.681 1.326.937 1.382.747 1.326.937 1.295.319 1.366.294 1.543.411 1.525.197 1.930.577 578.800 525.600 630.000 602.700 707.586 756.195 693.089 857.866 877.703 899.715 923.829 940.972 369.926 273.355 200.436 182.041 290.597 329.713 343.035 346.130 322.758 339.541 305.847 306.263 450.561 475.804 393.720 509.047 422.300 316.660 365.313 305.332 284.782 234.288 310.949 297.685 370.476 383.892 423.421 383.892 356.504 368.009 356.504 315.174 295.635 336.288 331.073 442.582 5.400 23.700 72.100 73.900 122.239 130.449 18.121 127.213 142.727 151.931 83.159 71.082 80.570 93.475 116.007 71.752 88.441 83.310 105.590 100.892 109.439 89.427 181.033 204.281 189.866 177.995 251.477 271.588 286.800 265.404 630.264 423.843 470.258 665.143 600.980 490.509 422.414 639.071 624.668 639.071 833.933 943.471 833.933 679.623 605.958 711.988 694.722 729.661 833.900 752.100 907.600 872.446 1.048.525 1.100.577 914.869 1.234.726 1.241.656 1.318.374 1.360.373 1.496.968 1.186.390 1.259.950 1.230.120 1.626.802 1.619.538 1.810.373 1.898.809 2.014.574 2.175.874 2.004.051 2.108.348 2.119.585 2.252.667 2.306.484 2.329.811 2.453.881 2.059.576 2.094.195 2.191.986 1.488.269 1.493.933 1.690.004 1.725.467 1.755.354 1.631.918 2.051.644 2.241.742 2.051.644 2.517.374 2.694.227 2.517.374 2.290.116 2.267.887 2.591.687 2.550.991 3.102.820DIREKTORAT JENDERAL PERKEBUNAN
Directorate General of Estate Crops
Keterangan/Note :
1. Angka Sementara/Preliminary*)
2. Angka EsƟ masi/Es ma on**)
Tabel 2.
Luas Panen dan Produksi Tebu Menurut Status Pengusahaan Tahun 1967-2014
Table
Harvested Area and Sugar Cane ProducƟ on by Farming Category, 1967-2014
Tahun/
Year
Luas Areal/Area (Ha)
Jumlah/
Total
Produksi/ProducƟ on (Ton)
Jumlah/
Total
PR/
Smallhoder
PBN/
Government
PBS/
Private
PR/Smallhoder
Government
PBN/
PBS/
Private
1967 1968 1969 1970 1971 1972 1973 1974 1975 1976 1977 1978 1979 1980 1981 1982 1983 1984 1985 1986 1987 1988 1989 1990 1991 1992 1993 1994 1995 1996 1997 1998 1999 2000 2001 2002 2003 2004 2005 2006 2007 2008 2009 2010 2011 2012 2013*) 2014**) 44.088 43.760 48.826 45.067 48.569 71.667 69.541 71.962 72.964 92.040 118.453 102.213 191.859 259.874 290.470 303.228 315.649 236.810 225.787 238.509 241.169 254.669 249.933 259.877 255.934 262.092 280.504 276.581 263.157 304.047 218.201 195.048 176.733 171.279 178.887 196.509 172.015 184.283 211.479 213.876 249.487 252.783 243.219 261.665 278.698 265.233 280.419 286.604 58.919 58.550 67.300 69.607 74.811 63.807 85.492 90.102 89.003 95.583 99.644 121.423 126.103 37.629 36.722 43.043 49.152 85.569 95.079 69.168 75.926 92.368 77.378 71.252 96.625 105.905 104.460 107.570 120.162 79.269 85.086 83.069 82.106 64.133 87.687 79.975 87.251 78.205 80.383 87.227 81.655 82.222 74.185 68.141 67.020 77.690 77.967 76.277 766 3.153 6.910 7.041 3.004 13.236 14.476 14.711 17.861 21.279 16.395 24.465 25.534 18.560 18.996 17.049 19.572 19.629 19.363 18.026 17.823 18.492 30.441 32.839 33.745 36.065 40.689 44.585 52.718 63.217 83.591 98.972 83.372 105.248 77.867 74.238 76.459 82.305 89.924 95.338 96.657 101.500 105.549 102.909 105.115 106.225 107.733 106.199 103.773 105.463 123.036 121.715 126.384 148.710 169.509 176.775 179.828 208.902 234.492 248.101 343.496 316.063 346.188 363.320 384.373 342.008 340.229 325.703 334.918 365.529 357.752 363.968 386.304 404.062 425.653 428.736 436.037 446.533 386.878 377.089 342.211 340.660 344.441 350.722 335.725 344.793 381.786 396.441 427.799 436.505 422.953 432.715 450.833 449.149 466.120 469.081 249.700 202.800 205.500 195.846 218.700 213.933 203.659 249.647 221.226 266.728 353.385 484.914 735.894 893.120 913.677 1.373.009 1.240.500 1.397.350 1.450.184 1.567.552 1.743.677 1.575.083 1.621.468 1.609.041 1.612.240 1.652.685 1.684.614 1.673.246 1.350.476 1.512.131 1.196.409 759.094 738.893 790.573 813.538 967.160 839.028 1.028.681 1.193.653 1.028.681 1.514.529 1.536.209 1.326.937 1.295.319 1.366.294 1.543.411 1.525.197 1.930.577 578.800 525.600 630.000 602.700 707.586 756.195 693.089 857.866 877.703 899.715 923.829 940.972 369.926 273.355 200.436 182.041 290.597 329.713 343.035 346.130 322.758 339.541 305.847 306.263 450.561 475.804 393.720 509.047 422.300 316.660 365.313 305.332 284.782 234.288 310.949 297.685 370.476 383.892 423.421 383.892 424.692 396.186 356.504 315.174 295.635 336.288 331.073 442.582 5.400 23.700 72.100 73.900 122.239 130.449 18.121 127.213 142.727 151.931 83.159 71.082 80.570 93.475 116.007 71.752 88.441 83.310 105.590 100.892 109.439 89.427 181.033 204.281 189.866 177.995 251.477 271.588 286.800 265.404 630.264 423.843 470.258 665.143 600.980 490.509 422.414 639.071 624.668 639.071 684.565 736.033 833.933 679.623 605.958 711.988 694.722 729.661 833.900 752.100 907.600 872.446 1.048.525 1.100.577 914.869 1.234.726 1.241.656 1.318.374 1.360.373 1.496.968 1.186.390 1.259.950 1.230.120 1.626.802 1.619.538 1.810.373 1.898.809 2.014.574 2.175.874 2.004.051 2.108.348 2.119.585 2.252.667 2.306.484 2.329.811 2.453.881 2.059.576 2.094.195 2.191.986 1.488.269 1.493.933 1.690.004 1.725.467 1.755.354 1.631.918 2.051.644 2.241.742 2.051.644 2.623.786 2.668.428 2.517.374 2.290.116 2.267.887 2.591.687 2.550.991 3.102.820DIREKTORAT JENDERAL PERKEBUNAN
Directorate General of Estate Crops
Keterangan/Note :
1. Angka Sementara/Preliminary*)
2. Angka EsƟ masi/Es ma on**)
Tabel 3.
Volume dan Nilai Ekspor - Impor Tebu Tahun 1969-2012
Table
Export - Import Volume and Value of Sugar Cane, 1969-2012
Tahun/
Year
Ekspor/Export
Impor/Import
Molases
Turunan Produk Gula
Lainnya
Molases
Gula Hablur
Volume/
Volume
(Ton)
Nilai/Value
(000 US$)
Volume/
Volume
(Ton)
Nilai/Value
(000 US$)
Volume/
Volume
(Ton)
Nilai/Value
(000 US$)
Volume/
Volume
(Ton)
Nilai/Value
(000 US$)
1969 1970 1971 1972 1973 1974 1975 1976 1977 1978 1979 1980 1981 1982 1983 1984 1985 1986 1987 1988 1989 1990 1991 1992 1993 1994 1995 1996 1997 1998 1999 2000 2001 2002 2003 2004 2005 2006 2007 2008 2009 2010 2011 2012 166.457 134.551 279.005 255.915 211.725 194.655 176.908 169.084 67.135 203.780 239.896 224.010 255.873 459.654 619.384 690.528 577.002 714.712 737.512 521.415 447.490 622.645 386.391 555.087 788.983 799.362 436.743 185.270 331.281 167.931 179.075 131.368 89.417 124.624 81.370 195.316 227.704 553.278 525.191 945.859 496.341 468.908 528.667 388.112 2.367 2.257 4.114 4.608 8.005 10.970 9.032 6.384 2.197 8.734 16.221 22.906 20.375 13.922 23.045 26.912 22.341 39.759 36.817 27.203 19.819 32.992 22.495 48.806 33.196 46.335 33.433 17.803 20.018 9.070 6.623 5.343 5.594 7.822 4.269 11.144 19.399 49.479 47.675 72.445 61.809 68.348 61.405 44.849 - - - - - - - - - - - - - - - - - - - - - 8 - 46 42 77 17.163 231 6.140 5.856 16.904 5.385 5.155 513 289 255 965 1.450 1.494 1.543 750 579 685 774 - - - - - - - - - - - - - - - - - - - - - 19 - 57 44 11 14.851 225 5.475 603 1.447 583 694 267 344 252 515 912 974 754 645 866 788 1.356 - - - - - - - - - - - - 69 28 50 69 53 53 82 71 451 - - - 13.346 6.000 34.219 186.776 95.874 105.289 185.007 139.092 184.775 142.851 82.388 61.607 52.861 47.014 54.635 60.056 80.289 105.994 57.029 102.437 - - - - - - - - - - - - 23 10 24 31 18 18 26 28 121 - - - 2.033 482 14.655 23.430 10.762 8.999 12.368 11.494 16.754 17.703 8.001 6.677 8.038 7.301 8.075 11.119 18.839 20.021 11.238 20.513 - - - 6.123 49.140 112.919 96.809 207.828 226.828 433.055 295.081 400.920 720.950 687.151 168.045 2.848 4.354 79.879 129.756 130.260 325.479 280.978 73.986 294.226 167.988 15.207 544.300 1.099.306 578.025 844.852 1.398.950 1.538.519 1.284.469 970.926 997.204 1.119.790 1.980.487 1.405.942 2.972.788 983.944 1.373.546 1.382.525 2.371.249 2.769.239 - - - 1.238 8.032 25.110 34.068 110.611 106.324 284.487 130.139 163.216 705.586 420.672 133.255 2.306 3.312 16.387 25.657 35.059 112.120 123.350 26.677 98.935 52.114 5.868 237.055 463.578 231.702 310.995 346.452 278.605 237.463 198.638 215.777 262.813 585.263 537.130 1.040.194 352.385 567.034 803.113 1.638.728 1.634.804DIREKTORAT JENDERAL PERKEBUNAN
Directorate General of Estate Crops
Sumber/Source :
Tabel 4.
Luas Tanam dan Produksi Tebu Menurut Provinsi dan Status Pengusahaan Tahun 2012
Table
Planted Area and Sugar Cane ProducƟ on by Province and Farming Category, 2012
No.
Provinsi/Province
Perkebunan Rakyat
Smallhoder
Perkebunan Negara
Government
Perkebunan Swasta
Private
Jumlah/Total
Tanam
Planted
(Ha)
Produksi
ProducƟ on
(Ton)
Tanam
Planted
(Ha)
Produksi
ProducƟ on
(Ton)
Tanam
Planted
(Ha)
Produksi
ProducƟ on
(Ton)
Tanam
Planted
(Ha)
Produksi
ProducƟ on
(Ton)
1. 2. 3. 4. 5. 6. 7. 8. 9. 10. ACEH SUMATERA UTARA SUMATERA BARAT R I A U KEPULAUAN RIAU J A M B I SUMATERA SELATAN KEP. BANGKA BELITUNG BENGKULU LAMPUNG - 2.462 - - - - 674 - - 6.690 - 8.113 - - - - 1.370 - - 36.010 - 8.566 - - - - 21.651 - - 7.832 - 33.392 - - - - 78.554 - - 39.851 - - - - - - - - - 99.349 - - - - - - - - - 678.758 - 11.028 - - - - 22.325 - - 113.871 - 41.505 - - - - 79.924 - - 754.619 WILAYAH SUMATERA 9.826 45.493 38.049 151.797 99.349 678.758 147.224 876.048 11. 12. 13. 14. 15. 16. DKI. JAKARTA JAWA BARAT BANTEN JAWA TENGAH D.I. YOGYAKARTA JAWA TIMUR - 10.007 - 60.934 3.479 178.389 - 48.641 - 281.394 15.848 1.137.976 - 11.639 - 237 - 17.865 - 54.007 - 1.009 - 102.722 - - - 1.308 - 137 - - - 7.372 - 1.101 - 21.646 - 62.479 3.479 196.391 - 102.648 - 289.775 15.848 1.241.799 WILAYAH JAWA 252.809 1.483.859 29.741 157.738 1.445 8.473 283.995 1.650.069 17. 18. 19. B A L INUSA TENGGARA BARAT NUSA TENGGARA TIMUR
- - 72 - - 6 - - - - - - - - - - - - - - 72 - - 6
WILAYAH NUSA TENGGARA & BALI 72 6 - - - - 72 6
20. 21. 22. 23. KALIMANTAN BARAT KALIMANTAN TENGAH KALIMANTAN SELATAN KALIMANTAN TIMUR - - - - - - - - - - - - - - - - - - - - - - - - - - - - - - - - WILAYAH KALIMANTAN - - - - - - - - 24. 25. 26. 27. 28. 29. SULAWESI UTARA GORONTALO SULAWESI TENGAH SULAWESI SELATAN SULAWESI BARAT SULAWESI TENGGARA - 1.124 - 2.549 - - - 7.091 - 6.962 - - - - - 9.929 - - - - - 26.752 - - - 6.363 - - - - - 24.757 - - - - - 7.487 - 12.478 - - 31.849 - 33.715 - WILAYAH SULAWESI 3.673 14.054 9.929 26.752 6.363 24.757 19.965 65.563 30. 31. 32. 33. M A L U K U MALUKU UTARA PAPUA PAPUA BARAT - - -- - - -- - - - - -- - - -- - - -- - - -- - - --
WILAYAH MALUKU & PAPUA - - - - - - - -
I N D O N E S I A 266.379 1.543.411 77.719 336.288 107.157 711.988 451.255 2.591.687
DIREKTORAT JENDERAL PERKEBUNAN
Directorate General of Estate Crops
Keterangan/Note :
1. Angka Tetap/Fixed
Tabel 5.
Luas Tanam dan Produksi Tebu Menurut Provinsi dan Status Pengusahaan Tahun 2013*)
Table
Planted Area and Sugar Cane ProducƟ on by Province and Farming Category, 2013*)
No.
Provinsi/Province
Perkebunan Rakyat
Smallhoder
Perkebunan Negara
Government
Perkebunan Swasta
Private
Jumlah/Total
Tanam
Planted
(Ha)
Produksi
ProducƟ on
(Ton)
Tanam
Planted
(Ha)
Produksi
ProducƟ on
(Ton)
Tanam
Planted
(Ha)
Produksi
ProducƟ on
(Ton)
Tanam
Planted
(Ha)
Produksi
ProducƟ on
(Ton)
1. 2. 3. 4. 5. 6. 7. 8. 9. 10. ACEH SUMATERA UTARA SUMATERA BARAT R I A U KEPULAUAN RIAU J A M B I SUMATERA SELATAN KEP. BANGKA BELITUNG BENGKULU LAMPUNG - 2.553 - - - - 806 - - 10.142 - 8.858 - - - - 2.022 - - 50.881 - 6.982 - - - - 20.787 - - 6.981 - 28.489 - - - - 93.456 - - 29.223 - - - - - - - - - 99.074 - - - - - - - - - 664.807 - 9.535 - - - - 21.593 - - 116.198 - 37.347 - - - - 95.478 - - 744.911 WILAYAH SUMATERA 13.501 61.760 34.750 151.169 99.074 664.807 147.326 877.736 11. 12. 13. 14. 15. 16. DKI. JAKARTA JAWA BARAT BANTEN JAWA TENGAH D.I. YOGYAKARTA JAWA TIMUR - 9.864 - 65.031 4.775 185.125 - 38.409 - 280.883 13.983 1.117.976 - 12.688 - 346 - 21.992 - 53.159 - 993 - 100.349 - - - 3.093 - 376 - - - 6.940 - 1.253 - 22.553 - 68.470 4.775 207.493 - 91.568 - 288.816 13.983 1.219.578 WILAYAH JAWA 264.795 1.451.250 35.026 154.501 3.469 8.193 303.291 1.613.944 17. 18. 19. B A L INUSA TENGGARA BARAT NUSA TENGGARA TIMUR
- - 72 - - 8 - - - - - - - - - - - - - - 72 - - 8
WILAYAH NUSA TENGGARA & BALI 72 8 - - - - 72 8
20. 21. 22. 23. KALIMANTAN BARAT KALIMANTAN TENGAH KALIMANTAN SELATAN KALIMANTAN TIMUR - - - - - - - - - - - - - - - - - - - - - - - - - - - - - - - - WILAYAH KALIMANTAN - - - - - - - - 24. 25. 26. 27. 28. 29. SULAWESI UTARA GORONTALO SULAWESI TENGAH SULAWESI SELATAN SULAWESI BARAT SULAWESI TENGGARA - 1.174 - 2.550 - - - 6.205 - 5.973 - - - - - 9.195 - - - - - 25.404 - - - 5.620 - - - - - 21.721 - - - - - 6.794 - 11.745 - - - 27.926 - 31.377 - - WILAYAH SULAWESI 3.724 12.178 9.195 25.404 5.620 21.721 18.539 59.303 30. 31. 32. 33. M A L U K U MALUKU UTARA PAPUA PAPUA BARAT - - -- - - -- - - -- - - -- - - -- - - - - -- - - --
WILAYAH MALUKU & PAPUA - - - - - - - -
I N D O N E S I A 282.093 1.525.197 78.971 331.073 108.163 694.722 469.227 2.550.991
DIREKTORAT JENDERAL PERKEBUNAN
Directorate General of Estate Crops
Keterangan/Note :
1. Angka Sementara/Preliminary*)
Tabel 6.
Luas Tanam dan Produksi Tebu Menurut Provinsi dan Status Pengusahaan Tahun 2014**)
Table
Planted Area and Sugar Cane ProducƟ on by Province and Farming Category, 2014**)
No.
Provinsi/Province
Perkebunan Rakyat
Smallhoder
Perkebunan Negara
Government
Perkebunan Swasta
Private
Jumlah/Total
Tanam
Planted
(Ha)
Produksi
ProducƟ on
(Ton)
Tanam
Planted
(Ha)
Produksi
ProducƟ on
(Ton)
Tanam
Planted
(Ha)
Produksi
ProducƟ on
(Ton)
Tanam
Planted
(Ha)
Produksi
ProducƟ on
(Ton)
1. 2. 3. 4. 5. 6. 7. 8. 9. 10. ACEH SUMATERA UTARA SUMATERA BARAT R I A U KEPULAUAN RIAU J A M B I SUMATERA SELATAN KEP. BANGKA BELITUNG BENGKULU LAMPUNG 99 2.553 29 - - 98 994 - - 10.666 225 17.271 65 - - 213 5.743 - - 68.203 - 6.982 - - - - 20.787 - - 6.983 - 39.653 - - - - 119.672 - - 46.945 - - - - - - - - - 98.674 - - - - - - - - - 674.547 99 9.535 29 - - 98 21.781 - - 116.324 225 56.924 65 - - 213 125.415 - - 789.695 WILAYAH SUMATERA 14.439 91.720 34.752 206.270 98.674 674.547 147.866 972.537 11. 12. 13. 14. 15. 16. DKI. JAKARTA JAWA BARAT BANTEN JAWA TENGAH D.I. YOGYAKARTA JAWA TIMUR - 9.945 - 66.431 4.840 189.997 - 52.618 - 381.634 27.367 1.353.416 - 12.618 - 350 - 20.992 - 65.158 - 1.208 - 122.056 - - - 2.093 - 314 - - - 16.098 - 1.269 - 22.564 - 68.874 4.840 211.303 - 117.776 - 398.940 27.367 1.476.742 WILAYAH JAWA 271.213 1.815.035 33.960 188.423 2.407 17.367 307.581 2.020.825 17. 18. 19. B A L INUSA TENGGARA BARAT NUSA TENGGARA TIMUR
- - 72 - - 9 - - - - - - - - - - - - - - 72 - - 9
WILAYAH NUSA TENGGARA & BALI 72 9 - - - - 72 9
20. 21. 22. 23. KALIMANTAN BARAT KALIMANTAN TENGAH KALIMANTAN SELATAN KALIMANTAN TIMUR - - - - - - - - - - - - - - - - - - - - - - - - - - - - - - - - WILAYAH KALIMANTAN - - - - - - - - 24. 25. 26. 27. 28. 29. SULAWESI UTARA GORONTALO SULAWESI TENGAH SULAWESI SELATAN SULAWESI BARAT SULAWESI TENGGARA - 1.246 - 2.760 - - - 7.547 - 16.266 - - - - - 9.014 - - - - - 47.889 - - - 5.620 - - - - - 37.747 - - - - - 6.866 - 11.774 - - - 45.294 - 64.155 - - WILAYAH SULAWESI 4.006 23.813 9.014 47.889 5.620 37.747 18.640 109.449 30. 31. 32. 33. M A L U K U MALUKU UTARA PAPUA PAPUA BARAT - - -- - - -- - - - - -- - - -- - - -- - - -- - - --
WILAYAH MALUKU & PAPUA - - - - - - - -
I N D O N E S I A 289.731 1.930.577 77.727 442.582 106.701 729.661 474.159 3.102.820
DIREKTORAT JENDERAL PERKEBUNAN
Directorate General of Estate Crops
Keterangan/Note :
1. Angka EsƟ masi/Es ma on**)
Tabel 7.
Luas Panen dan Produksi Tebu Menurut Provinsi dan Status Pengusahaan Tahun 2012
Table
Harvested Area and Sugar Cane ProducƟ on by Province and Farming Category, 2012
No.
Provinsi/Province
Perkebunan Rakyat
Smallhoder
Perkebunan Negara
Government
Perkebunan Swasta
Private
Jumlah/Total
Panen
Harvested
(Ha)
Produksi
ProducƟ on
(Ton)
Panen
Harvested
(Ha)
Produksi
ProducƟ on
(Ton)
Panen
Harvested
(Ha)
Produksi
ProducƟ on
(Ton)
Panen
Harvested
(Ha)
Produksi
ProducƟ on
(Ton)
1. 2. 3. 4. 5. 6. 7. 8. 9. 10. ACEH SUMATERA UTARA SUMATERA BARAT R I A U KEPULAUAN RIAU J A M B I SUMATERA SELATAN KEP. BANGKA BELITUNG BENGKULU LAMPUNG - 2.462 - - - - 629 - - 6.690 - 8.113 - - - - 1.370 - - 36.010 - 8.566 - - - - 21.622 - - 7.832 - 33.392 - - - - 78.554 - - 39.851 - - - - - - - - - 98.419 - - - - - - - - - 678.758 - 11.028 - - - - 22.251 - - 112.941 - 41.505 - - - - 79.924 - - 754.619 WILAYAH SUMATERA 9.781 45.493 38.020 151.797 98.419 678.758 146.220 876.048 11. 12. 13. 14. 15. 16. DKI. JAKARTA JAWA BARAT BANTEN JAWA TENGAH D.I. YOGYAKARTA JAWA TIMUR - 9.980 - 60.142 3.285 178.389 - 48.641 - 281.394 15.848 1.137.976 - 11.639 - 237 - 17.865 - 54.007 - 1.009 - 102.722 - - - 1.306 - 137 - - - 7.372 - 1.101 - 21.619 - 61.685 3.285 196.391 - 102.648 - 289.775 15.848 1.241.799 WILAYAH JAWA 251.796 1.483.859 29.741 157.738 1.443 8.473 282.979 1.650.069 17. 18. 19. B A L INUSA TENGGARA BARAT NUSA TENGGARA TIMUR
- - 29 - - 6 - - - - - - - - - - - - - - 29 - - 6
WILAYAH NUSA TENGGARA & BALI 29 6 - - - - 29 6
20. 21. 22. 23. KALIMANTAN BARAT KALIMANTAN TENGAH KALIMANTAN SELATAN KALIMANTAN TIMUR - - - - - - - - - - - - - - - - - - - - - - - - - - - - - - - - WILAYAH KALIMANTAN - - - - - - - - 24. 25. 26. 27. 28. 29. SULAWESI UTARA GORONTALO SULAWESI TENGAH SULAWESI SELATAN SULAWESI BARAT SULAWESI TENGGARA - 1.124 - 2.504 - - - 7.091 - 6.962 - - - - - 9.929 - - - - - 26.752 - - - 6.363 - - - - - 24.757 - - - - - 7.487 - 12.433 - - - 31.849 - 33.715 - - WILAYAH SULAWESI 3.628 14.054 9.929 26.752 6.363 24.757 19.920 65.563 30. 31. 32. 33. M A L U K U MALUKU UTARA PAPUA PAPUA BARAT - - - - -- - - - - -- - - - - -- - - -- - - --
WILAYAH MALUKU & PAPUA - - - -
I N D O N E S I A 265.233 1.543.411 77.690 336.288 106.225 711.988 449.149 2.591.687
DIREKTORAT JENDERAL PERKEBUNAN
Directorate General of Estate Crops
Keterangan/Note :
1. Angka Tetap/Fixed
Tabel 8.
Luas Panen dan Produksi Tebu Menurut Provinsi dan Status Pengusahaan Tahun 2013*)
Table
Harvested Area and Sugar Cane ProducƟ on by Province and Farming Category, 2013*)
No.
Provinsi/Province
Perkebunan Rakyat
Smallhoder
Perkebunan Negara
Government
Perkebunan Swasta
Private
Jumlah/Total
Panen
Harvested
(Ha)
Produksi
ProducƟ on
(Ton)
Panen
Harvested
(Ha)
Produksi
ProducƟ on
(Ton)
Panen
Harvested
(Ha)
Produksi
ProducƟ on
(Ton)
Panen
Harvested
(Ha)
Produksi
ProducƟ on
(Ton)
1. 2. 3. 4. 5. 6. 7. 8. 9. 10. ACEH SUMATERA UTARA SUMATERA BARAT R I A U KEPULAUAN RIAU J A M B I SUMATERA SELATAN KEP. BANGKA BELITUNG BENGKULU LAMPUNG - 2.553 - - - - 798 - - 10.056 - 8.858 - - - - 2.022 - - 50.881 - 6.682 - - - - 20.786 - - 6.983 - 28.489 - - - - 93.456 - - 29.223 - - - - - - - - - 98.874 - - - - - - - - - 664.807 - 9.235 - - - - 21.584 - - 115.913 - 37.347 - - - - 95.478 - - 744.911 WILAYAH SUMATERA 13.407 61.760 34.451 151.169 98.874 664.807 146.733 877.736 11. 12. 13. 14. 15. 16. DKI. JAKARTA JAWA BARAT BANTEN JAWA TENGAH D.I. YOGYAKARTA JAWA TIMUR - 9.593 - 64.432 4.525 184.726 - 38.409 - 280.883 13.983 1.117.976 - 12.540 - 346 - 21.637 - 53.159 - 993 - 100.349 - - - 2.926 - 313 - - - 6.940 - 1.253 - 22.133 - 67.704 4.525 206.676 - 91.568 - 288.816 13.983 1.219.578 WILAYAH JAWA 263.276 1.451.250 34.523 154.501 3.239 8.193 301.038 1.613.944 17. 18. 19. B A L INUSA TENGGARA BARAT NUSA TENGGARA TIMUR
- - 27 - - 8 - - - - - - - - - - - - - - 27 - - 8
WILAYAH NUSA TENGGARA & BALI 27 8 - - - - 27 8
20. 21. 22. 23. KALIMANTAN BARAT KALIMANTAN TENGAH KALIMANTAN SELATAN KALIMANTAN TIMUR - - - - - - - - - - - - - - - - - - - - - - - - - - - - - - - - WILAYAH KALIMANTAN - - - - - - - - 24. 25. 26. 27. 28. 29. SULAWESI UTARA GORONTALO SULAWESI TENGAH SULAWESI SELATAN SULAWESI BARAT SULAWESI TENGGARA - 1.159 - 2.550 - - - 6.205 - 5.973 - - - - - 8.993 - - - - - 25.404 - - - 5.620 - - - - - 21.721 - - - - - 6.779 - 11.543 - - - 27.926 - 31.377 - - WILAYAH SULAWESI 3.709 12.178 8.993 25.404 5.620 21.721 18.322 59.303 30. 31. 32. 33. M A L U K U MALUKU UTARA PAPUA PAPUA BARAT - - -- - - -- - - - - -- - - - - -- - - -- - - --
WILAYAH MALUKU & PAPUA - - - -
I N D O N E S I A 280.419 1.525.197 77.967 331.073 107.733 694.722 466.120 2.550.991
DIREKTORAT JENDERAL PERKEBUNAN
Directorate General of Estate Crops
Keterangan/Note :
1. Angka Sementara/Preliminary*)
Tabel 9.
Luas Panen dan Produksi Tebu Menurut Provinsi dan Status Pengusahaan Tahun 2014**)
Table
Harvested Area and Sugar Cane ProducƟ on by Province and Farming Category, 2014**)
No.
Provinsi/Province
Perkebunan Rakyat
Smallhoder
Perkebunan Negara
Government
Perkebunan Swasta
Private
Jumlah/Total
Panen
Harvested
(Ha)
Produksi
ProducƟ on
(Ton)
Panen
Harvested
(Ha)
Produksi
ProducƟ on
(Ton)
Panen
Harvested
(Ha)
Produksi
ProducƟ on
(Ton)
Panen
Harvested
(Ha)
Produksi
ProducƟ on
(Ton)
1. 2. 3. 4. 5. 6. 7. 8. 9. 10. ACEH SUMATERA UTARA SUMATERA BARAT R I A U KEPULAUAN RIAU J A M B I SUMATERA SELATAN KEP. BANGKA BELITUNG BENGKULU LAMPUNG 97 2.553 26 - - 95 966 - - 9.596 225 17.271 65 - - 213 5.743 - - 68.203 - 6.982 - - - - 20.787 - - 6.982 - 39.653 - - - - 119.672 - - 46.945 - - - - - - - - - 98.174 - - - - - - - - - 674.547 97 9.535 26 - - 95 21.753 - - 114.753 225 56.924 65 - - 213 125.415 - - 789.695 WILAYAH SUMATERA 13.333 91.720 34.751 206.270 98.174 674.547 146.259 972.537 11. 12. 13. 14. 15. 16. DKI. JAKARTA JAWA BARAT BANTEN JAWA TENGAH D.I. YOGYAKARTA JAWA TIMUR - 9.943 - 64.512 4.786 189.997 - 52.618 - 381.634 27.367 1.353.416 - 12.140 - 341 - 20.152 - 65.158 - 1.208 - 122.056 - - - 2.093 - 312 - - - 16.098 - 1.269 - 22.083 - 66.946 4.786 210.461 - 117.776 - 398.940 27.367 1.476.742 WILAYAH JAWA 269.238 1.815.035 32.633 188.423 2.405 17.367 304.276 2.020.825 17. 18. 19. B A L INUSA TENGGARA BARAT NUSA TENGGARA TIMUR
- - 27 - - 9 - - - - - - - - - - - - - - 27 - - 9
WILAYAH NUSA TENGGARA & BALI 27 9 - - - - 27 9
20. 21. 22. 23. KALIMANTAN BARAT KALIMANTAN TENGAH KALIMANTAN SELATAN KALIMANTAN TIMUR - - - - - - - - - - - - - - - - - - - - - - - - - - - - - - - - WILAYAH KALIMANTAN - - - - - - - - 24. 25. 26. 27. 28. 29. SULAWESI UTARA GORONTALO SULAWESI TENGAH SULAWESI SELATAN SULAWESI BARAT SULAWESI TENGGARA - 1.246 - 2.760 - - - 7.547 - 16.266 - - - - - 8.893 - - - - - 47.889 - - - 5.620 - - - - - 37.747 - - - - - 6.866 - 11.653 - - - 45.294 - 64.155 - - WILAYAH SULAWESI 4.006 23.813 8.893 47.889 5.620 37.747 18.519 109.449 30. 31. 32. 33. M A L U K U MALUKU UTARA PAPUA PAPUA BARAT - - - - -- - - -- - - -- - - - - -- - - - - --
WILAYAH MALUKU & PAPUA - - - -
I N D O N E S I A 286.604 1.930.577 76.277 442.582 106.199 729.661 469.081 3.102.820
DIREKTORAT JENDERAL PERKEBUNAN
Directorate General of Estate Crops
Keterangan/Note :
1. Angka EsƟ masi/Es ma on**)
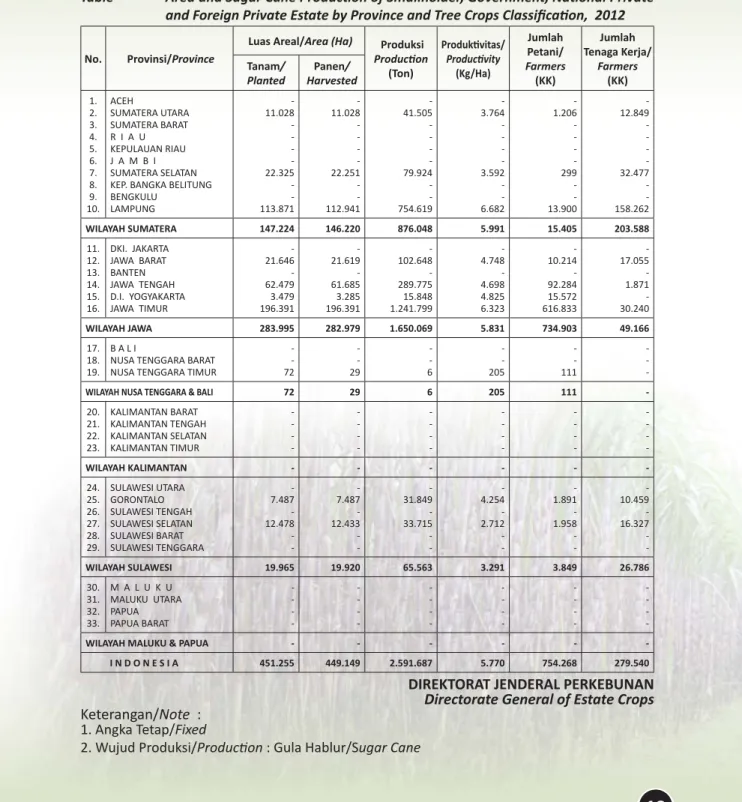
Tabel 10.
Luas Areal dan Produksi Tebu Perkebunan Rakyat, Besar Negara, Besar Swasta
Nasional dan Besar Swasta Asing (PR+PBN+PBSN+PBSA) Menurut Provinsi dan
Keadaan Tanaman Tahun 2012
Table
Area and Sugar Cane ProducƟ on of Smallholder, Government, NaƟ onal Private
and Foreign Private Estate by Province and Tree Crops Classifi caƟ on, 2012
No.
Provinsi/Province
Luas Areal/Area (Ha)
Produksi
ProducƟ on
(Ton)
ProdukƟ vitas/
ProducƟ vity
(Kg/Ha)
Jumlah
Petani/
Farmers
(KK)
Jumlah
Tenaga Kerja/
Farmers
(KK)
Tanam/
Planted
Panen/
Harvested
1. 2. 3. 4. 5. 6. 7. 8. 9. 10. ACEH SUMATERA UTARA SUMATERA BARAT R I A U KEPULAUAN RIAU J A M B I SUMATERA SELATAN KEP. BANGKA BELITUNG BENGKULU LAMPUNG - 11.028 - - - - 22.325 - - 113.871 - 11.028 - - - - 22.251 - - 112.941 - 41.505 - - - - 79.924 - - 754.619 - 3.764 - - - - 3.592 - - 6.682 - 1.206 - - - - 299 - - 13.900 - 12.849 - - - - 32.477 - - 158.262 WILAYAH SUMATERA 147.224 146.220 876.048 5.991 15.405 203.588 11. 12. 13. 14. 15. 16. DKI. JAKARTA JAWA BARAT BANTEN JAWA TENGAH D.I. YOGYAKARTA JAWA TIMUR - 21.646 - 62.479 3.479 196.391 - 21.619 - 61.685 3.285 196.391 - 102.648 - 289.775 15.848 1.241.799 - 4.748 - 4.698 4.825 6.323 - 10.214 - 92.284 15.572 616.833 - 17.055 - 1.871 - 30.240 WILAYAH JAWA 283.995 282.979 1.650.069 5.831 734.903 49.166 17. 18. 19. B A L INUSA TENGGARA BARAT NUSA TENGGARA TIMUR
- - 72 - - 29 - - 6 - - 205 - - 111 - - -
WILAYAH NUSA TENGGARA & BALI 72 29 6 205 111 -
20. 21. 22. 23. KALIMANTAN BARAT KALIMANTAN TENGAH KALIMANTAN SELATAN KALIMANTAN TIMUR - - - - - - - - - - - - - - - - - - - - - - - - WILAYAH KALIMANTAN - - - - - - 24. 25. 26. 27. 28. 29. SULAWESI UTARA GORONTALO SULAWESI TENGAH SULAWESI SELATAN SULAWESI BARAT SULAWESI TENGGARA - 7.487 - 12.478 - - - 7.487 - 12.433 - - - 31.849 - 33.715 - - - 4.254 - 2.712 - - - 1.891 - 1.958 - - - 10.459 - 16.327 - - WILAYAH SULAWESI 19.965 19.920 65.563 3.291 3.849 26.786 30. 31. 32. 33. M A L U K U MALUKU UTARA PAPUA PAPUA BARAT - - -- - - -- - - -- - - -- - - -- - - --
WILAYAH MALUKU & PAPUA - - - - - -
I N D O N E S I A 451.255 449.149 2.591.687 5.770 754.268 279.540
DIREKTORAT JENDERAL PERKEBUNAN
Directorate General of Estate Crops
Keterangan/Note :
1. Angka Tetap/Fixed
Tabel 11.
Luas Areal dan Produksi Tebu Perkebunan Rakyat, Besar Negara, Besar Swasta
Nasional dan Besar Swasta Asing (PR+PBN+PBSN+PBSA) Menurut Provinsi dan
Keadaan Tanaman Tahun 2013*)
Table
Area and Sugar Cane ProducƟ on of Smallholder, Government, NaƟ onal Private
and Foreign Private Estate by Province and Tree Crops Classifi caƟ on, 2013*)
No.
Provinsi/Province
Luas Areal/Area (Ha)
Produksi
ProducƟ on
(Ton)
ProdukƟ vitas/
ProducƟ vity
(Kg/Ha)
Jumlah
Petani/
Farmers
(KK)
Jumlah
Tenaga Kerja/
Farmers
(KK)
Tanam/
Planted
Panen/
Harvested
1. 2. 3. 4. 5. 6. 7. 8. 9. 10. ACEH SUMATERA UTARA SUMATERA BARAT R I A U KEPULAUAN RIAU J A M B I SUMATERA SELATAN KEP. BANGKA BELITUNG BENGKULU LAMPUNG - 9.535 - - - - 21.593 - - 116.198 - 9.235 - - - - 21.584 - - 115.913 - 37.347 - - - - 95.478 - - 744.911 - 4.044 - - - - 4.423 - - 6.426 - 1.226 - - - - 451 - - 17.521 - 12.669 - - - - 30.084 - - 162.177 WILAYAH SUMATERA 147.326 146.733 877.736 5.982 19.198 204.930 11. 12. 13. 14. 15. 16. DKI. JAKARTA JAWA BARAT BANTEN JAWA TENGAH D.I. YOGYAKARTA JAWA TIMUR - 22.553 - 68.470 4.775 207.493 - 22.133 - 67.704 4.525 206.676 - 91.568 - 288.816 13.983 1.219.578 - 4.137 - 4.266 3.090 5.901 - 10.601 - 91.008 12.903 626.926 - 16.815 - 3.984 - 30.178 WILAYAH JAWA 303.291 301.038 1.613.944 5.361 741.439 50.978 17. 18. 19. B A L INUSA TENGGARA BARAT NUSA TENGGARA TIMUR
- - 72 - - 27 - - 8 - - 296 - - 111 - - -
WILAYAH NUSA TENGGARA & BALI 72 27 8 296 111 -
20. 21. 22. 23. KALIMANTAN BARAT KALIMANTAN TENGAH KALIMANTAN SELATAN KALIMANTAN TIMUR - - - - - - - - - - - - - - - - - - - - - - - - WILAYAH KALIMANTAN - - - - - - 24. 25. 26. 27. 28. 29. SULAWESI UTARA GORONTALO SULAWESI TENGAH SULAWESI SELATAN SULAWESI BARAT SULAWESI TENGGARA - 6.794 - 11.745 - - - 6.779 - 11.543 - - - 27.926 - 31.377 - - - 4.120 - 2.718 - - - 1.979 - 1.990 - - - 9.237 - 16.098 - - WILAYAH SULAWESI 18.539 18.322 59.303 3.237 3.969 25.335 30. 31. 32. 33. M A L U K U MALUKU UTARA PAPUA PAPUA BARAT - - -- - - -- - - -- - - -- - - -- - - --
WILAYAH MALUKU & PAPUA - - - - - -
I N D O N E S I A 469.227 466.120 2.550.991 5.473 764.716 281.243
DIREKTORAT JENDERAL PERKEBUNAN
Directorate General of Estate Crops
Keterangan/Note :
1. Angka Sementara/Preliminary*)
Tabel 12.
Luas Areal dan Produksi Tebu Perkebunan Rakyat, Besar Negara, Besar Swasta
Nasional dan Besar Swasta Asing (PR+PBN+PBSN+PBSA) Menurut Provinsi dan
Keadaan Tanaman Tahun 2014**)
Table
Area and Sugar Cane ProducƟ on of Smallholder, Government, NaƟ onal Private
and Foreign Private Estate by Province and Tree Crops Classifi caƟ on, 2014**)
No.
Provinsi/Province
Luas Areal/Area (Ha)
Produksi
ProducƟ on
(Ton)
ProdukƟ vitas/
ProducƟ vity
(Kg/Ha)
Jumlah
Petani/
Farmers
(KK)
Jumlah
Tenaga Kerja/
Farmers
(KK)
Tanam/
Planted
Panen/
Harvested
1. 2. 3. 4. 5. 6. 7. 8. 9. 10. ACEH SUMATERA UTARA SUMATERA BARAT R I A U KEPULAUAN RIAU J A M B I SUMATERA SELATAN KEP. BANGKA BELITUNG BENGKULU LAMPUNG 99 9.535 29 - - 98 21.781 - - 116.324 97 9.535 26 - - 95 21.753 - - 114.753 225 56.924 65 - - 213 125.415 - - 789.695 2.320 5.970 2.500 - - 2.242 5.765 - - 6.882 39 1.017 12 - - 43 441 - - 15.237 - 10.473 - - - - 31.181 - - 158.487 WILAYAH SUMATERA 147.866 146.259 972.537 6.649 16.790 200.140 11. 12. 13. 14. 15. 16. DKI. JAKARTA JAWA BARAT BANTEN JAWA TENGAH D.I. YOGYAKARTA JAWA TIMUR - 22.564 - 68.874 4.840 211.303 - 22.083 - 66.946 4.786 210.461 - 117.776 - 398.940 27.367 1.476.742 - 5.333 - 5.959 5.718 7.017 - 10.401 - 98.446 15.911 649.961 - 18.025 - 2.954 - 35.567 WILAYAH JAWA 307.581 304.276 2.020.825 6.641 774.719 56.546 17. 18. 19. B A L INUSA TENGGARA BARAT NUSA TENGGARA TIMUR
- - 72 - - 27 - - 9 - - 333 - - 111 - - -
WILAYAH NUSA TENGGARA & BALI 72 27 9 333 111 -
20. 21. 22. 23. KALIMANTAN BARAT KALIMANTAN TENGAH KALIMANTAN SELATAN KALIMANTAN TIMUR - - - - - - - - - - - - - - - - - - - - - - - - WILAYAH KALIMANTAN - - - - - - 24. 25. 26. 27. 28. 29. SULAWESI UTARA GORONTALO SULAWESI TENGAH SULAWESI SELATAN SULAWESI BARAT SULAWESI TENGGARA - 6.866 - 11.774 - - - 6.866 - 11.653 - - - 45.294 - 64.155 - - - 6.597 - 5.505 - - - 2.097 - 1.955 - - - 9.237 - 14.597 - - WILAYAH SULAWESI 18.640 18.519 109.449 5.910 4.052 23.834 30. 31. 32. 33. M A L U K U MALUKU UTARA PAPUA PAPUA BARAT - - -- - - -- - - -- - - -- - - -- - - --
WILAYAH MALUKU & PAPUA - - - - - -
I N D O N E S I A 474.159 469.081 3.102.820 6.615 795.672 280.521