Tree Crop Estate Statistics Of Indonesia
STATISTIK PERKEBUNAN INDONESIA
Direktorat Jenderal Perkebunan
Directorate General of Estate Crops
Jakarta, Desember 2014
Jakarta, December 2014
Sugar Cane
2013 - 2015
2013 - 2015
T E B U
T E B U
Naskah/Manuscript
Direktorat Jenderal Perkebunan,
Directorate General of Estate Crops
Kementerian Pertanian
Ministry of Agriculture
Penasehat/Advisor:
Ir. Irmijati Rachmi Nurbahar, M.Sc.
Penyunting/Senior Editors:
Ir. Ida Yunia Soependi, M.Sc.
Yanuar Arianto, STP
Staf Penyunting/Editorial Staffs:
Widya Khonik Zuraina, S.Si
Eko Pudjianto, S.Kom
Asep Udin, S.Kom
Neny Kurniawati, S.Si
Susilo Novianto Damarjati, A.Md.
Diterbitkan oleh/Published by
Direktorat Jenderal Perkebunan
Directorate General of Estate Crops
Jl. Harsono RM No. 3 Gedung C
Pasar Minggu - Jakarta 12550
Kotak Pos 1060/Jkt,10010
Tlp. : 021 - 7815380 - 4
Fax. : 021 - 715486 - 7815586
Jakarta, Desember 2014
Jakarta, December 2014
STATISTIK PERKEBUNAN INDONESIA 2013-2015
K
omoditas perkebunan merupakan andalan bagi pendapatan
nasional dan devisa negara Indonesia, yang dapat dilihat dari nilai
ekspor komoditas perkebunan, pada Tahun 2013 total ekspor
perkebunan mencapai US$ 29,476 milyar atau setara dengan Rp. 353,713
triliun (asumsi 1 US$=Rp.12.000). Kontribusi sub sektor perkebunan
terhadap perekonomian nasional semakin meningkat dan diharapkan
dapat memperkokoh pembangunan perkebunan secara menyeluruh. Agar
informasi perkebunan dapat tersebar secara luas, setiap tahun diterbitkan
Buku Statistik Perkebunan Indonesia yang menyajikan data secara handal,
sahih, objektif, mutakhir dan konsisten.
S
tatistik Perkebunan Indonesia Tahun 2013-2015 menyajikan data luas areal, produksi,
produktivitas baik secara nasional maupun provinsi menurut status pengusahaannya
yaitu Perkebunan Rakyat, Perkebunan Besar Negara dan Perkebunan Besar Swasta.
Penyajian data juga dilengkapi dengan data ekspor dan impor untuk masing-masing komoditas
yang mencakup negara tujuan/asal, volume dan nilai, harga di dalam dan luar negeri serta untuk
beberapa komoditas tertentu disajikan data keseimbangan dunia.
D
ata yang disajikan merupakan hasil sinkronisasi dan validasi data statistik perkebunan
2013-2015 yang dilaksanakan secara berjenjang dari tingkat kabupaten sampai tingkat
nasional dengan mengacu pada Pedoman Pelaksanaan Pengelolaan Data Komoditas
Perkebunan yang diterbitkan Direktorat Jenderal Perkebunan. Data tersebut meliputi angka
tetap (ATAP) Tahun 2013, angka sementara (ASEM) Tahun 2014 dan angka estimasi (AESTI)
Tahun 2015. Data yang disajikan bersumber dari data primer yang dikumpulkan dari dinas yang
membidangi perkebunan di provinsi dan data sekunder yang dikutip dari data yang diterbitkan
oleh Badan Pusat Statistik (BPS), Kementerian Perindustrian, Kementerian Perdagangan, Bank
Indonesia, dan publikasi yang diterbitkan oleh asosiasi-asosiasi perkebunan baik dalam maupun
luar negeri.
B
uku ini dapat diterbitkan, atas dukungan dan kerjasama yang baik dari berbagai pihak.
Untuk itu, pada kesempatan ini, kami mengucapkan terima kasih atas dukungan dan
kerjasama tersebut. Kami menyadari bahwa buku yang diterbitkan ini masih jauh dari
sempurna. Untuk itu, kritik dan saran yang sifatnya membangun sangat diharapkan sebagai
bahan masukan dalam perbaikan penerbitan di masa datang.
S
emoga apa yang disajikan dalam buku ini dapat digunakan oleh berbagai kalangan dan
para pengguna data serta dapat dijadikan acuan dalam pengambilan kebijakan.
Kata
Pengantar
Jakarta, Desember 2014
DIREKTUR JENDERAL PERKEBUNAN
Ir. Gamal Nasir, MS
T
he estate crop commodities is the mainstay of national income
and Indonesia’s foreign exchange wich can be seen from export
value of the estate crop commodities. In 2013, total export of the
estate crops was US $ 29,476 billion or equivalent to Rp. 353,713 trillion
(assumed 1 US $ = Rp. 12.000). The contribution of estate crops sub sector
to the national economy tends to increase from year to year and expected
to strengthen overall national development. Furthermore, to spread
estate crops information widely, The Estate Crop Statistics of Indonesia is
published every year that presented reliable, valid, objective, up to date
and consistent data.
T
he Estate Crop Statistics of Indonesia 2013-2015 presents area, production and
productivity data by province and district level of smallhoder, government and private
estates. It is completed by volume, value of both export and import data, price data for
domestic and world market and also world balance data for some commodities.
D
ata presented are the result of synchronization and validation of the estate crop
statistical data 2013-2015 which are held hierarchical from the district to the national
level by using guidelines of data management of estate crop commodities. In this edition,
data of the 2013 are presented as fixed data, data of the 2013 are the preliminary data and data
of the 2014 are the estimation. The primary data were collected from the Estate Crops Province
Level and the secondary data were collected from related instution such as Board of Central
Statistics, Ministry of Industry, Ministry of Trade, Central Bank of Indonesia, the publication of
Estate Commodity Associations and others.
I
t would have been impossible to compile this book without substantional support and
contribution from many instutions. At this opportunity, we would like to thank all for their
support and cooperation. We realize that the publication still needs further improvement.
We would greatly appreciate comments and suggestions for future improvement.
H
opefully this publication will have high values for users and references for policy
makers.
Preface
Jakarta, December 2014
DIRECTOR GENERAL OF ESTATE CROPS
Ir. Gamal Nasir, MS
Kata Pengantar
Preface
...
iii
Daftar Isi
Contents
...
v
Daftar Gambar
List of Figures...
vi
Daftar Tabel
List of Tables ...
vii
Daftar
Isi
Daftar
Gambar
List of Figures
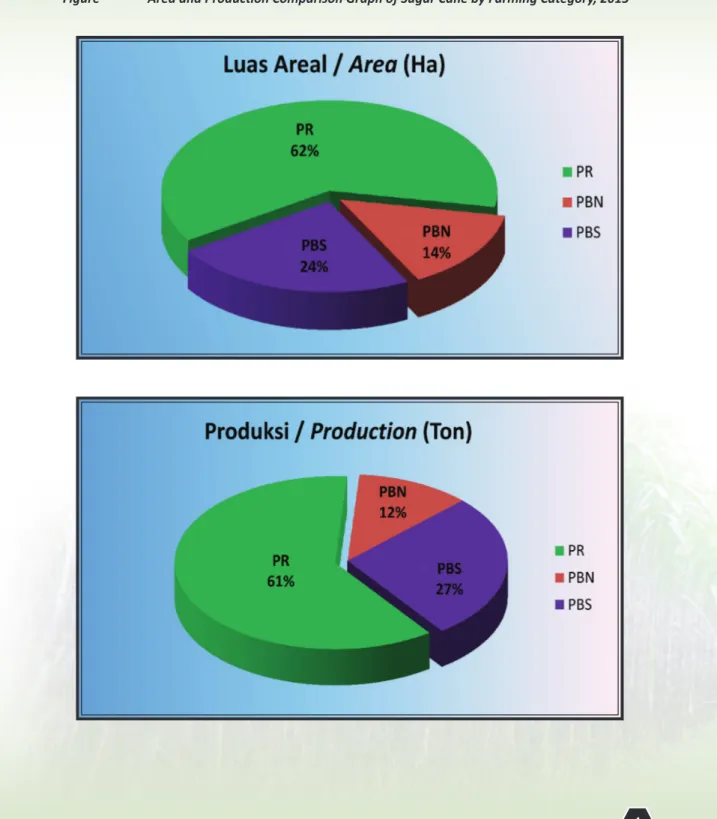
Gambar 1. Perbandingan Luas Areal dan Produksi Tebu Menurut Status
Pengusahaan Tahun 2013
Figure
Area and Production Comparison Graph of Sugar Cane by Farming
Category, 2013 ...
1
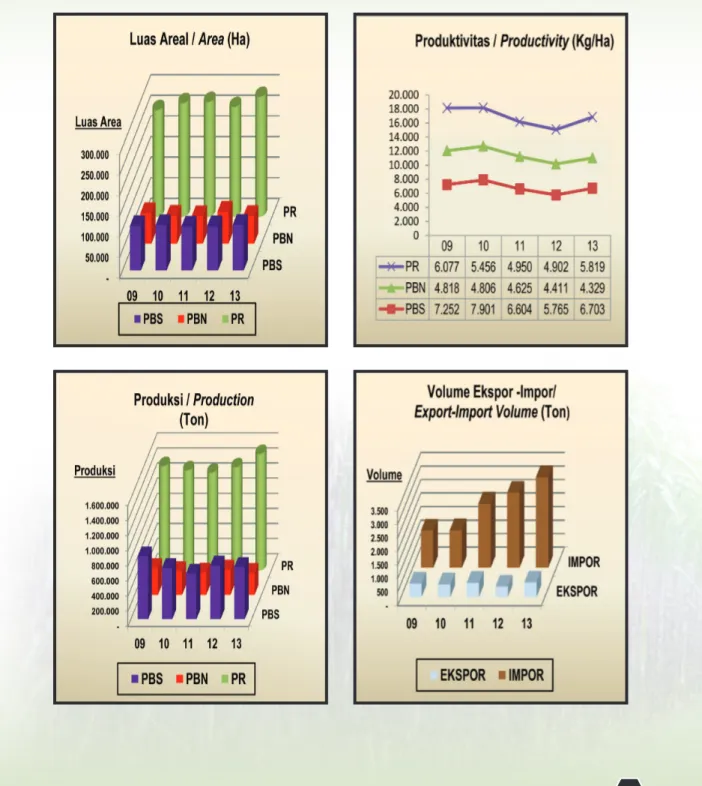
Gambar 2. Perkembangan Luas Areal, Produksi, Produktivitas dan Volume
Ekspor-Impor Tebu Tahun 2009 - 2013
Figure
Area, Production, Productivity and Export-Import Volume Trend
Tabel 1.
Luas Areal dan Produksi Tebu Menurut Status Pengusahaan
Tahun 1967-2015
Table
Area and Sugar Cane Production by Farming Category, 1967-2015 ...
3
Tabel 2.
Luas Panen dan Produksi Tebu Menurut Status Pengusahaan
Tahun 1967-2015
Table
Harvested Area and Sugar Cane Production by Farming
Category, 1967-2015 ...
4
Tabel 3.
Volume dan Nilai Ekspor - Impor Tebu Tahun 1969-2013
Table
Export - Import Volume and Value of Sugar Cane, 1969-2013 ...
5
Tabel 4.
Luas Tanam dan Produksi Tebu Menurut Provinsi dan Status
Pengusahaan Tahun 2013
Table
Planted Area and Sugar Cane Production by Province and Farming
Category, 2013 ...
6
Tabel 5.
Luas Tanam dan Produksi Tebu Menurut Provinsi dan Status
Pengusahaan Tahun 2014*)
Table
Planted Area and Sugar Cane Production by Province and Farming
Category, 2014*) ...
7
Tabel 6.
Luas Tanam dan Produksi Tebu Menurut Provinsi dan Status
Pengusahaan Tahun 2015**)
Table
Planted Area and Sugar Cane Production by Province and Farming
Category, 2015**) ...
8
Tabel 7.
Luas Panen dan Produksi Tebu Menurut Provinsi dan Status
Pengusahaan Tahun 2013
Table
Harvested Area and Sugar Cane Production by Province and Farming
Category, 2013 ...
9
Tabel 8.
Luas Tanam dan Produksi Tebu Menurut Provinsi dan Status
Pengusahaan Tahun 2014*)
Table
Planted Area and Sugar Cane Production by Province and Farming
Category, 2014*) ...
10
Daftar
Tabel
Tabel 9.
Luas Tanam dan Produksi Tebu Menurut Provinsi dan Status
Pengusahaan Tahun 2015**)
Table
Planted Area and Sugar Cane Production by Province and Farming
Category, 2015**) ...
11
Tabel 10.
Jumlah Luas Areal dan Produksi Tebu Perkebunan Rakyat,
Besar Negara dan Besar Swasta (PR+PBN+PBS) Menurut
Provinsi dan Keadaan Tanaman Tahun 2013
Table
Area and Sugar Cane Production of Smallholder, Government and
Private Estate by Province and Tree Crops Classification, 2013 ...
12
Tabel 11.
Jumlah Luas Areal dan Produksi Tebu Perkebunan Rakyat,
Besar Negara dan Besar Swasta (PR+PBN+PBS) Menurut
Provinsi dan Keadaan Tanaman Tahun 2014*)
Table
Area and Sugar Cane Production of Smallholder, Government and
Private Estate by Province and Tree Crops Classification, 2014*) ...
13
Tabel 12.
Jumlah Luas Areal dan Produksi Tebu Perkebunan Rakyat,
Besar Negara dan Besar Swasta (PR+PBN+PBS) Menurut
Provinsi dan Keadaan Tanaman Tahun 2015**)
Table
Area and Sugar Cane Production of Smallholder, Government and
Private Estate by Province and Tree Crops Classification, 2015**) ...
14
Tabel 13.
Luas Areal dan Produksi Tebu Perkebunan Rakyat Menurut
Provinsi dan Keadaan Tanaman Tahun 2013
Table
Area and Sugar Cane Production of Smallholder by Province and
Tree Crops Classification, 2013...
15
Tabel 14.
Luas Areal dan Produksi Tebu Perkebunan Rakyat Menurut
Kabupaten dan Keadaan Tanaman Tahun 2013
Table
Area and Sugar Cane Production of Smallholder by District and
Tree Crops Classification, 2013...
16
Tabel 15.
Luas Areal dan Produksi Tebu Perkebunan Rakyat Menurut
Provinsi dan Keadaan Tanaman Tahun 2014*)
Table
Area and Sugar Cane Production of Smallholder by Province and
Tree Crops Classification, 2014*) ...
20
Tabel 16.
Luas Areal dan Produksi Tebu Perkebunan Rakyat Menurut
Provinsi dan Keadaan Tanaman Tahun 2015**)
Table
Area and Sugar Cane Production of Smallholder by Province and
Tabel 17.
Luas Areal dan Produksi Tebu Perkebunan Besar Negara
Menurut Provinsi dan Keadaan Tanaman Tahun 2013
Table
Area and Sugar Cane Production of Government Estate by
Province and Tree Crops Classification, 2013 ...
22
Tabel 18.
Luas Areal dan Produksi Tebu Perkebunan Besar Negara
Menurut Kabupaten dan Keadaan Tanaman Tahun 2013
Table
Area and Sugar Cane Production of Government Estate by
District and Tree Crops Classification, 2013 ...
23
Tabel 19.
Luas Areal dan Produksi Tebu Perkebunan Besar Negara
Menurut Provinsi dan Keadaan Tanaman Tahun 2014*)
Table
Area and Sugar Cane Production of Government Estate by
Province and Tree Crops Classification, 2014*) ...
25
Tabel 20.
Luas Areal dan Produksi Tebu Perkebunan Besar Negara
Menurut Provinsi dan Keadaan Tanaman Tahun 2015**)
Table
Area and Sugar Cane Production of Government Estate by
Province and Tree Crops Classification, 2015**) ...
26
Tabel 21.
Luas Areal dan Produksi Tebu Perkebunan Besar Swasta
Menurut Provinsi dan Keadaan Tanaman Tahun 2013
Table
Area and Sugar Cane Production of Private Estate by Province and
Tree Crops Classification, 2013...
27
Tabel 22.
Luas Areal dan Produksi Tebu Perkebunan Besar Swasta Menurut
Kabupaten dan Keadaan Tanaman Tahun 2013
Table
Area and Sugar Cane Production of Private Estate by District and
Tree Crops Classification, 2013...
28
Tabel 23.
Luas Areal dan Produksi Tebu Perkebunan Besar Swasta Menurut
Provinsi dan Keadaan Tanaman Tahun 2014*)
Table
Area and Sugar Cane Production of Private Estate by Province and
Tree Crops Classification, 2014*) ...
29
Tabel 24.
Luas Areal dan Produksi Tebu Perkebunan Besar Swasta Menurut
Provinsi dan Keadaan Tanaman Tahun 2015**)
Table
Area and Sugar Cane Production of Private Estate by Province and
Tree Crops Classification, 2015**) ...
30
Tabel 25.
Luas Areal dan Produksi Tebu Perkebunan Rakyat Penghasil Gula
Merah Menurut Provinsi dan Keadaan Tanaman Tahun 2013
Table
Area and Brown Sugar Production of Smallholder by Province and
Tabel 26.
Luas Areal dan Produksi Tebu Perkebunan Rakyat Penghasil Gula
Merah Menurut Kabupaten dan Keadaan Tanaman Tahun 2013
Table
Area and Brown Sugar Production of Smallholder by District and
Tree Crops Classification, 2013...
32
Tabel 27.
Luas Areal dan Produksi Tebu Perkebunan Rakyat Penghasil Gula
Merah Menurut Provinsi dan Keadaan Tanaman Tahun 2014*)
Table
Area and Brown Sugar Production of Smallholder by Province and
Tree Crops Classification, 2014*) ...
35
Tabel 28.
Luas Areal dan Produksi Tebu Perkebunan Rakyat Penghasil Gula
Merah Menurut Provinsi dan Keadaan Tanaman Tahun 2015**)
Table
Area and Brown Sugar Production of Smallholder by Province and
Tree Crops Classification, 2015**) ...
36
Tabel 29.
Volume dan Nilai Ekspor - Impor Tebu Menurut Negara Tujuan dan
Asal Tahun 2013
Table
Export - Import Volume and Value of Sugar Cane by Destination and
Origin Country, 2013 ...
37
Tabel 30.
Perkembangan Harga Bulanan Komoditi Gula Tebu di Pasar Dalam
Negeri Tahun 1997-2013
Table
Monthly Price of Sugar Cane Commodities in Domestic
Market, 1997 - 2013 ...
39
Tabel 31.
Perkembangan Harga Bulanan Gula Mentah di Pasar Dunia
Tahun 2006-2013
Table
Monthly Price of Raw Sugar Commodities In World
Gambar 1. Perbandingan Luas Areal dan Produksi Tebu Menurut Status Pengusahaan
Tahun 2013
Gambar 2. Perkembangan Luas Areal, Produksi, Produktivitas dan Volume Ekspor-Impor
Tebu Tahun 2009 - 2013
Figure
Area, Production, Productivity and Export-Import Volume Trend Graph of Sugar
Cane, 2009 - 2013
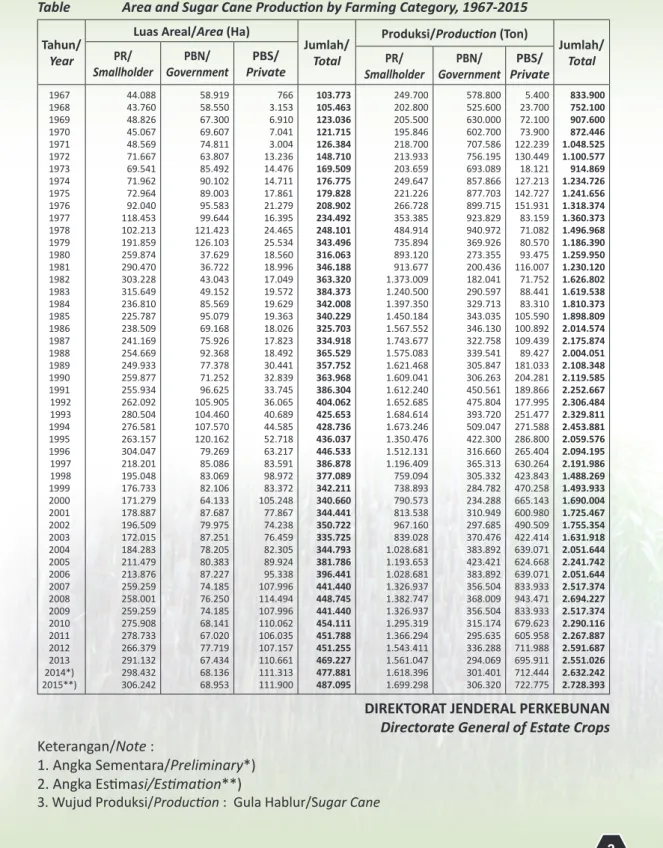
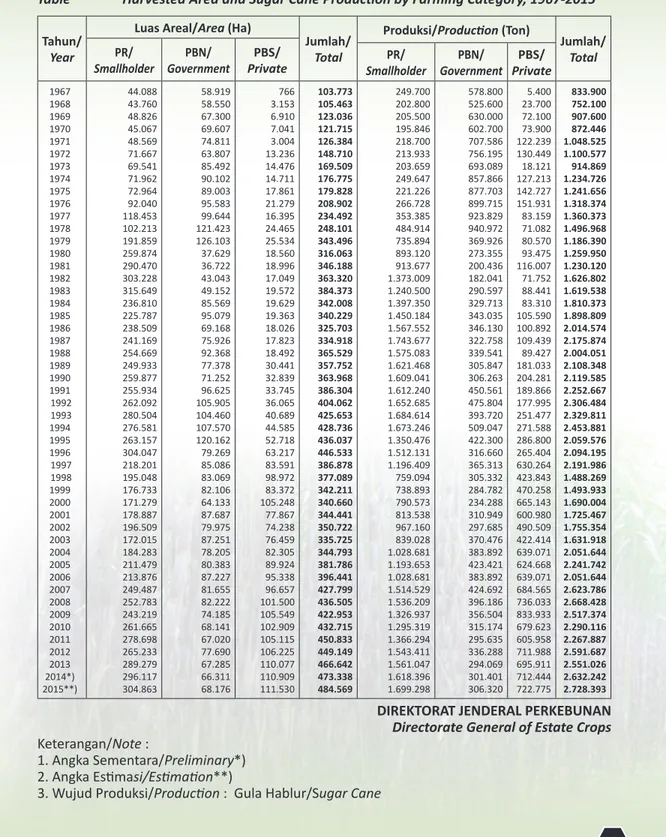
Tabel 1.
Luas Areal dan Produksi Tebu Menurut Status Pengusahaan Tahun 1967-2015
Table
Area and Sugar Cane Production by Farming Category, 1967-2015
Tahun/
Year
Luas Areal/Area (Ha)
Jumlah/
Total
Produksi/Production (Ton)
Jumlah/
Total
PR/
Smallholder
Government
PBN/
Private
PBS/
Smallholder
PR/
Government
PBN/
Private
PBS/
1967 1968 1969 1970 1971 1972 1973 1974 1975 1976 1977 1978 1979 1980 1981 1982 1983 1984 1985 1986 1987 1988 1989 1990 1991 1992 1993 1994 1995 1996 1997 1998 1999 2000 2001 2002 2003 2004 2005 2006 2007 2008 2009 2010 2011 2012 2013 2014*) 2015**) 44.088 43.760 48.826 45.067 48.569 71.667 69.541 71.962 72.964 92.040 118.453 102.213 191.859 259.874 290.470 303.228 315.649 236.810 225.787 238.509 241.169 254.669 249.933 259.877 255.934 262.092 280.504 276.581 263.157 304.047 218.201 195.048 176.733 171.279 178.887 196.509 172.015 184.283 211.479 213.876 259.259 258.001 259.259 275.908 278.733 266.379 291.132 298.432 306.242 58.919 58.550 67.300 69.607 74.811 63.807 85.492 90.102 89.003 95.583 99.644 121.423 126.103 37.629 36.722 43.043 49.152 85.569 95.079 69.168 75.926 92.368 77.378 71.252 96.625 105.905 104.460 107.570 120.162 79.269 85.086 83.069 82.106 64.133 87.687 79.975 87.251 78.205 80.383 87.227 74.185 76.250 74.185 68.141 67.020 77.719 67.434 68.136 68.953 766 3.153 6.910 7.041 3.004 13.236 14.476 14.711 17.861 21.279 16.395 24.465 25.534 18.560 18.996 17.049 19.572 19.629 19.363 18.026 17.823 18.492 30.441 32.839 33.745 36.065 40.689 44.585 52.718 63.217 83.591 98.972 83.372 105.248 77.867 74.238 76.459 82.305 89.924 95.338 107.996 114.494 107.996 110.062 106.035 107.157 110.661 111.313 111.900 103.773 105.463 123.036 121.715 126.384 148.710 169.509 176.775 179.828 208.902 234.492 248.101 343.496 316.063 346.188 363.320 384.373 342.008 340.229 325.703 334.918 365.529 357.752 363.968 386.304 404.062 425.653 428.736 436.037 446.533 386.878 377.089 342.211 340.660 344.441 350.722 335.725 344.793 381.786 396.441 441.440 448.745 441.440 454.111 451.788 451.255 469.227 477.881 487.095 249.700 202.800 205.500 195.846 218.700 213.933 203.659 249.647 221.226 266.728 353.385 484.914 735.894 893.120 913.677 1.373.009 1.240.500 1.397.350 1.450.184 1.567.552 1.743.677 1.575.083 1.621.468 1.609.041 1.612.240 1.652.685 1.684.614 1.673.246 1.350.476 1.512.131 1.196.409 759.094 738.893 790.573 813.538 967.160 839.028 1.028.681 1.193.653 1.028.681 1.326.937 1.382.747 1.326.937 1.295.319 1.366.294 1.543.411 1.561.047 1.618.396 1.699.298 578.800 525.600 630.000 602.700 707.586 756.195 693.089 857.866 877.703 899.715 923.829 940.972 369.926 273.355 200.436 182.041 290.597 329.713 343.035 346.130 322.758 339.541 305.847 306.263 450.561 475.804 393.720 509.047 422.300 316.660 365.313 305.332 284.782 234.288 310.949 297.685 370.476 383.892 423.421 383.892 356.504 368.009 356.504 315.174 295.635 336.288 294.069 301.401 306.320 5.400 23.700 72.100 73.900 122.239 130.449 18.121 127.213 142.727 151.931 83.159 71.082 80.570 93.475 116.007 71.752 88.441 83.310 105.590 100.892 109.439 89.427 181.033 204.281 189.866 177.995 251.477 271.588 286.800 265.404 630.264 423.843 470.258 665.143 600.980 490.509 422.414 639.071 624.668 639.071 833.933 943.471 833.933 679.623 605.958 711.988 695.911 712.444 722.775 833.900 752.100 907.600 872.446 1.048.525 1.100.577 914.869 1.234.726 1.241.656 1.318.374 1.360.373 1.496.968 1.186.390 1.259.950 1.230.120 1.626.802 1.619.538 1.810.373 1.898.809 2.014.574 2.175.874 2.004.051 2.108.348 2.119.585 2.252.667 2.306.484 2.329.811 2.453.881 2.059.576 2.094.195 2.191.986 1.488.269 1.493.933 1.690.004 1.725.467 1.755.354 1.631.918 2.051.644 2.241.742 2.051.644 2.517.374 2.694.227 2.517.374 2.290.116 2.267.887 2.591.687 2.551.026 2.632.242 2.728.393
DIREKTORAT JENDERAL PERKEBUNAN
Directorate General of Estate Crops
Keterangan/Note :
1. Angka Sementara/Preliminary*)
2. Angka Estimasi/Estimation**)
Tabel 2.
Luas Panen dan Produksi Tebu Menurut Status Pengusahaan Tahun 1967-2015
Table
Harvested Area and Sugar Cane Production by Farming Category, 1967-2015
Tahun/
Year
Luas Areal/Area (Ha)
Jumlah/
Total
Produksi/Production (Ton)
Jumlah/
Total
PR/
Smallholder
Government
PBN/
Private
PBS/
Smallholder
PR/
Government
PBN/
Private
PBS/
1967 1968 1969 1970 1971 1972 1973 1974 1975 1976 1977 1978 1979 1980 1981 1982 1983 1984 1985 1986 1987 1988 1989 1990 1991 1992 1993 1994 1995 1996 1997 1998 1999 2000 2001 2002 2003 2004 2005 2006 2007 2008 2009 2010 2011 2012 2013 2014*) 2015**) 44.088 43.760 48.826 45.067 48.569 71.667 69.541 71.962 72.964 92.040 118.453 102.213 191.859 259.874 290.470 303.228 315.649 236.810 225.787 238.509 241.169 254.669 249.933 259.877 255.934 262.092 280.504 276.581 263.157 304.047 218.201 195.048 176.733 171.279 178.887 196.509 172.015 184.283 211.479 213.876 249.487 252.783 243.219 261.665 278.698 265.233 289.279 296.117 304.863 58.919 58.550 67.300 69.607 74.811 63.807 85.492 90.102 89.003 95.583 99.644 121.423 126.103 37.629 36.722 43.043 49.152 85.569 95.079 69.168 75.926 92.368 77.378 71.252 96.625 105.905 104.460 107.570 120.162 79.269 85.086 83.069 82.106 64.133 87.687 79.975 87.251 78.205 80.383 87.227 81.655 82.222 74.185 68.141 67.020 77.690 67.285 66.311 68.176 766 3.153 6.910 7.041 3.004 13.236 14.476 14.711 17.861 21.279 16.395 24.465 25.534 18.560 18.996 17.049 19.572 19.629 19.363 18.026 17.823 18.492 30.441 32.839 33.745 36.065 40.689 44.585 52.718 63.217 83.591 98.972 83.372 105.248 77.867 74.238 76.459 82.305 89.924 95.338 96.657 101.500 105.549 102.909 105.115 106.225 110.077 110.909 111.530 103.773 105.463 123.036 121.715 126.384 148.710 169.509 176.775 179.828 208.902 234.492 248.101 343.496 316.063 346.188 363.320 384.373 342.008 340.229 325.703 334.918 365.529 357.752 363.968 386.304 404.062 425.653 428.736 436.037 446.533 386.878 377.089 342.211 340.660 344.441 350.722 335.725 344.793 381.786 396.441 427.799 436.505 422.953 432.715 450.833 449.149 466.642 473.338 484.569 249.700 202.800 205.500 195.846 218.700 213.933 203.659 249.647 221.226 266.728 353.385 484.914 735.894 893.120 913.677 1.373.009 1.240.500 1.397.350 1.450.184 1.567.552 1.743.677 1.575.083 1.621.468 1.609.041 1.612.240 1.652.685 1.684.614 1.673.246 1.350.476 1.512.131 1.196.409 759.094 738.893 790.573 813.538 967.160 839.028 1.028.681 1.193.653 1.028.681 1.514.529 1.536.209 1.326.937 1.295.319 1.366.294 1.543.411 1.561.047 1.618.396 1.699.298 578.800 525.600 630.000 602.700 707.586 756.195 693.089 857.866 877.703 899.715 923.829 940.972 369.926 273.355 200.436 182.041 290.597 329.713 343.035 346.130 322.758 339.541 305.847 306.263 450.561 475.804 393.720 509.047 422.300 316.660 365.313 305.332 284.782 234.288 310.949 297.685 370.476 383.892 423.421 383.892 424.692 396.186 356.504 315.174 295.635 336.288 294.069 301.401 306.320 5.400 23.700 72.100 73.900 122.239 130.449 18.121 127.213 142.727 151.931 83.159 71.082 80.570 93.475 116.007 71.752 88.441 83.310 105.590 100.892 109.439 89.427 181.033 204.281 189.866 177.995 251.477 271.588 286.800 265.404 630.264 423.843 470.258 665.143 600.980 490.509 422.414 639.071 624.668 639.071 684.565 736.033 833.933 679.623 605.958 711.988 695.911 712.444 722.775 833.900 752.100 907.600 872.446 1.048.525 1.100.577 914.869 1.234.726 1.241.656 1.318.374 1.360.373 1.496.968 1.186.390 1.259.950 1.230.120 1.626.802 1.619.538 1.810.373 1.898.809 2.014.574 2.175.874 2.004.051 2.108.348 2.119.585 2.252.667 2.306.484 2.329.811 2.453.881 2.059.576 2.094.195 2.191.986 1.488.269 1.493.933 1.690.004 1.725.467 1.755.354 1.631.918 2.051.644 2.241.742 2.051.644 2.623.786 2.668.428 2.517.374 2.290.116 2.267.887 2.591.687 2.551.026 2.632.242 2.728.393
DIREKTORAT JENDERAL PERKEBUNAN
Directorate General of Estate Crops
Keterangan/Note :
1. Angka Sementara/Preliminary*)
2. Angka Estimasi/Estimation**)
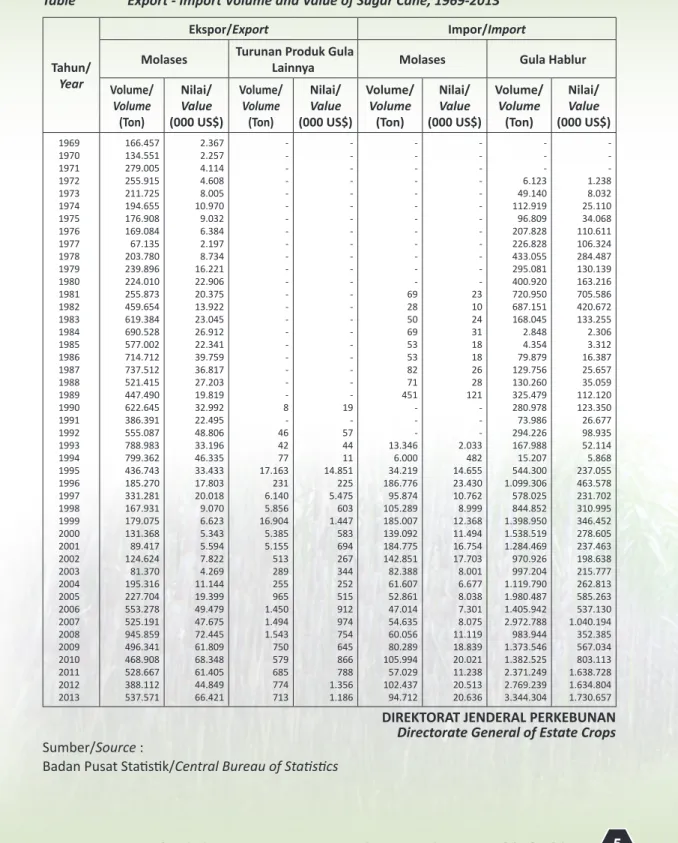
Tabel 3.
Volume dan Nilai Ekspor - Impor Tebu Tahun 1969-2013
Table
Export - Import Volume and Value of Sugar Cane, 1969-2013
Tahun/
Year
Ekspor/Export
Impor/Import
Molases
Turunan Produk Gula
Lainnya
Molases
Gula Hablur
Volume/
Volume
(Ton)
Nilai/
Value
(000 US$)
Volume/
Volume
(Ton)
Nilai/
Value
(000 US$)
Volume/
Volume
(Ton)
Nilai/
Value
(000 US$)
Volume/
Volume
(Ton)
Nilai/
Value
(000 US$)
1969 1970 1971 1972 1973 1974 1975 1976 1977 1978 1979 1980 1981 1982 1983 1984 1985 1986 1987 1988 1989 1990 1991 1992 1993 1994 1995 1996 1997 1998 1999 2000 2001 2002 2003 2004 2005 2006 2007 2008 2009 2010 2011 2012 2013 166.457 134.551 279.005 255.915 211.725 194.655 176.908 169.084 67.135 203.780 239.896 224.010 255.873 459.654 619.384 690.528 577.002 714.712 737.512 521.415 447.490 622.645 386.391 555.087 788.983 799.362 436.743 185.270 331.281 167.931 179.075 131.368 89.417 124.624 81.370 195.316 227.704 553.278 525.191 945.859 496.341 468.908 528.667 388.112 537.571 2.367 2.257 4.114 4.608 8.005 10.970 9.032 6.384 2.197 8.734 16.221 22.906 20.375 13.922 23.045 26.912 22.341 39.759 36.817 27.203 19.819 32.992 22.495 48.806 33.196 46.335 33.433 17.803 20.018 9.070 6.623 5.343 5.594 7.822 4.269 11.144 19.399 49.479 47.675 72.445 61.809 68.348 61.405 44.849 66.421 - - - - - - - - - - - - - - - - - - - - - 8 - 46 42 77 17.163 231 6.140 5.856 16.904 5.385 5.155 513 289 255 965 1.450 1.494 1.543 750 579 685 774 713 - - - - - - - - - - - - - - - - - - - - - 19 - 57 44 11 14.851 225 5.475 603 1.447 583 694 267 344 252 515 912 974 754 645 866 788 1.356 1.186 - - - - - - - - - - - - 69 28 50 69 53 53 82 71 451 - - - 13.346 6.000 34.219 186.776 95.874 105.289 185.007 139.092 184.775 142.851 82.388 61.607 52.861 47.014 54.635 60.056 80.289 105.994 57.029 102.437 94.712 - - - - - - - - - - - - 23 10 24 31 18 18 26 28 121 - - - 2.033 482 14.655 23.430 10.762 8.999 12.368 11.494 16.754 17.703 8.001 6.677 8.038 7.301 8.075 11.119 18.839 20.021 11.238 20.513 20.636 - - - 6.123 49.140 112.919 96.809 207.828 226.828 433.055 295.081 400.920 720.950 687.151 168.045 2.848 4.354 79.879 129.756 130.260 325.479 280.978 73.986 294.226 167.988 15.207 544.300 1.099.306 578.025 844.852 1.398.950 1.538.519 1.284.469 970.926 997.204 1.119.790 1.980.487 1.405.942 2.972.788 983.944 1.373.546 1.382.525 2.371.249 2.769.239 3.344.304 - - - 1.238 8.032 25.110 34.068 110.611 106.324 284.487 130.139 163.216 705.586 420.672 133.255 2.306 3.312 16.387 25.657 35.059 112.120 123.350 26.677 98.935 52.114 5.868 237.055 463.578 231.702 310.995 346.452 278.605 237.463 198.638 215.777 262.813 585.263 537.130 1.040.194 352.385 567.034 803.113 1.638.728 1.634.804 1.730.657DIREKTORAT JENDERAL PERKEBUNAN
Directorate General of Estate Crops
Sumber/Source :
Tabel 4.
Luas Tanam dan Produksi Tebu Menurut Provinsi dan Status Pengusahaan Tahun 2013
Table
Planted Area and Sugar Cane Production by Province and Farming Category, 2013
No.
Provinsi/Province
Perkebunan Rakyat
Smallholder
Perkebunan Negara
Government
Perkebunan Swasta
Private
Jumlah/Total
Tanam
Planted
(Ha)
Produksi
Production
(Ton)
Tanam
Planted
(Ha)
Produksi
Production
(Ton)
Tanam
Planted
(Ha)
Produksi
Production
(Ton)
Tanam
Planted
(Ha)
Produksi
Production
(Ton)
1. 2. 3. 4. 5. 6. 7. 8. 9. 10. ACEH SUMATERA UTARA SUMATERA BARAT R I A U KEPULAUAN RIAU J A M B I SUMATERA SELATAN KEP. BANGKA BELITUNG BENGKULU LAMPUNG - 2.252 - - - - 591 - - 12.014 - 7.855 - - - - 1.213 - - 75.408 - 7.283 - - - - 10.511 - - 10.783 - 29.485 - - - - 41.222 - - 54.651 - - - - - - 10.491 - - 93.400 - - - - - - 51.447 - - 614.852 - 9.535 - - - - 21.592 - - 116.197 - 37.340 - - - - 93.882 - - 744.911 WILAYAH SUMATERA 14.857 84.477 28.577 125.358 103.891 666.299 147.325 876.133 11. 12. 13. 14. 15. 16. DKI. JAKARTA JAWA BARAT BANTEN JAWA TENGAH D.I. YOGYAKARTA JAWA TIMUR - 10.399 - 64.969 3.577 193.431 - 46.841 - 263.985 15.868 1.140.187 - 11.419 - 537 - 18.024 - 45.222 - 2.033 - 96.637 - - - 1.009 - - - - - 4.854 - - - 21.818 - 66.515 3.577 211.454 - 92.063 - 270.873 15.868 1.236.824 WILAYAH JAWA 272.375 1.466.881 29.979 143.892 1.009 4.854 303.363 1.615.627 17. 18. 19. B A L INUSA TENGGARA BARAT NUSA TENGGARA TIMUR
- - - - - - - - - - - - - - - - - - - - - - - - WILAYAH NUSA TENGGARA & BALI - - - - - - - - 20. 21. 22. 23. KALIMANTAN BARAT KALIMANTAN TENGAH KALIMANTAN SELATAN KALIMANTAN TIMUR - - - - - - - - - - - - - - - - - - - - - - - - - - - - - - - - WILAYAH KALIMANTAN - - - - - - - - 24. 25. 26. 27. 28. 29. SULAWESI UTARA GORONTALO SULAWESI TENGAH SULAWESI SELATAN SULAWESI BARAT SULAWESI TENGGARA - 1.031 - 2.868 - - - 3.168 - 6.521 - - - - - 8.878 - - - - - 24.819 - - - 5.762 - - - - - 24.758 - - - - - 6.793 - 11.746 - - 27.926 - 31.340 - WILAYAH SULAWESI 3.899 9.689 8.878 24.819 5.762 24.758 18.539 59.265 30. 31. 32. 33. M A L U K U MALUKU UTARA PAPUA PAPUA BARAT - - -- - - -- - - - - -- - - -- - - -- - - -- - - -- WILAYAH MALUKU & PAPUA - - - - - - - - I N D O N E S I A 291.132 1.561.047 67.434 294.069 110.661 695.911 469.227 2.551.026
DIREKTORAT JENDERAL PERKEBUNAN
Directorate General of Estate Crops
Keterangan/Note :
1. Angka Tetap/Fixed
Tabel 5.
Luas Tanam dan Produksi Tebu Menurut Provinsi dan Status Pengusahaan Tahun 2014*)
Table
Planted Area and Sugar Cane Production by Province and Farming Category, 2014*)
No.
Provinsi/Province
Perkebunan Rakyat
Smallholder
Perkebunan Negara
Government
Perkebunan Swasta
Private
Jumlah/Total
Tanam
Planted
(Ha)
Produksi
Production
(Ton)
Tanam
Planted
(Ha)
Produksi
Production
(Ton)
Tanam
Planted
(Ha)
Produksi
Production
(Ton)
Tanam
Planted
(Ha)
Produksi
Production
(Ton)
1. 2. 3. 4. 5. 6. 7. 8. 9. 10. ACEH SUMATERA UTARA SUMATERA BARAT R I A U KEPULAUAN RIAU J A M B I SUMATERA SELATAN KEP. BANGKA BELITUNG BENGKULU LAMPUNG - 2.560 - - - - 599 - - 12.132 - 9.008 - - - - 1.597 - - 76.981 - 7.386 - - - - 10.815 - - 10.850 - 30.011 - - - - 44.453 - - 57.505 - - - - - - 10.618 - - 93.415 - - - - - - 51.599 - - 630.260 - 9.946 - - - - 22.032 - - 116.397 - 39.019 - - - - 97.650 - - 764.746 WILAYAH SUMATERA 15.291 87.586 29.051 131.969 104.033 681.859 148.375 901.414 11. 12. 13. 14. 15. 16. DKI. JAKARTA JAWA BARAT BANTEN JAWA TENGAH D.I. YOGYAKARTA JAWA TIMUR - 10.478 - 70.863 3.587 194.057 - 48.874 - 288.488 16.476 1.165.419 - 11.506 - 585 - 18.082 - 45.241 - 2.127 - 97.053 - - - 1.100 - - - - - 4.975 - - - 21.984 - 72.548 3.587 212.139 - 94.116 - 295.590 16.476 1.262.473 WILAYAH JAWA 278.985 1.519.258 30.173 144.421 1.100 4.975 310.258 1.668.655 17. 18. 19. B A L INUSA TENGGARA BARAT NUSA TENGGARA TIMUR
- - - - - - - - - - - - - - - - - - - - - - - - WILAYAH NUSA TENGGARA & BALI - - - - - - - - 20. 21. 22. 23. KALIMANTAN BARAT KALIMANTAN TENGAH KALIMANTAN SELATAN KALIMANTAN TIMUR - - - - - - - - - - - - - - - - - - - - - - - - - - - - - - - - WILAYAH KALIMANTAN - - - - - - - - 24. 25. 26. 27. 28. 29. SULAWESI UTARA GORONTALO SULAWESI TENGAH SULAWESI SELATAN SULAWESI BARAT SULAWESI TENGGARA - 1.177 - 2.979 - - - 3.650 - 7.902 - - - - - 8.912 - - - - - 25.011 - - - 6.180 - - - - - 25.610 - - - - - 7.357 - 11.891 - - - 29.260 - 32.913 - - WILAYAH SULAWESI 4.156 11.552 8.912 25.011 6.180 25.610 19.247 62.173 30. 31. 32. 33. M A L U K U MALUKU UTARA PAPUA PAPUA BARAT - - -- - - -- - - - - -- - - -- - - -- - - -- - - -- WILAYAH MALUKU & PAPUA - - - - - - - - I N D O N E S I A 298.432 1.618.396 68.136 301.401 111.313 712.444 477.881 2.632.242
DIREKTORAT JENDERAL PERKEBUNAN
Directorate General of Estate Crops
Keterangan/Note :
1. Angka Sementara/Preliminary*)
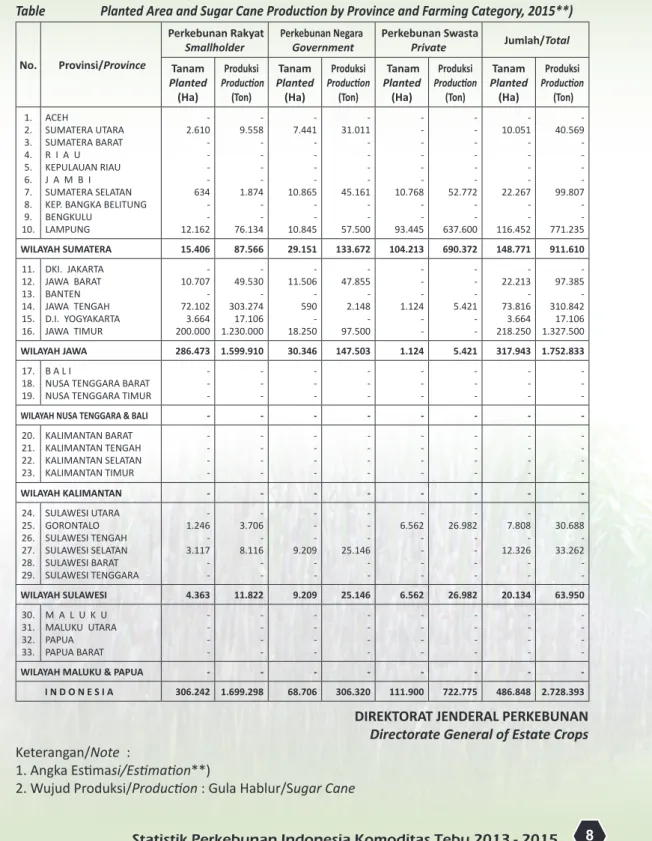
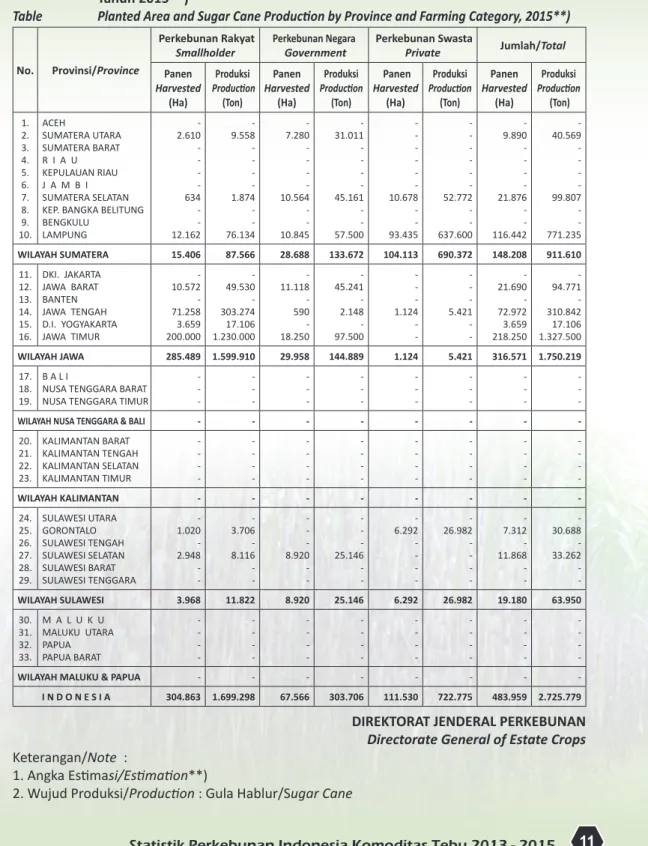
Tabel 6.
Luas Tanam dan Produksi Tebu Menurut Provinsi dan Status Pengusahaan
Tahun 2015**)
Table
Planted Area and Sugar Cane Production by Province and Farming Category, 2015**)
No.
Provinsi/Province
Perkebunan Rakyat
Smallholder
Perkebunan Negara
Government
Perkebunan Swasta
Private
Jumlah/Total
Tanam
Planted
(Ha)
Produksi
Production
(Ton)
Tanam
Planted
(Ha)
Produksi
Production
(Ton)
Tanam
Planted
(Ha)
Produksi
Production
(Ton)
Tanam
Planted
(Ha)
Produksi
Production
(Ton)
1. 2. 3. 4. 5. 6. 7. 8. 9. 10. ACEH SUMATERA UTARA SUMATERA BARAT R I A U KEPULAUAN RIAU J A M B I SUMATERA SELATAN KEP. BANGKA BELITUNG BENGKULU LAMPUNG - 2.610 - - - - 634 - - 12.162 - 9.558 - - - - 1.874 - - 76.134 - 7.441 - - - - 10.865 - - 10.845 - 31.011 - - - - 45.161 - - 57.500 - - - - - - 10.768 - - 93.445 - - - - - - 52.772 - - 637.600 - 10.051 - - - - 22.267 - - 116.452 - 40.569 - - - - 99.807 - - 771.235 WILAYAH SUMATERA 15.406 87.566 29.151 133.672 104.213 690.372 148.771 911.610 11. 12. 13. 14. 15. 16. DKI. JAKARTA JAWA BARAT BANTEN JAWA TENGAH D.I. YOGYAKARTA JAWA TIMUR - 10.707 - 72.102 3.664 200.000 - 49.530 - 303.274 17.106 1.230.000 - 11.506 - 590 - 18.250 - 47.855 - 2.148 - 97.500 - - - 1.124 - - - - - 5.421 - - - 22.213 - 73.816 3.664 218.250 - 97.385 - 310.842 17.106 1.327.500 WILAYAH JAWA 286.473 1.599.910 30.346 147.503 1.124 5.421 317.943 1.752.833 17. 18. 19. B A L INUSA TENGGARA BARAT NUSA TENGGARA TIMUR
- - - - - - - - - - - - - - - - - - - - - - - - WILAYAH NUSA TENGGARA & BALI - - - - - - - - 20. 21. 22. 23. KALIMANTAN BARAT KALIMANTAN TENGAH KALIMANTAN SELATAN KALIMANTAN TIMUR - - - - - - - - - - - - - - - - - - - - - - - - - - - - - - - - WILAYAH KALIMANTAN - - - - - - - - 24. 25. 26. 27. 28. 29. SULAWESI UTARA GORONTALO SULAWESI TENGAH SULAWESI SELATAN SULAWESI BARAT SULAWESI TENGGARA - 1.246 - 3.117 - - - 3.706 - 8.116 - - - - - 9.209 - - - - - 25.146 - - - 6.562 - - - - - 26.982 - - - - - 7.808 - 12.326 - - - 30.688 - 33.262 - - WILAYAH SULAWESI 4.363 11.822 9.209 25.146 6.562 26.982 20.134 63.950 30. 31. 32. 33. M A L U K U MALUKU UTARA PAPUA PAPUA BARAT - - -- - - -- - - - - -- - - -- - - -- - - -- - - -- WILAYAH MALUKU & PAPUA - - - - - - - - I N D O N E S I A 306.242 1.699.298 68.706 306.320 111.900 722.775 486.848 2.728.393
DIREKTORAT JENDERAL PERKEBUNAN
Directorate General of Estate Crops
Keterangan/Note :
1. Angka Estimasi/Estimation**)
Tabel 7.
Luas Panen dan Produksi Tebu Menurut Provinsi dan Status Pengusahaan Tahun 2013
Table
Harvested Area and Sugar Cane Production by Province and Farming Category, 2013
No. Provinsi/Province
Perkebunan Rakyat
Smallholder
Perkebunan Negara
Government
Perkebunan Swasta
Private
Jumlah/Total
Panen
Harvested
(Ha)
Produksi
Production
(Ton)
Panen
Harvested
(Ha)
Produksi
Production
(Ton)
Panen
Harvested
(Ha)
Produksi
Production
(Ton)
Panen
Harvested
(Ha)
Produksi
Production
(Ton)
1. 2. 3. 4. 5. 6. 7. 8. 9. 10. ACEH SUMATERA UTARA SUMATERA BARAT R I A U KEPULAUAN RIAU J A M B I SUMATERA SELATAN KEP. BANGKA BELITUNG BENGKULU LAMPUNG - 2.222 - - - - 589 - - 11.944 - 7.855 - - - - 1.213 - - 75.408 - 7.198 - - - - 10.511 - - 10.730 - 29.485 - - - - 41.222 - - 54.651 - - - - - - 10.450 - - 92.855 - - - - - - 51.447 - - 614.852 - 9.419 - - - - 21.550 - - 115.529 - 37.340 - - - - 93.882 - - 744.911 WILAYAH SUMATERA 14.755 84.477 28.439 125.358 103.305 666.299 146.499 876.133 11. 12. 13. 14. 15. 16. DKI. JAKARTA JAWA BARAT BANTEN JAWA TENGAH D.I. YOGYAKARTA JAWA TIMUR - 10.372 - 63.387 3.576 193.381 - 46.841 - 263.985 15.868 1.140.187 - 11.415 - 536 - 18.017 - 45.222 - 2.033 - 96.637 - - - 1.008 - - - - - 4.854 - - - 21.787 - 64.932 3.576 211.398 - 92.063 - 270.873 15.868 1.236.824 WILAYAH JAWA 270.716 1.466.881 29.969 143.892 1.008 4.854 301.693 1.615.627 17. 18. 19. B A L INUSA TENGGARA BARAT NUSA TENGGARA TIMUR
- - - - - - - - - - - - - - - - - - - - - - - - WILAYAH NUSA TENGGARA & BALI - - - - - - - - 20. 21. 22. 23. KALIMANTAN BARAT KALIMANTAN TENGAH KALIMANTAN SELATAN KALIMANTAN TIMUR - - - - - - - - - - - - - - - - - - - - - - - - - - - - - - - - WILAYAH KALIMANTAN - - - - - - - - 24. 25. 26. 27. 28. 29. SULAWESI UTARA GORONTALO SULAWESI TENGAH SULAWESI SELATAN SULAWESI BARAT SULAWESI TENGGARA - 1.025 - 2.784 - - - 3.168 - 6.521 - - - - - 8.878 - - - - - 24.819 - - - 5.764 - - - - - 24.758 - - - - - 6.788 - 11.662 - - - 27.926 - 31.340 - - WILAYAH SULAWESI 3.809 9.689 8.878 24.819 5.764 24.758 18.451 59.265 30. 31. 32. 33. M A L U K U MALUKU UTARA PAPUA PAPUA BARAT - - - - -- - - - - -- - - - - -- - - -- - - -- WILAYAH MALUKU & PAPUA - - - - I N D O N E S I A 289.279 1.561.047 67.285 294.069 110.077 695.911 466.642 2.551.026
DIREKTORAT JENDERAL PERKEBUNAN
Directorate General of Estate Crops
Keterangan/Note :
1. Angka Tetap/Fixed
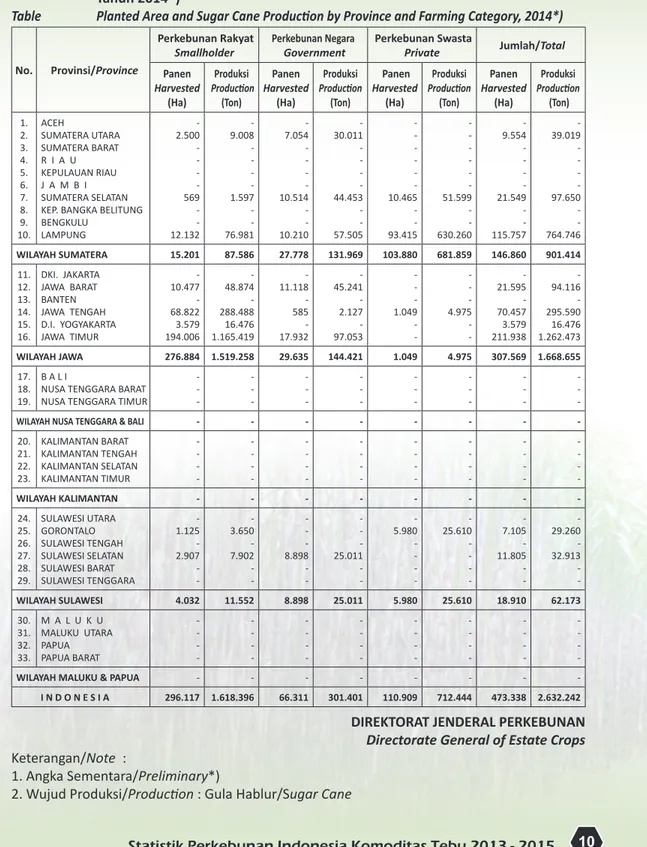
Tabel 8.
Luas Tanam dan Produksi Tebu Menurut Provinsi dan Status Pengusahaan
Tahun 2014*)
Table
Planted Area and Sugar Cane Production by Province and Farming Category, 2014*)
No. Provinsi/Province
Perkebunan Rakyat
Smallholder
Perkebunan Negara
Government
Perkebunan Swasta
Private
Jumlah/Total
Panen
Harvested
(Ha)
Produksi
Production
(Ton)
Panen
Harvested
(Ha)
Produksi
Production
(Ton)
Panen
Harvested
(Ha)
Produksi
Production
(Ton)
Panen
Harvested
(Ha)
Produksi
Production
(Ton)
1. 2. 3. 4. 5. 6. 7. 8. 9. 10. ACEH SUMATERA UTARA SUMATERA BARAT R I A U KEPULAUAN RIAU J A M B I SUMATERA SELATAN KEP. BANGKA BELITUNG BENGKULU LAMPUNG - 2.500 - - - - 569 - - 12.132 - 9.008 - - - - 1.597 - - 76.981 - 7.054 - - - - 10.514 - - 10.210 - 30.011 - - - - 44.453 - - 57.505 - - - - - - 10.465 - - 93.415 - - - - - - 51.599 - - 630.260 - 9.554 - - - - 21.549 - - 115.757 - 39.019 - - - - 97.650 - - 764.746 WILAYAH SUMATERA 15.201 87.586 27.778 131.969 103.880 681.859 146.860 901.414 11. 12. 13. 14. 15. 16. DKI. JAKARTA JAWA BARAT BANTEN JAWA TENGAH D.I. YOGYAKARTA JAWA TIMUR - 10.477 - 68.822 3.579 194.006 - 48.874 - 288.488 16.476 1.165.419 - 11.118 - 585 - 17.932 - 45.241 - 2.127 - 97.053 - - - 1.049 - - - - - 4.975 - - - 21.595 - 70.457 3.579 211.938 - 94.116 - 295.590 16.476 1.262.473 WILAYAH JAWA 276.884 1.519.258 29.635 144.421 1.049 4.975 307.569 1.668.655 17. 18. 19. B A L INUSA TENGGARA BARAT NUSA TENGGARA TIMUR
- - - - - - - - - - - - - - - - - - - - - - - - WILAYAH NUSA TENGGARA & BALI - - - - - - - - 20. 21. 22. 23. KALIMANTAN BARAT KALIMANTAN TENGAH KALIMANTAN SELATAN KALIMANTAN TIMUR - - - - - - - - - - - - - - - - - - - - - - - - - - - - - - - - WILAYAH KALIMANTAN - - - - - - - - 24. 25. 26. 27. 28. 29. SULAWESI UTARA GORONTALO SULAWESI TENGAH SULAWESI SELATAN SULAWESI BARAT SULAWESI TENGGARA - 1.125 - 2.907 - - - 3.650 - 7.902 - - - - - 8.898 - - - - - 25.011 - - - 5.980 - - - - - 25.610 - - - - - 7.105 - 11.805 - - - 29.260 - 32.913 - - WILAYAH SULAWESI 4.032 11.552 8.898 25.011 5.980 25.610 18.910 62.173 30. 31. 32. 33. M A L U K U MALUKU UTARA PAPUA PAPUA BARAT - - - - -- - - - - -- - - - - -- - - -- - - -- WILAYAH MALUKU & PAPUA - - - - I N D O N E S I A 296.117 1.618.396 66.311 301.401 110.909 712.444 473.338 2.632.242
DIREKTORAT JENDERAL PERKEBUNAN
Directorate General of Estate Crops
Keterangan/Note :
1. Angka Sementara/Preliminary*)
Tabel 9.
Luas Tanam dan Produksi Tebu Menurut Provinsi dan Status Pengusahaan
Tahun 2015**)
Table
Planted Area and Sugar Cane Production by Province and Farming Category, 2015**)
No. Provinsi/Province
Perkebunan Rakyat
Smallholder
Perkebunan Negara
Government
Perkebunan Swasta
Private
Jumlah/Total
Panen
Harvested
(Ha)
Produksi
Production
(Ton)
Panen
Harvested
(Ha)
Produksi
Production
(Ton)
Panen
Harvested
(Ha)
Produksi
Production
(Ton)
Panen
Harvested
(Ha)
Produksi
Production
(Ton)
1. 2. 3. 4. 5. 6. 7. 8. 9. 10. ACEH SUMATERA UTARA SUMATERA BARAT R I A U KEPULAUAN RIAU J A M B I SUMATERA SELATAN KEP. BANGKA BELITUNG BENGKULU LAMPUNG - 2.610 - - - - 634 - - 12.162 - 9.558 - - - - 1.874 - - 76.134 - 7.280 - - - - 10.564 - - 10.845 - 31.011 - - - - 45.161 - - 57.500 - - - - - - 10.678 - - 93.435 - - - - - - 52.772 - - 637.600 - 9.890 - - - - 21.876 - - 116.442 - 40.569 - - - - 99.807 - - 771.235 WILAYAH SUMATERA 15.406 87.566 28.688 133.672 104.113 690.372 148.208 911.610 11. 12. 13. 14. 15. 16. DKI. JAKARTA JAWA BARAT BANTEN JAWA TENGAH D.I. YOGYAKARTA JAWA TIMUR - 10.572 - 71.258 3.659 200.000 - 49.530 - 303.274 17.106 1.230.000 - 11.118 - 590 - 18.250 - 45.241 - 2.148 - 97.500 - - - 1.124 - - - - - 5.421 - - - 21.690 - 72.972 3.659 218.250 - 94.771 - 310.842 17.106 1.327.500 WILAYAH JAWA 285.489 1.599.910 29.958 144.889 1.124 5.421 316.571 1.750.219 17. 18. 19. B A L INUSA TENGGARA BARAT NUSA TENGGARA TIMUR
- - - - - - - - - - - - - - - - - - - - - - - - WILAYAH NUSA TENGGARA & BALI - - - - - - - - 20. 21. 22. 23. KALIMANTAN BARAT KALIMANTAN TENGAH KALIMANTAN SELATAN KALIMANTAN TIMUR - - - - - - - - - - - - - - - - - - - - - - - - - - - - - - - - WILAYAH KALIMANTAN - - - - - - - - 24. 25. 26. 27. 28. 29. SULAWESI UTARA GORONTALO SULAWESI TENGAH SULAWESI SELATAN SULAWESI BARAT SULAWESI TENGGARA - 1.020 - 2.948 - - - 3.706 - 8.116 - - - - - 8.920 - - - - - 25.146 - - - 6.292 - - - - - 26.982 - - - - - 7.312 - 11.868 - - - 30.688 - 33.262 - - WILAYAH SULAWESI 3.968 11.822 8.920 25.146 6.292 26.982 19.180 63.950 30. 31. 32. 33. M A L U K U MALUKU UTARA PAPUA PAPUA BARAT - - - - -- - - - - -- - - - - -- - - -- - - -- WILAYAH MALUKU & PAPUA - - - - I N D O N E S I A 304.863 1.699.298 67.566 303.706 111.530 722.775 483.959 2.725.779
DIREKTORAT JENDERAL PERKEBUNAN
Directorate General of Estate Crops
Keterangan/Note :
1. Angka Estimasi/Estimation**)
Tabel 10.
Jumlah Luas Areal dan Produksi Tebu Perkebunan Rakyat, Besar Negara dan Besar
Swasta (PR+PBN+PBS) Menurut Provinsi dan Keadaan Tanaman Tahun 2013
Table
Area and Sugar Cane Production of Smallholder, Government and Private Estate
by Province and Tree Crops Classification, 2013
No.
Provinsi/Province
Luas Areal/Area (Ha)
Produksi
Production
(Ton)
Produktivitas/
Productivity
(Kg/Ha)
Jumlah
Petani/
Farmers
(KK)
Jumlah
Tenaga Kerja/
Farmers
(TK)
Tanam/
Planted
Harvested
Panen/
1. 2. 3. 4. 5. 6. 7. 8. 9. 10. ACEH SUMATERA UTARA SUMATERA BARAT R I A U KEPULAUAN RIAU J A M B I SUMATERA SELATAN KEP. BANGKA BELITUNG BENGKULU LAMPUNG - 9.535 - - - - 21.592 - - 116.197 - 9.419 - - - - 21.550 - - 115.529 - 37.340 - - - - 93.882 - - 744.911 - 3.964 - - - - 4.356 - - 6.448 - 1.280 - - - - 255 - - 17.163 - 12.428 - - - - 20.238 - - 156.205 WILAYAH SUMATERA 147.325 146.499 876.133 5.980 18.698 188.871 11. 12. 13. 14. 15. 16. DKI. JAKARTA JAWA BARAT BANTEN JAWA TENGAH D.I. YOGYAKARTA JAWA TIMUR - 21.818 - 66.515 3.577 211.454 - 21.787 - 64.932 3.576 211.398 - 92.063 - 270.873 15.868 1.236.824 - 4.226 - 4.172 4.438 5.851 - 9.758 - 80.636 15.634 673.324 - 16.591 - 1.827 - 29.870 WILAYAH JAWA 303.363 301.693 1.615.627 5.355 779.352 48.288 17. 18. 19. B A L I
NUSA TENGGARA BARAT NUSA TENGGARA TIMUR
- - - - - - - - - - - - - - - - - - WILAYAH NUSA TENGGARA & BALI - - - - - - 20. 21. 22. 23. KALIMANTAN BARAT KALIMANTAN TENGAH KALIMANTAN SELATAN KALIMANTAN TIMUR - - - - - - - - - - - - - - - - - - - - - - - - WILAYAH KALIMANTAN - - - - - - 24. 25. 26. 27. 28. 29. SULAWESI UTARA GORONTALO SULAWESI TENGAH SULAWESI SELATAN SULAWESI BARAT SULAWESI TENGGARA - 6.793 - 11.746 - - - 6.788 - 11.662 - - - 27.926 - 31.340 - - - 4.114 - 2.687 - - - 6.053 - 1.569 - - - 10.402 - 14.789 - - WILAYAH SULAWESI 18.539 18.451 59.265 3.212 7.622 25.191 30. 31. 32. 33. M A L U K U MALUKU UTARA PAPUA PAPUA BARAT - - -- - - -- - - -- - - -- - - -- - - -- WILAYAH MALUKU & PAPUA - - - - - - I N D O N E S I A 469.227 466.642 2.551.026 5.467 805.672 262.350
DIREKTORAT JENDERAL PERKEBUNAN
Directorate General of Estate Crops
Keterangan/Note :
1. Angka Tetap/Fixed
Tabel 11.
Jumlah Luas Areal dan Produksi Tebu Perkebunan Rakyat, Besar Negara dan Besar
Swasta (PR+PBN+PBS) Menurut Provinsi dan Keadaan Tanaman Tahun 2014*)
Table
Area and Sugar Cane Production of Smallholder, Government and Private Estate
by Province and Tree Crops Classification, 2014*)
No.
Provinsi/Province
Luas Areal/Area (Ha)
Produksi
Production
(Ton)
Produktivitas/
Productivity
(Kg/Ha)
Jumlah
Petani/
Farmers
(KK)
Jumlah
Tenaga Kerja/
Farmers
(TK)
Tanam/
Planted
Harvested
Panen/
1. 2. 3. 4. 5. 6. 7. 8. 9. 10. ACEH SUMATERA UTARA SUMATERA BARAT R I A U KEPULAUAN RIAU J A M B I SUMATERA SELATAN KEP. BANGKA BELITUNG BENGKULU LAMPUNG - 9.946 - - - - 22.032 - - 116.397 - 9.554 - - - - 21.549 - - 115.757 - 39.019 - - - - 97.650 - - 764.746 - 4.084 - - - - 4.532 - - 6.606 - 1.455 - - - - 296 - - 17.331 - 12.605 - - - - 25.156 - - 275.871 WILAYAH SUMATERA 148.375 146.860 901.414 6.138 19.082 313.632 11. 12. 13. 14. 15. 16. DKI. JAKARTA JAWA BARAT BANTEN JAWA TENGAH D.I. YOGYAKARTA JAWA TIMUR - 21.984 - 72.548 3.587 212.139 - 21.595 - 70.457 3.579 211.938 - 94.116 - 295.590 16.476 1.262.473 - 4.358 - 4.195 4.604 5.957 - 10.601 - 92.857 15.681 682.563 - 16.815 - 1.619 - 30.068 WILAYAH JAWA 310.258 307.569 1.668.655 5.425 801.702 48.502 17. 18. 19. B A L I
NUSA TENGGARA BARAT NUSA TENGGARA TIMUR
- - - - - - - - - - - - - - - - - - WILAYAH NUSA TENGGARA & BALI - - - - - - 20. 21. 22. 23. KALIMANTAN BARAT KALIMANTAN TENGAH KALIMANTAN SELATAN KALIMANTAN TIMUR - - - - - - - - - - - - - - - - - - - - - - - - WILAYAH KALIMANTAN - - - - - - 24. 25. 26. 27. 28. 29. SULAWESI UTARA GORONTALO SULAWESI TENGAH SULAWESI SELATAN SULAWESI BARAT SULAWESI TENGGARA - 7.357 - 11.891 - - - 7.105 - 11.805 - - - 29.260 - 32.913 - - - 4.118 - 2.788 - - - 6.911 - 1.629 - - - 11.156 - 14.846 - - WILAYAH SULAWESI 19.247 18.910 62.173 3.288 8.540 26.001 30. 31. 32. 33. M A L U K U MALUKU UTARA PAPUA PAPUA BARAT - - -- - - -- - - -- - - -- - - -- - - -- WILAYAH MALUKU & PAPUA - - - - - - I N D O N E S I A 477.881 473.338 2.632.242 5.561 829.324 388.136
DIREKTORAT JENDERAL PERKEBUNAN
Directorate General of Estate Crops
Keterangan/Note :
1. Angka Sementara/Preliminary*)
Tabel 12.
Jumlah Luas Areal dan Produksi Tebu Perkebunan Rakyat, Besar Negara dan Besar
Swasta (PR+PBN+PBS) Menurut Provinsi dan Keadaan Tanaman Tahun 2015**)
Table
Area and Sugar Cane Production of Smallholder, Government and Private Estate
by Province and Tree Crops Classification, 2015**)
No.
Provinsi/Province
Luas Areal/Area (Ha)
Produksi
Production
(Ton)
Produktivitas/
Productivity
(Kg/Ha)
Jumlah
Petani/
Farmers
(KK)
Jumlah
Tenaga Kerja/
Farmers
(TK)
Tanam/
Planted
Harvested
Panen/
1. 2. 3. 4. 5. 6. 7. 8. 9. 10. ACEH SUMATERA UTARA SUMATERA BARAT R I A U KEPULAUAN RIAU J A M B I SUMATERA SELATAN KEP. BANGKA BELITUNG BENGKULU LAMPUNG - 10.051 - - - - 22.267 - - 116.452 - 9.890 - - - - 21.876 - - 116.442 - 40.569 - - - - 99.807 - - 771.235 - 4.102 - - - - 4.562 - - 6.623 - 13.922 - - - - 25.670 - - 293.271 - 12.699 - - - - 25.357 - - 275.897 WILAYAH SUMATERA 148.771 148.208 911.610 6.151 332.862 313.952 11. 12. 13. 14. 15. 16. DKI. JAKARTA JAWA BARAT BANTEN JAWA TENGAH D.I. YOGYAKARTA JAWA TIMUR - 22.460 - 73.816 3.664 218.250 - 22.300 - 72.972 3.659 218.250 - 97.385 - 310.842 17.106 1.327.500 - 4.367 - 4.260 4.675 6.082 - 28.009 - 94.661 16.014 723.373 - 17.176 - 1.804 - 30.100 WILAYAH JAWA 318.190 317.181 1.752.833 5.526 862.057 49.080 17. 18. 19. B A L I
NUSA TENGGARA BARAT NUSA TENGGARA TIMUR
- - - - - - - - - - - - - - - - - - WILAYAH NUSA TENGGARA & BALI - - - - - - 20. 21. 22. 23. KALIMANTAN BARAT KALIMANTAN TENGAH KALIMANTAN SELATAN KALIMANTAN TIMUR - - - - - - - - - - - - - - - - - - - - - - - - WILAYAH KALIMANTAN - - - - - - 24. 25. 26. 27. 28. 29. SULAWESI UTARA GORONTALO SULAWESI TENGAH SULAWESI SELATAN SULAWESI BARAT SULAWESI TENGGARA - 7.808 - 12.326 - - - 7.312 - 11.868 - - - 30.688 - 33.262 - - - 4.197 - 2.803 - - - 13.943 - 19.383 - - - 11.846 - 15.854 - - WILAYAH SULAWESI 20.134 19.180 63.950 3.334 33.327 27.700 30. 31. 32. 33. M A L U K U MALUKU UTARA PAPUA PAPUA BARAT - - -- - - -- - - -- - - -- - - -- - - -- WILAYAH MALUKU & PAPUA - - - - - - I N D O N E S I A 487.095 484.569 2.728.393 5.631 1.228.245 390.732
DIREKTORAT JENDERAL PERKEBUNAN
Directorate General of Estate Crops
Keterangan/Note :
1. Angka Estimasi/Estimation**)
Tabel 13.
Luas Areal dan Produksi Tebu Perkebunan Rakyat Menurut Provinsi dan Keadaan
Tanaman Tahun 2013
Table
Area and Sugar Cane Production of Smallholder by Province and Tree Crops
Classification, 2013
No.
Provinsi/Province
Luas Areal/Area (Ha)
Produksi
Production
(Ton)
Produktivitas/
Productivity
(Kg/Ha)
Jumlah
Petani/
Farmers
(KK)
Tanam/
Planted
Harvested
Panen/
1. 2. 3. 4. 5. 6. 7. 8. 9. 10. ACEH SUMATERA UTARA SUMATERA BARAT R I A U KEPULAUAN RIAU J A M B I SUMATERA SELATAN KEP. BANGKA BELITUNG BENGKULU LAMPUNG - 2.252 - - - - 591 - - 12.014 - 2.222 - - - - 589 - - 11.944 - 7.855 - - - - 1.213 - - 75.408 - 3.536 - - - - 2.060 - - 6.314 - 1.280 - - - - 255 - - 17.163 WILAYAH SUMATERA 14.857 14.755 84.477 5.725 18.698 11. 12. 13. 14. 15. 16. DKI. JAKARTA JAWA BARAT BANTEN JAWA TENGAH D.I. YOGYAKARTA JAWA TIMUR - 10.399 - 64.969 3.577 193.431 - 10.372 - 63.387 3.576 193.381 - 46.841 - 263.985 15.868 1.140.187 - 4.516 - 4.165 4.438 5.896 - 9.758 - 80.636 15.634 673.324 WILAYAH JAWA 272.375 270.716 1.466.881 5.419 779.352 17. 18. 19. B A L I
NUSA TENGGARA BARAT NUSA TENGGARA TIMUR
- - - - - - - - - - - - - - - WILAYAH NUSA TENGGARA & BALI - - - - - 20. 21. 22. 23. KALIMANTAN BARAT KALIMANTAN TENGAH KALIMANTAN SELATAN KALIMANTAN TIMUR - - - - - - - - - - - - - - - - - - - - WILAYAH KALIMANTAN - - - - - 24. 25. 26. 27. 28. 29. SULAWESI UTARA GORONTALO SULAWESI TENGAH SULAWESI SELATAN SULAWESI BARAT SULAWESI TENGGARA - 1.031 - 2.868 - - - 1.025 - 2.784 - - - 3.168 - 6.521 - - - 3.091 - 2.342 - - - 6.053 - 1.569 - - WILAYAH SULAWESI 3.899 3.809 9.689 2.544 7.622 30. 31. 32. 33. M A L U K U MALUKU UTARA PAPUA PAPUA BARAT - - -- - - -- - - -- - - -- - - -- WILAYAH MALUKU & PAPUA - - - - - I N D O N E S I A 291.132 289.279 1.561.047 5.396 805.672