Tree Crop Estate Statistics Of Indonesia
STATISTIK PERKEBUNAN INDONESIA
Direktorat Jenderal Perkebunan
Directorate General of Estate Crops
Jakarta, Desember 2015
Rubber
2014 - 2016
2014 - 2016
KARET
KARET
Naskah/Manuscript
Direktorat Jenderal Perkebunan,
Directorate General of Estate Crops
Kementerian Pertanian
Ministry of Agriculture
Penasehat/Advisor:
Ir. Irmijati Rachmi Nurbahar, M.Sc.
Penyunting/Senior Editors:
Ir. Muh. Edi Subiyantoro, MM
Yanuar Arianto, STP, MM
Staf Penyunting/Editorial Staffs:
Widya Khonik Zuraina, S.Si
Eko Pudjianto, S.Kom
Asep Udin, S.Kom
Neny Kurniawati, S.Si
Susilo Novianto Damarjati, A.Md.
Diterbitkan oleh/Published by
Direktorat Jenderal Perkebunan
Directorate General of Estate Crops
Jl. Harsono RM No. 3 Gedung C
Pasar Minggu - Jakarta 12550
Kotak Pos 1060/Jkt,10010
Tlp. : 021 - 7815380 - 4
Fax. : 021 - 715486 - 7815586
Jakarta, Desember 2015
Jakarta, December 2015
STATISTIK PERKEBUNAN INDONESIA 2014-2016
Kata
Pengantar
K
omoditas perkebunan merupakan andalan bagi pendapatan
nasional dan devisa negara Indonesia, yang dapat dilihat dari nilai
ekspor komoditas perkebunan, pada Tahun 2014 total ekspor
perkebunan mencapai US$ 28,234 milyar atau setara dengan Rp. 367,040
triliun (asumsi 1 US$ = Rp. 13.000,00). Kontribusi sub sektor perkebunan
terhadap perekonomian nasional semakin meningkat dan diharapkan
dapat memperkokoh pembangunan perkebunan secara menyeluruh. Agar
informasi perkebunan dapat tersebar secara luas, setiap tahun diterbitkan
Buku Statistik Perkebunan Indonesia yang menyajikan data secara handal,
sahih, objektif, mutakhir dan konsisten.
S
tatistik Perkebunan Indonesia Tahun 2014-2016 menyajikan data luas areal, produksi,
produktivitas baik secara nasional maupun provinsi menurut status pengusahaannya
yaitu Perkebunan Rakyat, Perkebunan Besar Negara dan Perkebunan Besar Swasta.
Penyajian data juga dilengkapi dengan data ekspor dan impor untuk masing-masing komoditas
yang mencakup negara tujuan/asal, volume dan nilai, harga di dalam dan luar negeri serta untuk
beberapa komoditas tertentu disajikan data keseimbangan dunia.
D
ata yang disajikan merupakan hasil sinkronisasi dan validasi data statistik perkebunan
2014-2016 yang dilaksanakan secara berjenjang dari tingkat kabupaten sampai tingkat
nasional dengan mengacu pada Pedoman Pelaksanaan Pengelolaan Data Komoditas
Perkebunan yang diterbitkan Direktorat Jenderal Perkebunan. Data tersebut meliputi angka
tetap (ATAP) Tahun 2014, angka sementara (ASEM) Tahun 2015 dan angka estimasi (AESTI)
Tahun 2016. Data yang disajikan bersumber dari data primer yang dikumpulkan dari dinas yang
membidangi perkebunan di provinsi dan data sekunder yang dikutip dari data yang diterbitkan
oleh Badan Pusat Statistik (BPS), Kementerian Perindustrian, Kementerian Perdagangan, Bank
Indonesia, dan publikasi yang diterbitkan oleh asosiasi-asosiasi perkebunan baik dalam maupun
luar negeri.
B
uku ini dapat diterbitkan, atas dukungan dan kerjasama yang baik dari berbagai pihak.
Untuk itu, pada kesempatan ini, kami mengucapkan terima kasih atas dukungan dan
kerjasama tersebut. Kami menyadari bahwa buku yang diterbitkan ini masih jauh dari
sempurna. Untuk itu, kritik dan saran yang sifatnya membangun sangat diharapkan sebagai
bahan masukan dalam perbaikan penerbitan di masa datang.
S
emoga apa yang disajikan dalam buku ini dapat digunakan oleh berbagai kalangan dan
para pengguna data serta dapat dijadikan acuan dalam pengambilan kebijakan.
Jakarta, Desember 2015
DIREKTUR JENDERAL PERKEBUNAN
Ir. Gamal Nasir, MS
Preface
T
he estate crop commodities is the mainstay of national income
and Indonesia’s foreign exchange wich can be seen from export
value of the estate crop commodities. In 2014, total export of the
estate crops was US $ 28.234 billion or equivalent to Rp. 367.040 trillion
(assumed 1 US $ = Rp. 13,000.00). The contribution of estate crops sub
sector to the national economy tends to increase from year to year and
expected to strengthen overall national development. Furthermore,
to spread estate crops information widely, The Estate Crop Statistics of
Indonesia is published every year that presented reliable, valid, objective,
up to date and consistent data.
T
he Estate Crop Statistics of Indonesia 2014-2016 presents area, production and
productivity data by province and district level of smallhoder, government and private
estates. It is completed by volume, value of both export and import data, price data for
domestic and world market and also world balance data for some commodities.
D
ata presented are the result of synchronization and validation of the estate crop
statistical data 2014-2016 which are held hierarchical from the district to the national
level by using guidelines of data management of estate crop commodities. In this edition,
data of the 2014 are presented as fixed data, data of the 2015 are the preliminary data and data
of the 2016 are the estimation. The primary data were collected from the Estate Crops Province
Level and the secondary data were collected from related instution such as Board of Central
Statistics, Ministry of Industry, Ministry of Trade, Central Bank of Indonesia, the publication of
Estate Commodity Associations and others.
I
t would have been impossible to compile this book without substantional support and
contribution from many instutions. At this opportunity, we would like to thank all for their
support and cooperation. We realize that the publication still needs further improvement.
We would greatly appreciate comments and suggestions for future improvement.
H
opefully this publication will have high values for users and references for policy
makers.
Jakarta, December 2015
DIRECTOR GENERAL OF ESTATE CROPS
Ir. Gamal Nasir, MS
Kata Pengantar
Preface
...
iii
Daftar Isi
Contents
...
v
Daftar Gambar
List of Figures...
vi
Daftar Tabel
List of Tables ...
vii
Daftar
Isi
Daftar
Gambar
List of Figures
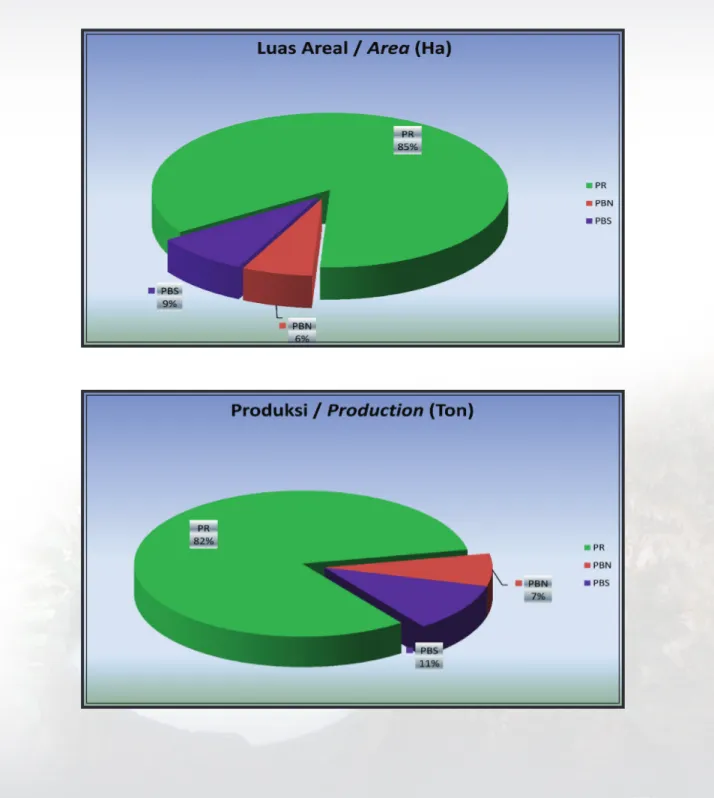
Gambar 1. Perbandingan Luas Areal dan Produksi Karet Menurut Status
Pengusahaan Tahun 2014
Figure
Area and Production Comparison Graph of Rubber by Farming
Category, 2014 ...
1
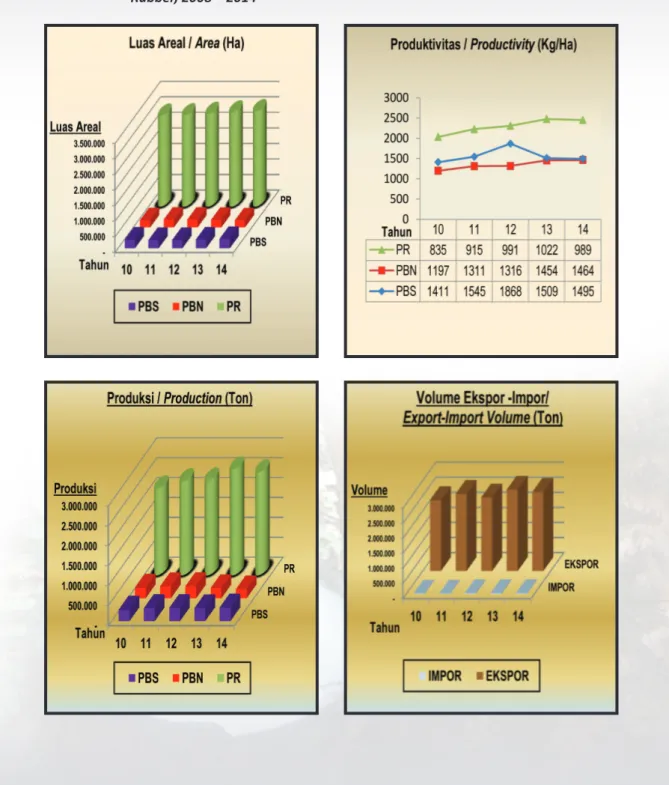
Gambar 2. Perkembangan Luas Areal, Produksi, Produktivitas dan volume
ekspor-Impor Karet Tahun 2008-2014
Figure
Area, Production, Productivity and Eksport-Import Volume
Tabel 1.
Luas Areal dan Produksi Karet Menurut Status Pengusahaan
Tahun 1975 - 2016
Tabel
Area and Rubber Production by Farming Category, 1975 - 2016 ...
3
Tabel 2.
Luas Areal dan Produksi Karet Menurut Status Pengusahaan dan
Keadaan Tanaman Tahun 2010 - 2016
Tabel
Area and Rubber Production by Farming Category and Tree Crop
Classification, 2010 - 2016 ...
4
Tabel 3.
Volume dan Nilai Ekspor - Impor Karet Tahun 1970 - 2015
Tabel
Export-Import Volume and Value of Rubber, 1970 - 2015 ...
5
Tabel 4.
Luas Areal dan Produksi Karet Perkebunan Rakyat, Besar Negara
dan Besar Swasta (PR+PBN+PBS) Menurut Provinsi dan Keadaan
Tanaman Tahun 2014
Table
Area and Rubber Production of Smallholder, Government and
Private Estate by Province and Tree Crop Classification, 2014 ...
6
Tabel 5.
Luas Areal dan Produksi Karet Perkebunan Rakyat, Besar Negara
dan Besar Swasta (PR+PBN+PBS) Menurut Provinsi dan Keadaan
Tanaman Tahun 2015*)
Table
Area and Rubber Production of Smallholder, Government and
Private Estate by Province and Tree Crop Classification, 2015*) ...
7
Tabel 6.
Luas Areal dan Produksi Karet Perkebunan Rakyat, Besar Negara
dan Besar Swasta (PR+PBN+PBS) Menurut Provinsi dan Keadaan
Tanaman Tahun 2016**)
Table
Area and Rubber Production of Smallholder, Government and
Private Estate by Province and Tree Crop Classification, 2016**) ...
8
Tabel 7.
Luas Areal dan Produksi Karet Menurut Provinsi dan Status
Pengusahaan Tahun 2014
Table
Area and Rubber Production by Province and Farming Category, 2014
9
Tabel 8.
Luas Areal dan Produksi Karet Menurut Provinsi dan Status
Pengusahaan Tahun 2015*)
Table
Area and Rubber Production by Province and Farming Category, 2015*) 10
Tabel 9.
Luas Areal dan Produksi Karet Menurut Provinsi dan Status
Pengusahaan Tahun 2016**)
Table
Area and Rubber Production by Province and Farming Category, 2016**) 11
Daftar
Tabel
Tabel 10.
Luas Tanaman Menghasilkan (TM) dan Produksi Karet Menurut
Provinsi dan Status Pengusahaan Tahun 2014
Table
Mature Area and Rubber Production by Province and Farming
Category, 2014 ...
12
Tabel 11.
Luas Tanaman Menghasilkan (TM) Dan Produksi Karet Menurut
Provinsi dan Status Pengusahaan Tahun 2015*)
Tabel
Mature Area and Rubber Production by Province and Farming
Category, 2015*) ...
13
Tabel 12.
Luas Tanaman Menghasilkan (TM) Dan Produksi Karet Menurut
Provinsi dan Status Pengusahaan Tahun 2016**)
Tabel
Mature Area and Rubber Production by Province and Farming
Category, 2016**) ...
14
Tabel 13.
Luas Areal dan Produksi Karet Perkebunan Rakyat Menurut
Provinsi dan Keadaan Tanaman Tahun 2014
Table
Area and Rubber Production of Smallholder by Province and
Tree Crop Classification, 2014 ...
15
Tabel 14.
Luas Areal dan Produksi Karet Perkebunan Rakyat Menurut
Kabupaten dan Keadaan Tanaman Tahun 2014
Table
Area and Rubber Production of Smallholder by District and
Tree Crop Classification, 2014 ...
16
Tabel 15.
Luas Areal dan Produksi Karet Perkebunan Rakyat Menurut
Provinsi dan Keadaan Tanaman Tahun 2015*)
Table
Area and Rubber Production of Smallholder by Province and
Tree Crop Classification, 2015*) ...
25
Tabel 16.
Luas Areal dan Produksi Karet Perkebunan Rakyat Menurut
Provinsi dan Keadaan Tanaman Tahun 2016**)
Table
Area and Rubber Production of Smallholders by Province and
Tree Crop Classification, 2016**) ...
26
Tabel 17.
Luas Areal dan Produksi Karet Perkebunan Besar Negara Menurut
Provinsi dan Keadaan Tanaman Tahun 2014
Table
Area and Rubber Production of Government Estate by Province and
Tree Crop Classification 2014 ...
27
Tabel 18.
Luas Areal dan Produksi Karet Perkebunan Besar Negara Menurut
Kabupaten dan Keadaan Tanaman Tahun 2014
Table
Area and Rubber Production of Government Estate by District and
Tabel 19.
Luas Areal dan Produksi Karet Perkebunan Besar Negara Menurut
Provinsi dan Keadaan Tanaman Tahun 2015*)
Table
Area and Rubber Production of Government Estate by Province and
Tree Crop Classification 2015*) ...
32
Tabel 20.
Luas Areal dan Produksi Karet Perkebunan Besar Negara Menurut
Provinsi dan Keadaan Tanaman Tahun 2016**)
Table
Area and Rubber Production of Government Estate by Province and
Tree Crop Classification 2016**) ...
33
Tabel 21.
Luas Areal dan Produksi Karet Perkebunan Besar Swasta Menurut
Provinsi dan Keadaan Tanaman Tahun 2014
Table
Area and Rubber Production of Private Estate by Province and
Tree Crop Classification, 2014 ...
34
Tabel 22.
Luas Areal dan Produksi Karet Perkebunan Besar Swasta Menurut
Kabupaten dan Keadaan Tanaman Tahun 2014
Table
Area and Rubber Production of Private Estate by District and
Tree Crop Classification, 2014 ...
35
Tabel 23.
Luas Areal dan Produks Karet Perkebunan Besar Swasta Menurut
Provinsi dan Keadaan Tanaman Tahun 2015*)
Table
Area and Rubber Production of Private Estate by Province and
Tree Crop Classification, 2015 *) ...
40
Tabel 24.
Luas Areal dan Produksi Karet Perkebunan Besar Swasta Menurut
Provinsi dan Keadaan Tanaman Tahun 2016**)
Table
Area and Rubber Production of Private Estate by Province and
Tree Crop Classification, 2016**) ...
41
Tabel 25.
Volume dan Nilai Ekspor - Impor Karet Menurut Negara Tujuan
dan Asal Tahun 2014
Table
Export - Import Volume and Value of Rubber by Destination and
Origin Country, 2014 ...
42
Tabel 26.
Perkembangan Harga Rata-rata Tahunan Karet di Pasar
Domestik Tahun 2008 - 2014
Table
Annually Average Price Trend of Rubber In Domestic
Market, 2008 - 2014 ...
49
Tabel 27.
Perkembangan Harga Rata-rata Bulanan Karet di Pasar
Dunia Tahun 2014
Gambar 1. Perbandingan Luas Areal dan Produksi Karet Menurut Status Pengusahaan
Tahun 2014
Gambar 2. Perkembangan Luas Areal, Produksi, Produktivitas dan volume ekspor-Impor
Karet Tahun 2008-2014
Figure
Area, Production, Productivity and Eksport-Import Volume Trends Graph of
Rubber, 2008 – 2014
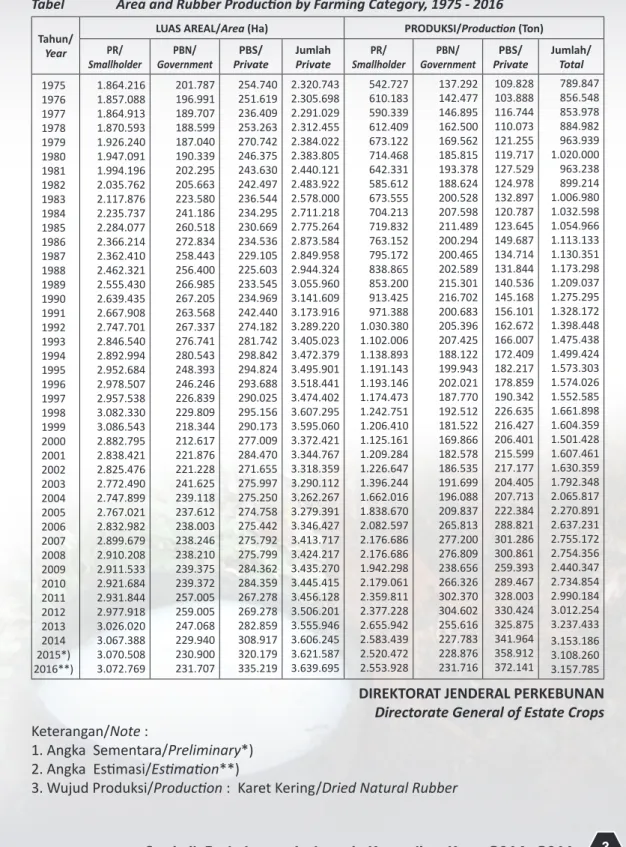
Tabel 1.
Luas Areal dan Produksi Karet Menurut Status Pengusahaan Tahun 1975 - 2016
Tabel
Area and Rubber Production by Farming Category, 1975 - 2016
Tahun/
Year
LUAS AREAL/Area (Ha)
PRODUKSI/Production (Ton)
PR/
Smallholder
Government
PBN/
Private
PBS/
Jumlah
Private
Smallholder
PR/
Government
PBN/
Private
PBS/
Jumlah/
Total
1975
1976
1977
1978
1979
1980
1981
1982
1983
1984
1985
1986
1987
1988
1989
1990
1991
1992
1993
1994
1995
1996
1997
1998
1999
2000
2001
2002
2003
2004
2005
2006
2007
2008
2009
2010
2011
2012
2013
2014
2015*)
2016**)
1.864.216
1.857.088
1.864.913
1.870.593
1.926.240
1.947.091
1.994.196
2.035.762
2.117.876
2.235.737
2.284.077
2.366.214
2.362.410
2.462.321
2.555.430
2.639.435
2.667.908
2.747.701
2.846.540
2.892.994
2.952.684
2.978.507
2.957.538
3.082.330
3.086.543
2.882.795
2.838.421
2.825.476
2.772.490
2.747.899
2.767.021
2.832.982
2.899.679
2.910.208
2.911.533
2.921.684
2.931.844
2.977.918
3.026.020
3.067.388
3.070.508
3.072.769
201.787
196.991
189.707
188.599
187.040
190.339
202.295
205.663
223.580
241.186
260.518
272.834
258.443
256.400
266.985
267.205
263.568
267.337
276.741
280.543
248.393
246.246
226.839
229.809
218.344
212.617
221.876
221.228
241.625
239.118
237.612
238.003
238.246
238.210
239.375
239.372
257.005
259.005
247.068
229.940
230.900
231.707
254.740
251.619
236.409
253.263
270.742
246.375
243.630
242.497
236.544
234.295
230.669
234.536
229.105
225.603
233.545
234.969
242.440
274.182
281.742
298.842
294.824
293.688
290.025
295.156
290.173
277.009
284.470
271.655
275.997
275.250
274.758
275.442
275.792
275.799
284.362
284.359
267.278
269.278
282.859
308.917
320.179
335.219
2.320.743
2.305.698
2.291.029
2.312.455
2.384.022
2.383.805
2.440.121
2.483.922
2.578.000
2.711.218
2.775.264
2.873.584
2.849.958
2.944.324
3.055.960
3.141.609
3.173.916
3.289.220
3.405.023
3.472.379
3.495.901
3.518.441
3.474.402
3.607.295
3.595.060
3.372.421
3.344.767
3.318.359
3.290.112
3.262.267
3.279.391
3.346.427
3.413.717
3.424.217
3.435.270
3.445.415
3.456.128
3.506.201
3.555.946
3.606.245
3.621.587
3.639.695
542.727
610.183
590.339
612.409
673.122
714.468
642.331
585.612
673.555
704.213
719.832
763.152
795.172
838.865
853.200
913.425
971.388
1.030.380
1.102.006
1.138.893
1.191.143
1.193.146
1.174.473
1.242.751
1.206.410
1.125.161
1.209.284
1.226.647
1.396.244
1.662.016
1.838.670
2.082.597
2.176.686
2.176.686
1.942.298
2.179.061
2.359.811
2.377.228
2.655.942
2.583.439
2.520.472
2.553.928
137.292
142.477
146.895
162.500
169.562
185.815
193.378
188.624
200.528
207.598
211.489
200.294
200.465
202.589
215.301
216.702
200.683
205.396
207.425
188.122
199.943
202.021
187.770
192.512
181.522
169.866
182.578
186.535
191.699
196.088
209.837
265.813
277.200
276.809
238.656
266.326
302.370
304.602
255.616
227.783
228.876
231.716
109.828
103.888
116.744
110.073
121.255
119.717
127.529
124.978
132.897
120.787
123.645
149.687
134.714
131.844
140.536
145.168
156.101
162.672
166.007
172.409
182.217
178.859
190.342
226.635
216.427
206.401
215.599
217.177
204.405
207.713
222.384
288.821
301.286
300.861
259.393
289.467
328.003
330.424
325.875
341.964
358.912
372.141
789.847
856.548
853.978
884.982
963.939
1.020.000
963.238
899.214
1.006.980
1.032.598
1.054.966
1.113.133
1.130.351
1.173.298
1.209.037
1.275.295
1.328.172
1.398.448
1.475.438
1.499.424
1.573.303
1.574.026
1.552.585
1.661.898
1.604.359
1.501.428
1.607.461
1.630.359
1.792.348
2.065.817
2.270.891
2.637.231
2.755.172
2.754.356
2.440.347
2.734.854
2.990.184
3.012.254
3.237.433
3.153.186
3.108.260
3.157.785
DIREKTORAT JENDERAL PERKEBUNAN
Directorate General of Estate Crops
Keterangan/Note :
1. Angka Sementara/Preliminary*)
2. Angka Estimasi/Estimation**)
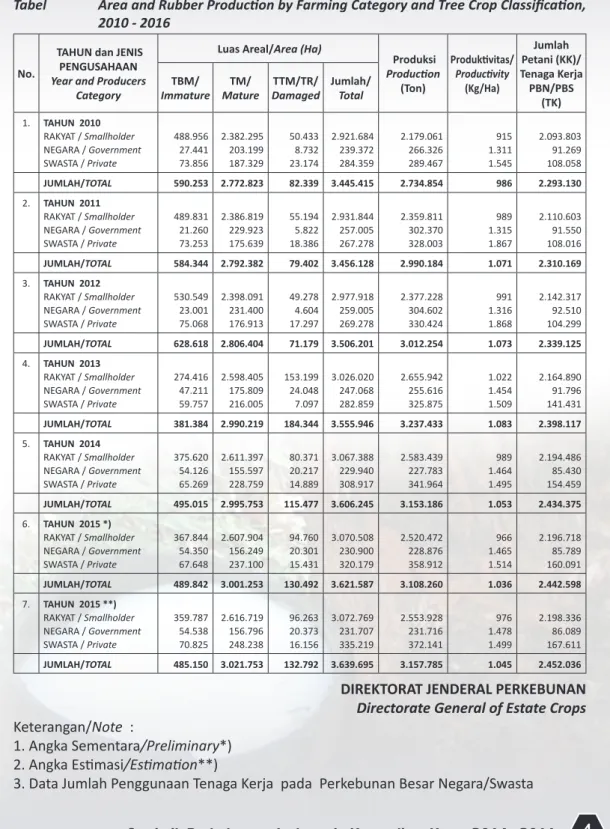
Tabel 2.
Luas Areal dan Produksi Karet Menurut Status Pengusahaan dan Keadaan
Tanaman Tahun 2010 - 2016
Tabel
Area and Rubber Production by Farming Category and Tree Crop Classification,
2010 - 2016
No.
TAHUN dan JENIS
PENGUSAHAAN
Year and Producers
Category
Luas Areal/Area (Ha)
Produksi
Production
(Ton)
Produktivitas/
Productivity
(Kg/Ha)
Jumlah
Petani (KK)/
Tenaga Kerja
PBN/PBS
(TK)
TBM/
Immature
Mature
TM/
Damaged
TTM/TR/
Jumlah/
Total
1. TAHUN 2010 RAKYAT / Smallholder NEGARA / Government SWASTA / Private 488.956 27.441 73.856 2.382.295 203.199 187.329 50.433 8.732 23.174 2.921.684 239.372 284.359 2.179.061 266.326 289.467 915 1.311 1.545 2.093.803 91.269 108.058 JUMLAH/TOTAL 590.253 2.772.823 82.339 3.445.415 2.734.854 986 2.293.130 2. TAHUN 2011 RAKYAT / Smallholder NEGARA / Government SWASTA / Private 489.831 21.260 73.253 2.386.819 229.923 175.639 55.194 5.822 18.386 2.931.844 257.005 267.278 2.359.811 302.370 328.003 989 1.315 1.867 2.110.603 91.550 108.016 JUMLAH/TOTAL 584.344 2.792.382 79.402 3.456.128 2.990.184 1.071 2.310.169 3. TAHUN 2012 RAKYAT / Smallholder NEGARA / Government SWASTA / Private 530.549 23.001 75.068 2.398.091 231.400 176.913 49.278 4.604 17.297 2.977.918 259.005 269.278 2.377.228 304.602 330.424 991 1.316 1.868 2.142.317 92.510 104.299 JUMLAH/TOTAL 628.618 2.806.404 71.179 3.506.201 3.012.254 1.073 2.339.125 4. TAHUN 2013 RAKYAT / Smallholder NEGARA / Government SWASTA / Private 274.416 47.211 59.757 2.598.405 175.809 216.005 153.199 24.048 7.097 3.026.020 247.068 282.859 2.655.942 255.616 325.875 1.022 1.454 1.509 2.164.890 91.796 141.431 JUMLAH/TOTAL 381.384 2.990.219 184.344 3.555.946 3.237.433 1.083 2.398.117 5. TAHUN 2014 RAKYAT / Smallholder NEGARA / Government SWASTA / Private 375.620 54.126 65.269 2.611.397 155.597 228.759 80.371 20.217 14.889 3.067.388 229.940 308.917 2.583.439 227.783 341.964 989 1.464 1.495 2.194.486 85.430 154.459 JUMLAH/TOTAL 495.015 2.995.753 115.477 3.606.245 3.153.186 1.053 2.434.375 6. TAHUN 2015 *) RAKYAT / Smallholder NEGARA / Government SWASTA / Private 367.844 54.350 67.648 2.607.904 156.249 237.100 94.760 20.301 15.431 3.070.508 230.900 320.179 2.520.472 228.876 358.912 966 1.465 1.514 2.196.718 85.789 160.091 JUMLAH/TOTAL 489.842 3.001.253 130.492 3.621.587 3.108.260 1.036 2.442.598 7. TAHUN 2015 **) RAKYAT / Smallholder NEGARA / Government SWASTA / Private 359.787 54.538 70.825 2.616.719 156.796 248.238 96.263 20.373 16.156 3.072.769 231.707 335.219 2.553.928 231.716 372.141 976 1.478 1.499 2.198.336 86.089 167.611 JUMLAH/TOTAL 485.150 3.021.753 132.792 3.639.695 3.157.785 1.045 2.452.036
DIREKTORAT JENDERAL PERKEBUNAN
Directorate General of Estate Crops
Keterangan/Note :
1. Angka Sementara/Preliminary*)
2. Angka Estimasi/Estimation**)
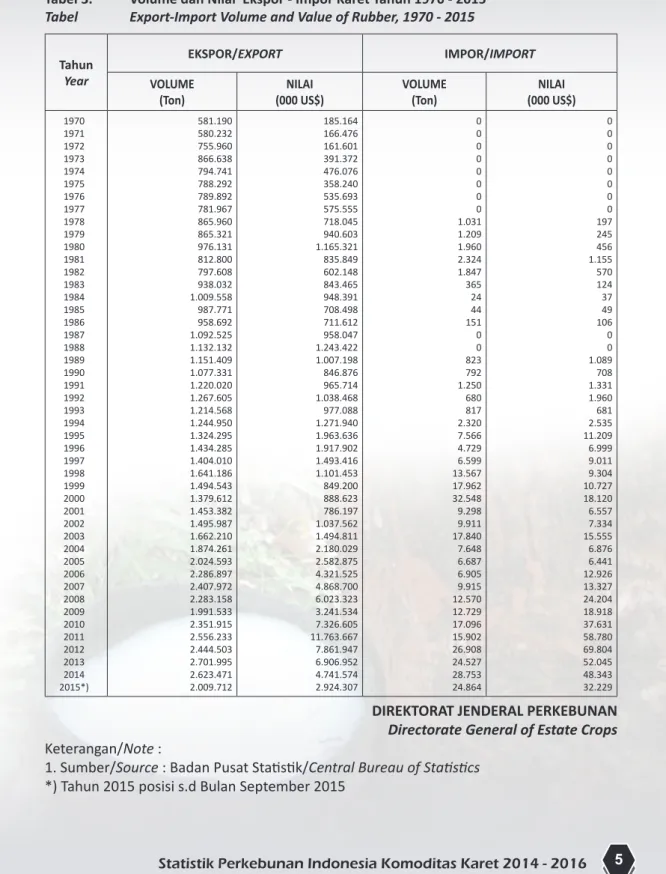
Tabel 3.
Volume dan Nilai Ekspor - Impor Karet Tahun 1970 - 2015
Tabel
Export-Import Volume and Value of Rubber, 1970 - 2015
Tahun
Year
EKSPOR/EXPORT
IMPOR/IMPORT
VOLUME
(Ton)
(000 US$)
NILAI
VOLUME
(Ton)
(000 US$)
NILAI
1970 1971 1972 1973 1974 1975 1976 1977 1978 1979 1980 1981 1982 1983 1984 1985 1986 1987 1988 1989 1990 1991 1992 1993 1994 1995 1996 1997 1998 1999 2000 2001 2002 2003 2004 2005 2006 2007 2008 2009 2010 2011 2012 2013 2014 2015*) 581.190 580.232 755.960 866.638 794.741 788.292 789.892 781.967 865.960 865.321 976.131 812.800 797.608 938.032 1.009.558 987.771 958.692 1.092.525 1.132.132 1.151.409 1.077.331 1.220.020 1.267.605 1.214.568 1.244.950 1.324.295 1.434.285 1.404.010 1.641.186 1.494.543 1.379.612 1.453.382 1.495.987 1.662.210 1.874.261 2.024.593 2.286.897 2.407.972 2.283.158 1.991.533 2.351.915 2.556.233 2.444.503 2.701.995 2.623.471 2.009.712 185.164 166.476 161.601 391.372 476.076 358.240 535.693 575.555 718.045 940.603 1.165.321 835.849 602.148 843.465 948.391 708.498 711.612 958.047 1.243.422 1.007.198 846.876 965.714 1.038.468 977.088 1.271.940 1.963.636 1.917.902 1.493.416 1.101.453 849.200 888.623 786.197 1.037.562 1.494.811 2.180.029 2.582.875 4.321.525 4.868.700 6.023.323 3.241.534 7.326.605 11.763.667 7.861.947 6.906.952 4.741.574 2.924.307 0 0 0 0 0 0 0 0 1.031 1.209 1.960 2.324 1.847 365 24 44 151 0 0 823 792 1.250 680 817 2.320 7.566 4.729 6.599 13.567 17.962 32.548 9.298 9.911 17.840 7.648 6.687 6.905 9.915 12.570 12.729 17.096 15.902 26.908 24.527 28.753 24.864 0 0 0 0 0 0 0 0 197 245 456 1.155 570 124 37 49 106 0 0 1.089 708 1.331 1.960 681 2.535 11.209 6.999 9.011 9.304 10.727 18.120 6.557 7.334 15.555 6.876 6.441 12.926 13.327 24.204 18.918 37.631 58.780 69.804 52.045 48.343 32.229
DIREKTORAT JENDERAL PERKEBUNAN
Directorate General of Estate Crops
Keterangan/Note :
1. Sumber/Source : Badan Pusat Statistik/Central Bureau of Statistics
*) Tahun 2015 posisi s.d Bulan September 2015
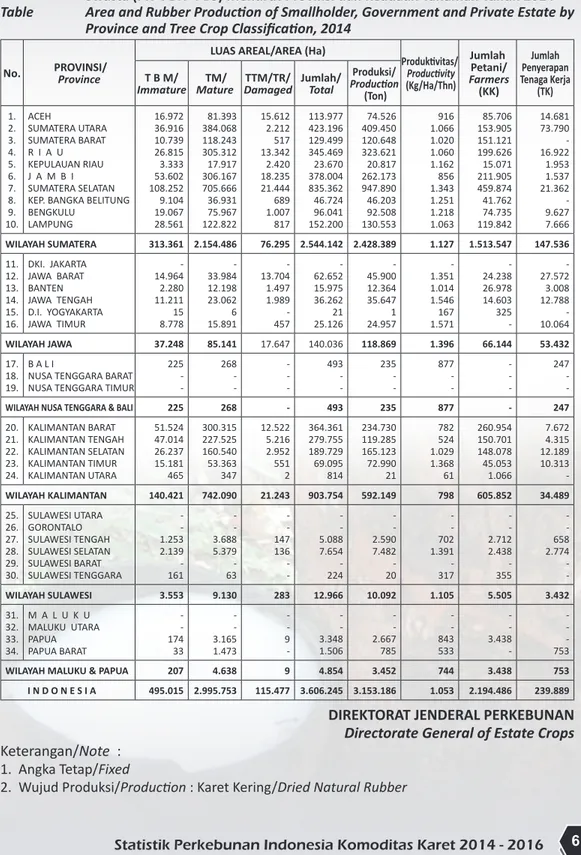
Tabel 4.
Luas Areal dan Produksi Karet Perkebunan Rakyat, Besar Negara dan Besar
Swasta (PR+PBN+PBS) Menurut Provinsi dan Keadaan Tanaman Tahun 2014
Table
Area and Rubber Production of Smallholder, Government and Private Estate by
Province and Tree Crop Classification, 2014
No.
PROVINSI/
Province
LUAS AREAL/AREA (Ha)
Produktivitas/
Productivity
(Kg/Ha/Thn)
Jumlah
Petani/
Farmers
(KK)
Jumlah
Penyerapan
Tenaga Kerja
(TK)
T B M/
Immature
Mature
TM/
Damaged
TTM/TR/
Jumlah/
Total
Produksi/
Production
(Ton)
1. 2. 3. 4. 5. 6. 7. 8. 9. 10. ACEH SUMATERA UTARA SUMATERA BARAT R I A U KEPULAUAN RIAU J A M B I SUMATERA SELATAN KEP. BANGKA BELITUNG BENGKULU LAMPUNG 16.972 36.916 10.739 26.815 3.333 53.602 108.252 9.104 19.067 28.561 81.393 384.068 118.243 305.312 17.917 306.167 705.666 36.931 75.967 122.822 15.612 2.212 517 13.342 2.420 18.235 21.444 689 1.007 817 113.977 423.196 129.499 345.469 23.670 378.004 835.362 46.724 96.041 152.200 74.526 409.450 120.648 323.621 20.817 262.173 947.890 46.203 92.508 130.553 916 1.066 1.020 1.060 1.162 856 1.343 1.251 1.218 1.063 85.706 153.905 151.121 199.626 15.071 211.905 459.874 41.762 74.735 119.842 14.681 73.790 - 16.922 1.953 1.537 21.362 - 9.627 7.666 WILAYAH SUMATERA 313.361 2.154.486 76.295 2.544.142 2.428.389 1.127 1.513.547 147.536 11. 12. 13. 14. 15. 16. DKI. JAKARTA JAWA BARAT BANTEN JAWA TENGAH D.I. YOGYAKARTA JAWA TIMUR - 14.964 2.280 11.211 15 8.778 - 33.984 12.198 23.062 6 15.891 - 13.704 1.497 1.989 - 457 - 62.652 15.975 36.262 21 25.126 - 45.900 12.364 35.647 1 24.957 - 1.351 1.014 1.546 167 1.571 - 24.238 26.978 14.603 325 - - 27.572 3.008 12.788 - 10.064 WILAYAH JAWA 37.248 85.141 17.647 140.036 118.869 1.396 66.144 53.432 17. 18. 19. B A L INUSA TENGGARA BARAT NUSA TENGGARA TIMUR
225 - - 268 - - - - - 493 - - 235 - - 877 - - - - - 247 - -
WILAYAH NUSA TENGGARA & BALI 225 268 - 493 235 877 - 247
20. 21. 22. 23. 24. KALIMANTAN BARAT KALIMANTAN TENGAH KALIMANTAN SELATAN KALIMANTAN TIMUR KALIMANTAN UTARA 51.524 47.014 26.237 15.181 465 300.315 227.525 160.540 53.363 347 12.522 5.216 2.952 551 2 364.361 279.755 189.729 69.095 814 234.730 119.285 165.123 72.990 21 782 524 1.029 1.368 61 260.954 150.701 148.078 45.053 1.066 7.672 4.315 12.189 10.313 - WILAYAH KALIMANTAN 140.421 742.090 21.243 903.754 592.149 798 605.852 34.489 25. 26. 27. 28. 29. 30. SULAWESI UTARA GORONTALO SULAWESI TENGAH SULAWESI SELATAN SULAWESI BARAT SULAWESI TENGGARA - - 1.253 2.139 - 161 - - 3.688 5.379 - 63 - - 147 136 - - - - 5.088 7.654 - 224 - - 2.590 7.482 - 20 - - 702 1.391 - 317 - - 2.712 2.438 - 355 - - 658 2.774 - - WILAYAH SULAWESI 3.553 9.130 283 12.966 10.092 1.105 5.505 3.432 31. 32. 33. 34. M A L U K U MALUKU UTARA PAPUA PAPUA BARAT - - 174 33 - - 3.165 1.473 - - 9 - - - 3.348 1.506 - - 2.667 785 - - 843 533 - - 3.438 - - - - 753
WILAYAH MALUKU & PAPUA 207 4.638 9 4.854 3.452 744 3.438 753
I N D O N E S I A 495.015 2.995.753 115.477 3.606.245 3.153.186 1.053 2.194.486 239.889
DIREKTORAT JENDERAL PERKEBUNAN
Directorate General of Estate Crops
Keterangan/Note :
1. Angka Tetap/Fixed
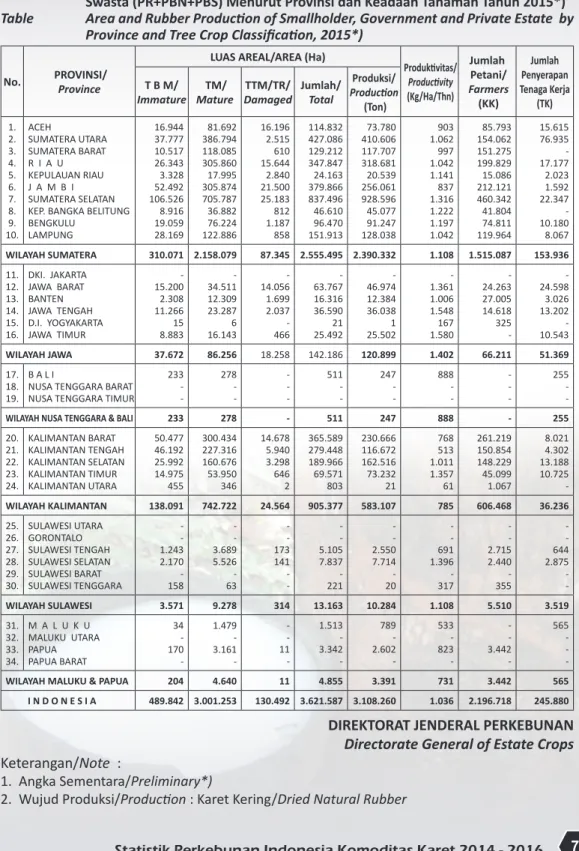
Tabel 5.
Luas Areal dan Produksi Karet Perkebunan Rakyat, Besar Negara dan Besar
Swasta (PR+PBN+PBS) Menurut Provinsi dan Keadaan Tanaman Tahun 2015*)
Table
Area and Rubber Production of Smallholder, Government and Private Estate by
Province and Tree Crop Classification, 2015*)
No.
PROVINSI/
Province
LUAS AREAL/AREA (Ha)
Produktivitas/
Productivity
(Kg/Ha/Thn)
Jumlah
Petani/
Farmers
(KK)
Jumlah
Penyerapan
Tenaga Kerja
(TK)
T B M/
Immature
Mature
TM/
Damaged
TTM/TR/
Jumlah/
Total
Produksi/
Production
(Ton)
1. 2. 3. 4. 5. 6. 7. 8. 9. 10. ACEH SUMATERA UTARA SUMATERA BARAT R I A U KEPULAUAN RIAU J A M B I SUMATERA SELATAN KEP. BANGKA BELITUNG BENGKULU LAMPUNG 16.944 37.777 10.517 26.343 3.328 52.492 106.526 8.916 19.059 28.169 81.692 386.794 118.085 305.860 17.995 305.874 705.787 36.882 76.224 122.886 16.196 2.515 610 15.644 2.840 21.500 25.183 812 1.187 858 114.832 427.086 129.212 347.847 24.163 379.866 837.496 46.610 96.470 151.913 73.780 410.606 117.707 318.681 20.539 256.061 928.596 45.077 91.247 128.038 903 1.062 997 1.042 1.141 837 1.316 1.222 1.197 1.042 85.793 154.062 151.275 199.829 15.086 212.121 460.342 41.804 74.811 119.964 15.615 76.935 - 17.177 2.023 1.592 22.347 - 10.180 8.067 WILAYAH SUMATERA 310.071 2.158.079 87.345 2.555.495 2.390.332 1.108 1.515.087 153.936 11. 12. 13. 14. 15. 16. DKI. JAKARTA JAWA BARAT BANTEN JAWA TENGAH D.I. YOGYAKARTA JAWA TIMUR - 15.200 2.308 11.266 15 8.883 - 34.511 12.309 23.287 6 16.143 - 14.056 1.699 2.037 - 466 - 63.767 16.316 36.590 21 25.492 - 46.974 12.384 36.038 1 25.502 - 1.361 1.006 1.548 167 1.580 - 24.263 27.005 14.618 325 - - 24.598 3.026 13.202 - 10.543 WILAYAH JAWA 37.672 86.256 18.258 142.186 120.899 1.402 66.211 51.369 17. 18. 19. B A L INUSA TENGGARA BARAT NUSA TENGGARA TIMUR
233 - - 278 - - - - - 511 - - 247 - - 888 - - - - - 255 - -
WILAYAH NUSA TENGGARA & BALI 233 278 - 511 247 888 - 255
20. 21. 22. 23. 24. KALIMANTAN BARAT KALIMANTAN TENGAH KALIMANTAN SELATAN KALIMANTAN TIMUR KALIMANTAN UTARA 50.477 46.192 25.992 14.975 455 300.434 227.316 160.676 53.950 346 14.678 5.940 3.298 646 2 365.589 279.448 189.966 69.571 803 230.666 116.672 162.516 73.232 21 768 513 1.011 1.357 61 261.219 150.854 148.229 45.099 1.067 8.021 4.302 13.188 10.725 - WILAYAH KALIMANTAN 138.091 742.722 24.564 905.377 583.107 785 606.468 36.236 25. 26. 27. 28. 29. 30. SULAWESI UTARA GORONTALO SULAWESI TENGAH SULAWESI SELATAN SULAWESI BARAT SULAWESI TENGGARA - - 1.243 2.170 - 158 - - 3.689 5.526 - 63 - - 173 141 - - - - 5.105 7.837 - 221 - - 2.550 7.714 - 20 - - 691 1.396 - 317 - - 2.715 2.440 - 355 - - 644 2.875 - - WILAYAH SULAWESI 3.571 9.278 314 13.163 10.284 1.108 5.510 3.519 31. 32. 33. 34. M A L U K U MALUKU UTARA PAPUA PAPUA BARAT 34 - 170 - 1.479 - 3.161 - - - 11 - 1.513 - 3.342 - 789 - 2.602 - 533 - 823 - - - 3.442 - 565 - - -
WILAYAH MALUKU & PAPUA 204 4.640 11 4.855 3.391 731 3.442 565
I N D O N E S I A 489.842 3.001.253 130.492 3.621.587 3.108.260 1.036 2.196.718 245.880
DIREKTORAT JENDERAL PERKEBUNAN
Directorate General of Estate Crops
Keterangan/Note :
1. Angka Sementara/Preliminary*)
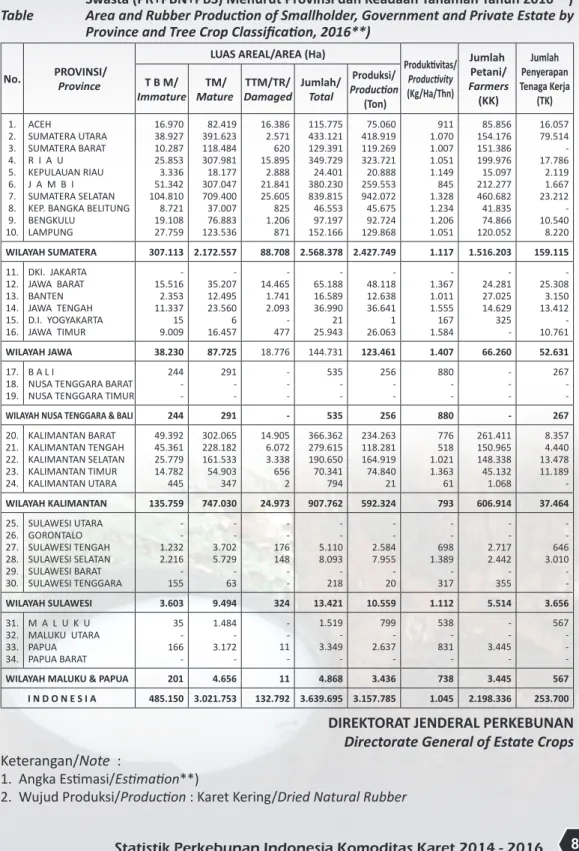
Tabel 6.
Luas Areal dan Produksi Karet Perkebunan Rakyat, Besar Negara dan Besar
Swasta (PR+PBN+PBS) Menurut Provinsi dan Keadaan Tanaman Tahun 2016**)
Table
Area and Rubber Production of Smallholder, Government and Private Estate by
Province and Tree Crop Classification, 2016**)
No.
PROVINSI/
Province
LUAS AREAL/AREA (Ha)
Produktivitas/
Productivity
(Kg/Ha/Thn)
Jumlah
Petani/
Farmers
(KK)
Jumlah
Penyerapan
Tenaga Kerja
(TK)
T B M/
Immature
Mature
TM/
Damaged
TTM/TR/
Jumlah/
Total
Produksi/
Production
(Ton)
1. 2. 3. 4. 5. 6. 7. 8. 9. 10. ACEH SUMATERA UTARA SUMATERA BARAT R I A U KEPULAUAN RIAU J A M B I SUMATERA SELATAN KEP. BANGKA BELITUNG BENGKULU LAMPUNG 16.970 38.927 10.287 25.853 3.336 51.342 104.810 8.721 19.108 27.759 82.419 391.623 118.484 307.981 18.177 307.047 709.400 37.007 76.883 123.536 16.386 2.571 620 15.895 2.888 21.841 25.605 825 1.206 871 115.775 433.121 129.391 349.729 24.401 380.230 839.815 46.553 97.197 152.166 75.060 418.919 119.269 323.721 20.888 259.553 942.072 45.675 92.724 129.868 911 1.070 1.007 1.051 1.149 845 1.328 1.234 1.206 1.051 85.856 154.176 151.386 199.976 15.097 212.277 460.682 41.835 74.866 120.052 16.057 79.514 - 17.786 2.119 1.667 23.212 - 10.540 8.220 WILAYAH SUMATERA 307.113 2.172.557 88.708 2.568.378 2.427.749 1.117 1.516.203 159.115 11. 12. 13. 14. 15. 16. DKI. JAKARTA JAWA BARAT BANTEN JAWA TENGAH D.I. YOGYAKARTA JAWA TIMUR - 15.516 2.353 11.337 15 9.009 - 35.207 12.495 23.560 6 16.457 - 14.465 1.741 2.093 - 477 - 65.188 16.589 36.990 21 25.943 - 48.118 12.638 36.641 1 26.063 - 1.367 1.011 1.555 167 1.584 - 24.281 27.025 14.629 325 - - 25.308 3.150 13.412 - 10.761 WILAYAH JAWA 38.230 87.725 18.776 144.731 123.461 1.407 66.260 52.631 17. 18. 19. B A L INUSA TENGGARA BARAT NUSA TENGGARA TIMUR
244 - - 291 - - - - - 535 - - 256 - - 880 - - - - - 267 - -
WILAYAH NUSA TENGGARA & BALI 244 291 - 535 256 880 - 267
20. 21. 22. 23. 24. KALIMANTAN BARAT KALIMANTAN TENGAH KALIMANTAN SELATAN KALIMANTAN TIMUR KALIMANTAN UTARA 49.392 45.361 25.779 14.782 445 302.065 228.182 161.533 54.903 347 14.905 6.072 3.338 656 2 366.362 279.615 190.650 70.341 794 234.263 118.281 164.919 74.840 21 776 518 1.021 1.363 61 261.411 150.965 148.338 45.132 1.068 8.357 4.440 13.478 11.189 - WILAYAH KALIMANTAN 135.759 747.030 24.973 907.762 592.324 793 606.914 37.464 25. 26. 27. 28. 29. 30. SULAWESI UTARA GORONTALO SULAWESI TENGAH SULAWESI SELATAN SULAWESI BARAT SULAWESI TENGGARA - - 1.232 2.216 - 155 - - 3.702 5.729 - 63 - - 176 148 - - - - 5.110 8.093 - 218 - - 2.584 7.955 - 20 - - 698 1.389 - 317 - - 2.717 2.442 - 355 - - 646 3.010 - - WILAYAH SULAWESI 3.603 9.494 324 13.421 10.559 1.112 5.514 3.656 31. 32. 33. 34. M A L U K U MALUKU UTARA PAPUA PAPUA BARAT 35 - 166 - 1.484 - 3.172 - - - 11 - 1.519 - 3.349 - 799 - 2.637 - 538 - 831 - - - 3.445 - 567 - - -
WILAYAH MALUKU & PAPUA 201 4.656 11 4.868 3.436 738 3.445 567
I N D O N E S I A 485.150 3.021.753 132.792 3.639.695 3.157.785 1.045 2.198.336 253.700
DIREKTORAT JENDERAL PERKEBUNAN
Directorate General of Estate Crops
Keterangan/Note :
1. Angka Estimasi/Estimation**)
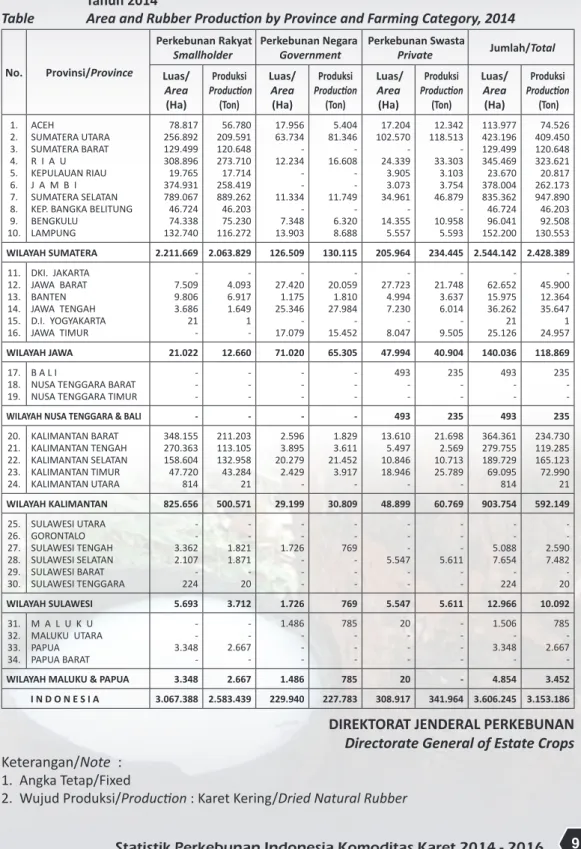
Tabel 7.
Luas Areal dan Produksi Karet Menurut Provinsi dan Status Pengusahaan
Tahun 2014
Table
Area and Rubber Production by Province and Farming Category, 2014
No.
Provinsi/Province
Perkebunan Rakyat
Smallholder
Perkebunan Negara
Government
Perkebunan Swasta
Private
Jumlah/Total
Luas/
Area
(Ha)
Produksi
Production
(Ton)
Luas/
Area
(Ha)
Produksi
Production
(Ton)
Luas/
Area
(Ha)
Produksi
Production
(Ton)
Luas/
Area
(Ha)
Produksi
Production
(Ton)
1. 2. 3. 4. 5. 6. 7. 8. 9. 10. ACEH SUMATERA UTARA SUMATERA BARAT R I A U KEPULAUAN RIAU J A M B I SUMATERA SELATAN KEP. BANGKA BELITUNG BENGKULU LAMPUNG 78.817 256.892 129.499 308.896 19.765 374.931 789.067 46.724 74.338 132.740 56.780 209.591 120.648 273.710 17.714 258.419 889.262 46.203 75.230 116.272 17.956 63.734 - 12.234 - - 11.334 - 7.348 13.903 5.404 81.346 - 16.608 - - 11.749 - 6.320 8.688 17.204 102.570 - 24.339 3.905 3.073 34.961 - 14.355 5.557 12.342 118.513 - 33.303 3.103 3.754 46.879 - 10.958 5.593 113.977 423.196 129.499 345.469 23.670 378.004 835.362 46.724 96.041 152.200 74.526 409.450 120.648 323.621 20.817 262.173 947.890 46.203 92.508 130.553 WILAYAH SUMATERA 2.211.669 2.063.829 126.509 130.115 205.964 234.445 2.544.142 2.428.389 11. 12. 13. 14. 15. 16. DKI. JAKARTA JAWA BARAT BANTEN JAWA TENGAH D.I. YOGYAKARTA JAWA TIMUR - 7.509 9.806 3.686 21 - - 4.093 6.917 1.649 1 - - 27.420 1.175 25.346 - 17.079 - 20.059 1.810 27.984 - 15.452 - 27.723 4.994 7.230 - 8.047 - 21.748 3.637 6.014 - 9.505 - 62.652 15.975 36.262 21 25.126 - 45.900 12.364 35.647 1 24.957 WILAYAH JAWA 21.022 12.660 71.020 65.305 47.994 40.904 140.036 118.869 17. 18. 19. B A L INUSA TENGGARA BARAT NUSA TENGGARA TIMUR
- - - - - - - - - - - - 493 - - 235 - - 493 - - 235 - -
WILAYAH NUSA TENGGARA & BALI - - - - 493 235 493 235
20. 21. 22. 23. 24. KALIMANTAN BARAT KALIMANTAN TENGAH KALIMANTAN SELATAN KALIMANTAN TIMUR KALIMANTAN UTARA 348.155 270.363 158.604 47.720 814 211.203 113.105 132.958 43.284 21 2.596 3.895 20.279 2.429 - 1.829 3.611 21.452 3.917 - 13.610 5.497 10.846 18.946 - 21.698 2.569 10.713 25.789 - 364.361 279.755 189.729 69.095 814 234.730 119.285 165.123 72.990 21 WILAYAH KALIMANTAN 825.656 500.571 29.199 30.809 48.899 60.769 903.754 592.149 25. 26. 27. 28. 29. 30. SULAWESI UTARA GORONTALO SULAWESI TENGAH SULAWESI SELATAN SULAWESI BARAT SULAWESI TENGGARA - - 3.362 2.107 - 224 - - 1.821 1.871 - 20 - - 1.726 - - - - - 769 - - - - - - 5.547 - - - - - 5.611 - - - - 5.088 7.654 - 224 - - 2.590 7.482 - 20 WILAYAH SULAWESI 5.693 3.712 1.726 769 5.547 5.611 12.966 10.092 31. 32. 33. 34. M A L U K U MALUKU UTARA PAPUA PAPUA BARAT - - 3.348 - - - 2.667 - 1.486 - - - 785 - - - 20 - - - - - - - 1.506 - 3.348 - 785 - 2.667 -
WILAYAH MALUKU & PAPUA 3.348 2.667 1.486 785 20 - 4.854 3.452
I N D O N E S I A 3.067.388 2.583.439 229.940 227.783 308.917 341.964 3.606.245 3.153.186
DIREKTORAT JENDERAL PERKEBUNAN
Directorate General of Estate Crops
Keterangan/Note :
1. Angka Tetap/Fixed
Tabel 8.
Luas Areal dan Produksi Karet Menurut Provinsi dan Status Pengusahaan
Tahun 2015*)
Table
Area and Rubber Production by Province and Farming Category, 2015*)
No.
Provinsi/Province
Perkebunan Rakyat
Smallholder
Perkebunan Negara
Government
Perkebunan Swasta
Private
Jumlah/Total
Luas/
Area
(Ha)
Produksi
Production
(Ton)
Luas/
Area
(Ha)
Produksi
Production
(Ton)
Luas/
Area
(Ha)
Produksi
Production
(Ton)
Luas/
Area
(Ha)
Produksi
Production
(Ton)
1. 2. 3. 4. 5. 6. 7. 8. 9. 10. ACEH SUMATERA UTARA SUMATERA BARAT R I A U KEPULAUAN RIAU J A M B I SUMATERA SELATAN KEP. BANGKA BELITUNG BENGKULU LAMPUNG 78.970 256.776 129.212 310.336 20.116 376.681 789.879 46.610 74.214 132.193 55.396 204.483 117.707 267.039 17.282 252.121 867.589 45.077 73.396 113.438 18.031 64.001 - 12.285 - - 11.381 - 7.378 13.961 5.430 81.736 - 16.688 - - 11.805 - 6.350 8.730 17.831 106.309 - 25.226 4.047 3.185 36.236 - 14.878 5.759 12.954 124.387 - 34.954 3.257 3.940 49.202 - 11.501 5.870 114.832 427.086 129.212 347.847 24.163 379.866 837.496 46.610 96.470 151.913 73.780 410.606 117.707 318.681 20.539 256.061 928.596 45.077 91.247 128.038 WILAYAH SUMATERA 2.214.987 2.013.528 127.037 130.739 213.471 246.065 2.555.495 2.390.332 11. 12. 13. 14. 15. 16. DKI. JAKARTA JAWA BARAT BANTEN JAWA TENGAH D.I. YOGYAKARTA JAWA TIMUR - 7.499 9.960 3.645 21 - - 3.993 6.748 1.608 1 - - 27.534 1.180 25.452 - 17.151 - 20.155 1.819 28.118 - 15.526 - 28.734 5.176 7.493 - 8.341 - 22.826 3.817 6.312 - 9.976 - 63.767 16.316 36.590 21 25.492 - 46.974 12.384 36.038 1 25.502 WILAYAH JAWA 21.125 12.350 71.317 65.618 49.744 42.931 142.186 120.899 17. 18. 19. B A L INUSA TENGGARA BARAT NUSA TENGGARA TIMUR
- - - - - - - - - - - - 511 - - 247 - - 511 - - 247 - -
WILAYAH NUSA TENGGARA & BALI - - - - 511 247 511 247
20. 21. 22. 23. 24. KALIMANTAN BARAT KALIMANTAN TENGAH KALIMANTAN SELATAN KALIMANTAN TIMUR KALIMANTAN UTARA 348.877 269.839 158.360 47.495 803 206.055 110.348 129.717 42.229 21 2.606 3.911 20.364 2.439 - 1.838 3.628 21.555 3.936 - 14.106 5.698 11.242 19.637 - 22.773 2.696 11.244 27.067 - 365.589 279.448 189.966 69.571 803 230.666 116.672 162.516 73.232 21 WILAYAH KALIMANTAN 825.374 488.370 29.320 30.957 50.683 63.780 905.377 583.107 25. 26. 27. 28. 29. 30. SULAWESI UTARA GORONTALO SULAWESI TENGAH SULAWESI SELATAN SULAWESI BARAT SULAWESI TENGGARA - - 3.371 2.088 - 221 - - 1.777 1.825 - 20 - - 1.734 - - - - - 773 - - - - - - 5.749 - - - - - 5.889 - - - - 5.105 7.837 - 221 - - 2.550 7.714 - 20 WILAYAH SULAWESI 5.680 3.622 1.734 773 5.749 5.889 13.163 10.284 31. 32. 33. 34. M A L U K U MALUKU UTARA PAPUA PAPUA BARAT - - 3.342 - - - 2.602 - 1.492 - - - 789 - - - 21 - - - - - - - 1.513 - 3.342 - 789 - 2.602 -
WILAYAH MALUKU & PAPUA 3.342 2.602 1.492 789 21 - 4.855 3.391
I N D O N E S I A 3.070.508 2.520.472 230.900 228.876 320.179 358.912 3.621.587 3.108.260
DIREKTORAT JENDERAL PERKEBUNAN
Directorate General of Estate Crops
Keterangan/Note :
1. Angka Sementara/Preliminary*)
Tabel 9.
Luas Areal dan Produksi Karet Menurut Provinsi dan Status Pengusahaan
Tahun 2016**)
Table
Area and Rubber Production by Province and Farming Category, 2016**)
No.
Provinsi/Province
Perkebunan Rakyat
Smallholder
Perkebunan Negara
Government
Perkebunan Swasta
Private
Jumlah/Total
Luas/
Area
(Ha)
Produksi
Production
(Ton)
Luas/
Area
(Ha)
Produksi
Production
(Ton)
Luas/
Area
(Ha)
Produksi
Production
(Ton)
Luas/
Area
(Ha)
Produksi
Production
(Ton)
1. 2. 3. 4. 5. 6. 7. 8. 9. 10. ACEH SUMATERA UTARA SUMATERA BARAT R I A U KEPULAUAN RIAU J A M B I SUMATERA SELATAN KEP. BANGKA BELITUNG BENGKULU LAMPUNG 79.013 257.593 129.391 310.990 20.163 376.895 790.458 46.553 74.217 132.126 56.131 207.197 119.269 270.584 17.511 255.468 879.105 45.675 74.370 114.944 18.094 64.225 - 12.328 - - 11.420 - 7.403 14.010 5.497 82.750 - 16.895 - - 11.951 - 6.429 8.838 18.668 111.303 - 26.411 4.238 3.335 37.937 - 15.577 6.030 13.432 128.972 - 36.242 3.377 4.085 51.016 - 11.925 6.086 115.775 433.121 129.391 349.729 24.401 380.230 839.815 46.553 97.197 152.166 75.060 418.919 119.269 323.721 20.888 259.553 942.072 45.675 92.724 129.868 WILAYAH SUMATERA 2.217.399 2.040.254 127.480 132.360 223.499 255.135 2.568.378 2.427.749 11. 12. 13. 14. 15. 16. DKI. JAKARTA JAWA BARAT BANTEN JAWA TENGAH D.I. YOGYAKARTA JAWA TIMUR - 7.474 9.985 3.605 21 - - 4.046 6.838 1.629 1 - - 27.630 1.184 25.541 - 17.211 - 20.405 1.842 28.467 - 15.719 - 30.084 5.420 7.844 - 8.732 - 23.667 3.958 6.545 - 10.344 - 65.188 16.589 36.990 21 25.943 - 48.118 12.638 36.641 1 26.063 WILAYAH JAWA 21.085 12.514 71.566 66.433 52.080 44.514 144.731 123.461 17. 18. 19. B A L INUSA TENGGARA BARAT NUSA TENGGARA TIMUR
- - - - - - - - - - - - 535 - - 256 - - 535 - - 256 - -
WILAYAH NUSA TENGGARA & BALI - - - - 535 256 535 256
20. 21. 22. 23. 24. KALIMANTAN BARAT KALIMANTAN TENGAH KALIMANTAN SELATAN KALIMANTAN TIMUR KALIMANTAN UTARA 348.977 269.725 158.444 47.334 794 208.790 111.813 131.439 42.790 21 2.616 3.925 20.436 2.447 - 1.861 3.673 21.822 3.985 - 14.769 5.965 11.770 20.560 - 23.612 2.795 11.658 28.065 - 366.362 279.615 190.650 70.341 794 234.263 118.281 164.919 74.840 21 WILAYAH KALIMANTAN 825.274 494.853 29.424 31.341 53.064 66.130 907.762 592.324 25. 26. 27. 28. 29. 30. SULAWESI UTARA GORONTALO SULAWESI TENGAH SULAWESI SELATAN SULAWESI BARAT SULAWESI TENGGARA - - 3.370 2.074 - 218 - - 1.801 1.849 - 20 - - 1.740 - - - - - 783 - - - - - - 6.019 - - - - - 6.106 - - - - 5.110 8.093 - 218 - - 2.584 7.955 - 20 WILAYAH SULAWESI 5.662 3.670 1.740 783 6.019 6.106 13.421 10.559 31. 32. 33. 34. M A L U K U MALUKU UTARA PAPUA PAPUA BARAT - - 3.349 - - - 2.637 - 1.497 - - - 799 - - - 22 - - - - - - - 1.519 - 3.349 - 799 - 2.637 -
WILAYAH MALUKU & PAPUA 3.349 2.637 1.497 799 22 - 4.868 3.436
I N D O N E S I A 3.072.769 2.553.928 231.707 231.716 335.219 372.141 3.639.695 3.157.785
DIREKTORAT JENDERAL PERKEBUNAN
Directorate General of Estate Crops
Keterangan/Note :
1. Angka Estimasi/Estimation**)
Tabel 10.
Luas Tanaman Menghasilkan (TM) dan Produksi Karet Menurut Provinsi dan
Status Pengusahaan Tahun 2014
Table
Mature Area and Rubber Production by Province and Farming Category, 2014
No.
Provinsi/Province
Perkebunan Rakyat
Smallholder
Perkebunan Negara
Government Estate
Perkebunan Swasta
Private Estate
Jumlah/Total
Luas TM/
Mature
(Ha)
Produksi
Production
(Ton)
Luas TM/
Mature
(Ha)
Produksi
Production
(Ton)
Luas TM/
Mature
(Ha)
Produksi
Production
(Ton)
Luas TM/
Mature
(Ha)
Produksi
Production
(Ton)
1. 2. 3. 4. 5. 6. 7. 8. 9. 10. ACEH SUMATERA UTARA SUMATERA BARAT R I A U KEPULAUAN RIAU J A M B I SUMATERA SELATAN KEP. BANGKA BELITUNG BENGKULU LAMPUNG 65.665 252.270 118.243 272.473 15.230 303.094 671.583 36.931 62.704 111.716 56.780 209.591 120.648 273.710 17.714 258.419 889.262 46.203 75.230 116.272 5.769 54.011 - 8.804 - - 6.942 - 4.392 5.939 5.404 81.346 - 16.608 - - 11.749 - 6.320 8.688 9.959 77.787 - 24.035 2.687 3.073 27.141 - 8.871 5.167 12.342 118.513 - 33.303 3.103 3.754 46.879 - 10.958 5.593 81.393 384.068 118.243 305.312 17.917 306.167 705.666 36.931 75.967 122.822 74.526 409.450 120.648 323.621 20.817 262.173 947.890 46.203 92.508 130.553 WILAYAH SUMATERA 1.909.909 2.063.829 85.857 130.115 158.720 234.445 2.154.486 2.428.389 11. 12. 13. 14. 15. 16. DKI. JAKARTA JAWA BARAT BANTEN JAWA TENGAH D.I. YOGYAKARTA JAWA TIMUR - 5.147 7.820 1.570 6 - - 4.093 6.917 1.649 1 - - 16.039 1.175 17.230 - 10.172 - 20.059 1.810 27.984 - 15.452 - 12.798 3.203 4.262 - 5.719 - 21.748 3.637 6.014 - 9.505 - 33.984 12.198 23.062 6 15.891 - 45.900 12.364 35.647 1 24.957 WILAYAH JAWA 14.543 12.660 44.616 65.305 25.982 40.904 85.141 118.869 17. 18. 19. B A L INUSA TENGGARA BARAT NUSA TENGGARA TIMUR
- - - - - - - - - - - - 268 - - 235 - - 268 - - 235 - -
WILAYAH NUSA TENGGARA & BALI - - - - 268 235 268 235
20. 21. 22. 23. 24. KALIMANTAN BARAT KALIMANTAN TENGAH KALIMANTAN SELATAN KALIMANTAN TIMUR KALIMANTAN UTARA 285.407 222.881 137.295 33.895 347 211.203 113.105 132.958 43.284 21 1.298 2.486 16.372 2.409 - 1.829 3.611 21.452 3.917 - 13.610 2.158 6.873 17.059 - 21.698 2.569 10.713 25.789 - 300.315 227.525 160.540 53.363 347 234.730 119.285 165.123 72.990 21 WILAYAH KALIMANTAN 679.825 500.571 22.565 30.809 39.700 60.769 742.090 592.149 25. 26. 27. 28. 29. 30. SULAWESI UTARA GORONTALO SULAWESI TENGAH SULAWESI SELATAN SULAWESI BARAT SULAWESI TENGGARA - - 2.602 1.290 - 63 - - 1.821 1.871 - 20 - - 1.086 - - - - - 769 - - - - - - 4.089 - - - - - 5.611 - - - - 3.688 5.379 - 63 - - 2.590 7.482 - 20 WILAYAH SULAWESI 3.955 3.712 1.086 769 4.089 5.611 9.130 10.092 31. 32. 33. 34. M A L U K U MALUKU UTARA PAPUA PAPUA BARAT - - 3.165 - - - 2.667 - 1.473 - - - 785 - - - - - - - - - - - 1.473 - 3.165 - 785 - 2.667 -
WILAYAH MALUKU & PAPUA 3.165 2.667 1.473 785 - - 4.638 3.452
I N D O N E S I A 2.611.397 2.583.439 155.597 227.783 228.759 341.964 2.995.753 3.153.186
DIREKTORAT JENDERAL PERKEBUNAN
Directorate General of Estate Crops
Keterangan/Note :
1. Angka Tetap/Fixed
Tabel 11.
Luas Tanaman Menghasilkan (TM) Dan Produksi Karet Menurut Provinsi dan
Status Pengusahaan Tahun 2015*)
Tabel
Mature Area and Rubber Production by Province and Farming Category, 2015*)
No.
Provinsi/Province
Perkebunan Rakyat
Smallholder
Perkebunan Negara
Government Estate
Perkebunan Swasta
Private Estate
Jumlah/Total
Luas TM/
Mature
(Ha)
Produksi
Production
(Ton)
Luas TM/
Mature
(Ha)
Produksi
Production
(Ton)
Luas TM/
Mature
(Ha)
Produksi
Production
(Ton)
Luas TM/
Mature
(Ha)
Produksi
Production
(Ton)
1. 2. 3. 4. 5. 6. 7. 8. 9. 10. ACEH SUMATERA UTARA SUMATERA BARAT R I A U KEPULAUAN RIAU J A M B I SUMATERA SELATAN KEP. BANGKA BELITUNG BENGKULU LAMPUNG 65.577 251.933 118.085 272.108 15.210 302.689 670.685 36.882 62.620 111.567 55.396 204.483 117.707 267.039 17.282 252.121 867.589 45.077 73.396 113.438 5.793 54.238 - 8.841 - - 6.971 - 4.410 5.964 5.430 81.736 - 16.688 - - 11.805 - 6.350 8.730 10.322 80.623 - 24.911 2.785 3.185 28.131 - 9.194 5.355 12.954 124.387 - 34.954 3.257 3.940 49.202 - 11.501 5.870 81.692 386.794 118.085 305.860 17.995 305.874 705.787 36.882 76.224 122.886 73.780 410.606 117.707 318.681 20.539 256.061 928.596 45.077 91.247 128.038 WILAYAH SUMATERA 1.907.356 2.013.528 86.217 130.739 164.506 246.065 2.158.079 2.390.332 11. 12. 13. 14. 15. 16. DKI. JAKARTA JAWA BARAT BANTEN JAWA TENGAH D.I. YOGYAKARTA JAWA TIMUR - 5.140 7.809 1.568 6 - - 3.993 6.748 1.608 1 - - 16.106 1.180 17.302 - 10.215 - 20.155 1.819 28.118 - 15.526 - 13.265 3.320 4.417 - 5.928 - 22.826 3.817 6.312 - 9.976 - 34.511 12.309 23.287 6 16.143 - 46.974 12.384 36.038 1 25.502 WILAYAH JAWA 14.523 12.350 44.803 65.618 26.930 42.931 86.256 120.899 17. 18. 19. B A L INUSA TENGGARA BARAT NUSA TENGGARA TIMUR
- - - - - - - - - - - - 278 - - 247 - - 278 - - 247 - -
WILAYAH NUSA TENGGARA & BALI - - - - 278 247 278 247
20. 21. 22. 23. 24. KALIMANTAN BARAT KALIMANTAN TENGAH KALIMANTAN SELATAN KALIMANTAN TIMUR KALIMANTAN UTARA 285.025 222.583 137.111 33.850 346 206.055 110.348 129.717 42.229 21 1.303 2.496 16.441 2.419 - 1.838 3.628 21.555 3.936 - 14.106 2.237 7.124 17.681 - 22.773 2.696 11.244 27.067 - 300.434 227.316 160.676 53.950 346 230.666 116.672 162.516 73.232 21 WILAYAH KALIMANTAN 678.915 488.370 22.659 30.957 41.148 63.780 742.722 583.107 25. 26. 27. 28. 29. 30. SULAWESI UTARA GORONTALO SULAWESI TENGAH SULAWESI SELATAN SULAWESI BARAT SULAWESI TENGGARA - - 2.598 1.288 - 63 - - 1.777 1.825 - 20 - - 1.091 - - - - - 773 - - - - - - 4.238 - - - - - 5.889 - - - - 3.689 5.526 - 63 - - 2.550 7.714 - 20 WILAYAH SULAWESI 3.949 3.622 1.091 773 4.238 5.889 9.278 10.284 31. 32. 33. 34. M A L U K U MALUKU UTARA PAPUA PAPUA BARAT - - 3.161 - - - 2.602 - 1.479 - - - 789 - - - - - - - - - - - 1.479 - 3.161 - 789 - 2.602 -
WILAYAH MALUKU & PAPUA 3.161 2.602 1.479 789 - - 4.640 3.391
I N D O N E S I A 2.607.904 2.520.472 156.249 228.876 237.100 358.912 3.001.253 3.108.260