Tree Crop Estate Statistics Of Indonesia
STATISTIK PERKEBUNAN INDONESIA
Direktorat Jenderal Perkebunan
Directorate General of Estate Crops
Jakarta, Desember 2014
Coconut
2013 - 2015
2013 - 2015
KELAPA
KELAPA
STATISTIK PERKEBUNAN INDONESIA 2013-2015
TREE CROP ESTATE STATISTICS OF INDONESIA 2013-2015
Naskah/Manuscript
Direktorat Jenderal Perkebunan,
Directorate General of Estate Crops
Kementerian Pertanian
Ministry of Agriculture
Penasehat/Advisor:
Ir. Irmijati Rachmi Nurbahar, M.Sc.
Penyunting/Senior Editors:
Ir. Ida Yunia Soependi, M.Sc.
Yanuar Arianto, STP
Staf Penyunting/Editorial Staffs:
Widya Khonik Zuraina, S.Si
Eko Pudjianto, S.Kom
Asep Udin, S.Kom
Neny Kurniawati, S.Si
Susilo Novianto Damarjati, A.Md.
Diterbitkan oleh/Published by
Direktorat Jenderal Perkebunan
Directorate General of Estate Crops
Jl. Harsono RM No. 3 Gedung C
Pasar Minggu - Jakarta 12550
Kotak Pos 1060/Jkt,10010
Tlp. : 021 - 7815380 - 4
Fax. : 021 - 715486 - 7815586
Jakarta, Desember 2014
K
omoditas perkebunan merupakan andalan bagi pendapatan
nasional dan devisa negara Indonesia, yang dapat dilihat dari nilai
ekspor komoditas perkebunan, pada Tahun 2013 total ekspor
perkebunan mencapai US$ 29,476 milyar atau setara dengan Rp. 353,713
triliun (asumsi 1 US$=Rp.12.000). Kontribusi sub sektor perkebunan
terhadap perekonomian nasional semakin meningkat dan diharapkan
dapat memperkokoh pembangunan perkebunan secara menyeluruh. Agar
informasi perkebunan dapat tersebar secara luas, setiap tahun diterbitkan
Buku Statistik Perkebunan Indonesia yang menyajikan data secara handal,
sahih, objektif, mutakhir dan konsisten.
S
tatistik Perkebunan Indonesia Tahun 2013-2015 menyajikan data luas areal, produksi,
produktivitas baik secara nasional maupun provinsi menurut status pengusahaannya
yaitu Perkebunan Rakyat, Perkebunan Besar Negara dan Perkebunan Besar Swasta.
Penyajian data juga dilengkapi dengan data ekspor dan impor untuk masing-masing komoditas
yang mencakup negara tujuan/asal, volume dan nilai, harga di dalam dan luar negeri serta untuk
beberapa komoditas tertentu disajikan data keseimbangan dunia.
D
ata yang disajikan merupakan hasil sinkronisasi dan validasi data statistik perkebunan
2013-2015 yang dilaksanakan secara berjenjang dari tingkat kabupaten sampai tingkat
nasional dengan mengacu pada Pedoman Pelaksanaan Pengelolaan Data Komoditas
Perkebunan yang diterbitkan Direktorat Jenderal Perkebunan. Data tersebut meliputi angka
tetap (ATAP) Tahun 2013, angka sementara (ASEM) Tahun 2014 dan angka estimasi (AESTI)
Tahun 2015. Data yang disajikan bersumber dari data primer yang dikumpulkan dari dinas yang
membidangi perkebunan di provinsi dan data sekunder yang dikutip dari data yang diterbitkan
oleh Badan Pusat Statistik (BPS), Kementerian Perindustrian, Kementerian Perdagangan, Bank
Indonesia, dan publikasi yang diterbitkan oleh asosiasi-asosiasi perkebunan baik dalam maupun
luar negeri.
B
uku ini dapat diterbitkan, atas dukungan dan kerjasama yang baik dari berbagai pihak.
Untuk itu, pada kesempatan ini, kami mengucapkan terima kasih atas dukungan dan
kerjasama tersebut. Kami menyadari bahwa buku yang diterbitkan ini masih jauh dari
sempurna. Untuk itu, kritik dan saran yang sifatnya membangun sangat diharapkan sebagai
bahan masukan dalam perbaikan penerbitan di masa datang.
S
emoga apa yang disajikan dalam buku ini dapat digunakan oleh berbagai kalangan dan
para pengguna data serta dapat dijadikan acuan dalam pengambilan kebijakan.
Kata
Pengantar
Jakarta, Desember 2014
DIREKTUR JENDERAL PERKEBUNAN
Ir. Gamal Nasir, MS
T
he estate crop commodities is the mainstay of national income
and Indonesia’s foreign exchange wich can be seen from export
value of the estate crop commodities. In 2013, total export of the
estate crops was US $ 29,476 billion or equivalent to Rp. 353,713 trillion
(assumed 1 US $ = Rp. 12.000). The contribution of estate crops sub sector
to the national economy tends to increase from year to year and expected
to strengthen overall national development. Furthermore, to spread
estate crops information widely, The Estate Crop Statistics of Indonesia is
published every year that presented reliable, valid, objective, up to date
and consistent data.
T
he Estate Crop Statistics of Indonesia 2013-2015 presents area, production and
productivity data by province and district level of smallhoder, government and private
estates. It is completed by volume, value of both export and import data, price data for
domestic and world market and also world balance data for some commodities.
D
ata presented are the result of synchronization and validation of the estate crop
statistical data 2013-2015 which are held hierarchical from the district to the national
level by using guidelines of data management of estate crop commodities. In this edition,
data of the 2013 are presented as fixed data, data of the 2013 are the preliminary data and data
of the 2014 are the estimation. The primary data were collected from the Estate Crops Province
Level and the secondary data were collected from related instution such as Board of Central
Statistics, Ministry of Industry, Ministry of Trade, Central Bank of Indonesia, the publication of
Estate Commodity Associations and others.
I
t would have been impossible to compile this book without substantional support and
contribution from many instutions. At this opportunity, we would like to thank all for their
support and cooperation. We realize that the publication still needs further improvement.
We would greatly appreciate comments and suggestions for future improvement.
H
opefully this publication will have high values for users and references for policy
makers.
Preface
Jakarta, December 2014
DIRECTOR GENERAL OF ESTATE CROPS
Ir. Gamal Nasir, MS
Kata Pengantar
Preface
...
iii
Daftar Isi
Contents
...
v
Daftar Gambar
List of Figures ...
vi
Daftar Tabel
List of Tables ...
vii
Daftar Isi
Contents
Daftar Gambar
List of Figures
Gambar 1. Perbandingan Luas Areal dan Produksi Kelapa
Menurut Status Pengusahaan Tahun 2013
Figure
Area and Production Comparison Graph of Coconut by
Farming Category, 2013 ...
1
Gambar 2. Perkembangan Luas Areal, Produksi, Produktivitas dan
Volume Ekspor-Impor Kelapa Tahun 2007-2013
Figure
Area, Production, Productivity and Export - Import Volume
Tabel 1.
Luas Areal dan Produksi Kelapa Menurut Status Pengusahaan
Tahun 1970-2015
Table
Area and Coconut Production by Farming Category, 1970-2015 ...
3
Tabel 2.
Volume dan Nilai Ekspor - Impor Kelapa Tahun 2005-2013
Table
Export - Import Volume and Value of Coconut, 2005-2013 ...
4
Tabel 3.
Volume dan Nilai Ekspor - Impor Kelapa Tahun 1969-2013
Table
Export - Import Volume and Value of Coconut, 1969-2013 ...
5
Tabel 4.
Luas Areal dan Produksi Kelapa Menurut Provinsi dan Status
Pengusahaan Tahun 2013
Table
Area and Coconut Production by Province and Farming Category, 2013 ...
6
Tabel 5.
Luas Areal dan Produksi Kelapa Menurut Provinsi dan Status
Pengusahaan Tahun 2014*)
Table
Area and Coconut Production by Province and Farming Category, 2014*)
7
Tabel 6.
Luas Areal dan Produksi Kelapa Menurut Provinsi dan Status
Pengusahaan Tahun 2015**)
Table
Area and Coconut Production by Province and Farming Category, 2015**)
8
Tabel 7.
Luas Tanaman Menghasilkan dan Produksi Kelapa Menurut Provinsi dan
Status Pengusahaan Tahun 2013
Table
Mature Area and Coconut Production by Province and Farming
Category, 2013 ...
9
Tabel 8.
Luas Tanaman Menghasilkan dan Produksi Kelapa Menurut Provinsi dan
Status Pengusahaan Tahun 2014*)
Table
Mature Area and Coconut Production by Province and Farming
Category, 2014*) ...
10
Tabel 9.
Luas Tanaman Menghasilkan dan Produksi Kelapa Menurut Provinsi dan
Status Pengusahaan Tahun 2015**)
Table
Mature Area and Coconut Production by Province and Farming
Category, 2015**) ...
11
Tabel 10.
Luas Areal dan Produksi Kelapa Perkebunan Rakyat, Besar Negara,
Besar Swasta Nasional dan Besar Swasta Asing (PR+PBN+PBS+PBSA)
Menurut Provinsi dan Keadaan Tanaman Tahun 2013
Table
Area and Coconut Production of Smallholder, Government,
National Private and Foreign Private Estate by Province and Tree
Crop Classification, 2013 ...
12
Daftar Tabel
List of Tables
Tabel 11.
Luas Areal dan Produksi Kelapa Perkebunan Rakyat, Besar Negara,
Besar Swasta Nasional dan Besar Swasta Asing (PR+PBN+PBS+PBSA)
Menurut Provinsi dan Keadaan Tanaman Tahun 2014*)
Table
Area and Coconut Production of Smallholder, Government, National
Private and Foreign Private Estate by Province and Tree
Crop Classification, 2014*) ...
13
Tabel 12.
Luas Areal dan Produksi Kelapa Perkebunan Rakyat, Besar Negara,
Besar Swasta Nasional dan Besar Swasta Asing (PR+PBN+PBSN+PBSA)
Menurut Provinsi dan Keadaan Tanaman Tahun 2015**)
Table
Area and Coconut Production of Smallholder, Government,
National Private and Foreign Private Estate by Province and Tree
Crop Classification, 2015**) ...
14
Tabel 13.
Luas Areal dan Produksi Kelapa Perkebunan Rakyat Menurut
Provinsi dan Keadaan Tanaman Tahun 2013
Table
Area and Coconut Production of Smallholder by Province and
Tree Crop Classification, 2013 ...
15
Tabel 14.
Luas Areal dan Produksi Kelapa Perkebunan Rakyat Menurut
Provinsi dan Keadaan Tanaman Tahun 2014*)
Table
Area and Coconut Production of Smallholder by Province and
Tree Crop Classification, 2014*) ...
16
Tabel 15.
Luas Areal dan Produksi Kelapa Perkebunan Rakyat Menurut
Provinsi dan Keadaan Tanaman Tahun 2015**)
Table
Area and Coconut Production of Smallholder by Province and
Tree Crop Classification, 2015**) ...
17
Tabel 16.
Luas Areal dan Produksi Kelapa Perkebunan Besar Negara
Menurut Provinsi dan Keadaan Tanaman Tahun 2013
Table
Area and Coconut Production of Government Estate by Province and
Tree Crop Classification, 2013 ...
18
Tabel 17.
Luas Areal dan Produksi Kelapa Perkebunan Besar Negara Menurut
Provinsi dan Keadaan Tanaman Tahun 2014*)
Table
Area and Coconut Production of Government Estate by Province and
Tree Crop Classification, 2014*) ...
19
Tabel 18.
Luas Areal dan Produksi Kelapa Perkebunan Besar Negara Menurut
Provinsi dan Keadaan Tanaman Tahun 2015**)
Table
Area and Coconut Production of Government Estate by Province and
Tree Crop Classification, 2015**) ...
20
Tabel 19.
Luas Areal dan Produksi Kelapa Perkebunan Besar Swasta Menurut
Provinsi dan Keadaan Tanaman Tahun 2013
Table
Area and Coconut Production of Private Estate by Province and
Tabel 20.
Luas Areal dan Produksi Kelapa Perkebunan Besar Swasta Menurut
Provinsi dan Keadaan Tanaman Tahun 2014*)
Table
Area and Coconut Production of Private Estate by Province and
Tree Crop Classification, 2014*) ...
22
Tabel 21.
Luas Areal dan Produksi Kelapa Perkebunan Besar Swasta Menurut
Provinsi dan Keadaan Tanaman Tahun 2015**)3
Table
Area and Coconut Production of Private Estate by Province and
Tree Crop Classification, 2015**) ...
23
Tabel 22.
Luas Areal dan Produksi Kelapa Dalam Menurut Provinsi dan Status
Pengusahaan Tahun 2013
Table
Area and Tall Coconut Production by Province and Farming
Category, 2013 ...
24
Tabel 23.
Luas Areal dan Produksi Kelapa Dalam Menurut Provinsi dan Status
Pengusahaan Tahun 2014*)
Table
Area and Tall Coconut Production by Province and Farming
Category, 2014*) ...
25
Tabel 24.
Luas Areal dan Produksi Kelapa Dalam Menurut Provinsi dan
Status Pengusahaan Tahun 2015**)
Table
Area and Tall Coconut Production by Province and Farming
Category, 2015**) ...
26
Tabel 25.
Luas Tanaman Menghasilkan dan Produksi Kelapa Dalam Menurut
Provinsi dan Status Pengusahaan Tahun 2013
Table
Mature Area and Tall Coconut Production by Province and Farming
Category, 2013 ...
27
Tabel 26.
Luas Tanaman Menghasilkan dan Produksi Kelapa Dalam Menurut
Provinsi dan Status Pengusahaan Tahun 2014*)
Table
Mature Area and Tall Coconut Production by Province and Farming
Category, 2014*) ...
28
Tabel 27.
Luas Tanaman Menghasilkan dan Produksi Kelapa Dalam Menurut
Provinsi dan Status Pengusahaan Tahun 2015**)
Table
Mature Area and Tall Coconut Production by Province and Farming
Category, 2015**) ...
29
Tabel 28.
Luas Areal dan Produksi Kelapa Dalam Perkebunan Rakyat Menurut
Provinsi dan Keadaan Tanaman Tahun 2013
Table
Area and Tall Coconut Production of Smallholder by Province and
Tree Crop Classification, 2013 ...
30
Tabel 29.
Luas Areal dan Produksi Kelapa Dalam Perkebunan Rakyat Menurut
Kabupaten dan Keadaan Tanaman Tahun 2013
Table
Area and Tall Coconut Production of Smallholder by District and
Tabel 30.
Luas Areal dan Produksi Kelapa Dalam Perkebunan Rakyat Menurut
Provinsi dan Keadaan Tanaman Tahun 2014*)
Table
Area and Tall Coconut Production of Smallholder by Province and
Tree Crop Classification, 2014*) ...
46
Tabel 31.
Luas Areal dan Produksi Kelapa Dalam Perkebunan Rakyat Menurut
Provinsi dan Keadaan Tanaman Tahun 2015**)
Table
Area and Tall Coconut Production of Smallholder by Province and
Tree Crop Classification, 2015**) ...
47
Tabel 32.
Luas Areal dan Produksi Kelapa Dalam Perkebunan Besar Negara
Menurut Provinsi dan Keadaan Tanaman Tahun 20138
Table
Area and Tall Coconut Production of Government Estate by Province and
Tree Crop Classification, 2013 ...
48
Tabel 33.
Luas Areal dan Produksi Kelapa Dalam Perkebunan Besar Negara
Menurut Kabupaten dan Keadaan Tanaman Tahun 2013
Table
Area and Tall Coconut Production of Government Estate by District and
Tree Crop Classification, 2013 ...
49
Tabel 34.
Luas Areal dan Produksi Kelapa Dalam Perkebunan Besar Negara
Menurut Provinsi dan Keadaan Tanaman Tahun 2014*)
Table
Area and Tall Coconut Production of Government Estate by Province and
Tree Crop Classification, 2014*) ...
50
Tabel 35.
Luas Areal dan Produksi Kelapa Dalam Perkebunan Besar Negara
Menurut Provinsi dan Keadaan Tanaman Tahun 2015**)
Table
Area and Tall Coconut Production of Government Estate by Province and
Tree Crop Classification, 2015**) ...
51
Tabel 36.
Luas Areal dan Produksi Kelapa Dalam Perkebunan Besar Swasta
Nasional dan Keadaan Tanaman Tahun 2013
Table
Area and Tall Coconut Production of National Private Estate
Province and Tree Crop Classification, 2013 ...
52
Tabel 37.
Luas Areal dan Produksi Kelapa Dalam Perkebunan Besar Swasta
Nasional Menurut Kabupaten dan Keadaan Tanaman Tahun 2013
Table
Area and Tall Coconut Production of National Private Estate by
District and Tree Crop Classification, 2013 ...
53
Tabel 38.
Luas Areal dan Produksi Kelapa Dalam Perkebunan Besar Swasta
Nasional Menurut Provinsi dan Keadaan Tanaman Tahun 2014*)
Table
Area and Tall Coconut Production of National Private Estate by
Province and Tree Crop Classification, 2014*) ...
55
Tabel 39.
Luas Areal dan Produksi Kelapa Dalam Perkebunan Besar Swasta
Nasional Seluruh Indonesia Menurut Propinsi dan Keadaan
Tanaman, 2015**)
Table
Area and Tall Coconut Production of National Private Estate by
Tabel 40.
Luas Areal dan Produksi Kelapa Dalam Perkebunan Besar Swasta Asing
Menurut Provinsi dan Keadaan Tanaman Tahun 2013
Table
Area and Tall Coconut Production of Foreign Private Estate by Province and
Tree Crop Classification, 2013 ...
57
Tabel 41.
Luas Areal dan Produksi Kelapa Dalam Perkebunan Besar Swasta Asing
Menurut Kabupaten dan Keadaan Tanaman Tahun 2013
Table
Area and Tall Coconut Production of Foreign Private Estate by
District and Tree Crop Classification, 2013 ...
58
Tabel 42.
Luas Areal dan Produksi Kelapa Dalam Perkebunan Besar Swasta Asing
Menurut Provinsi dan Keadaan Tanaman Tahun 2014*)
Table
Area and Tall Coconut Production of Foreign Private Estate by
Province and Tree Crop Classification, 2014*) ...
59
Tabel 43.
Luas Areal dan Produksi Kelapa Dalam Perkebunan Besar Swasta Asing
Menurut Provinsi dan Keadaan Tanaman Tahun 2015**)
Table
Area and Tall Coconut Production of Foreign Private Estate by
Province and Tree Crop Classification, 2015**) ...
60
Table 44.
Luas Areal dan Produksi Kelapa Hibrida Menurut Provinsi dan
Status Pengusahaan Tahun 2013
Table
Area and Hybrida Coconut Production by Province and Farming
Category, 2013 ...
61
Tabel 45.
Luas Areal dan Produksi Kelapa Hibrida Menurut Provinsi dan
Status Pengusahaan Tahun 2014*)
Table
Area and Hybrida Coconut Production by Province and Farming
Category, 2014*) ...
62
Tabel 46.
Luas Areal dan Produksi Kelapa Hibrida Menurut Provinsi dan
Status Pengusahaan Tahun 2015**)
Table
Area and Hybrida Coconut Production by Province and Farming
Category, 2015**) ...
63
Tabel 47.
Luas Tanaman Menghasilkan dan Produksi Kelapa Hibrida Menurut
Provinsi dan Status Pengusahaan Tahun 2013
Table
Mature Area and Hybrida Coconut Production by Province and
Farming Category, 2013 ...
64
Tabel 48.
Luas Tanaman Menghasilkan dan Produksi Kelapa Hibrida Menurut
Provinsi dan Status Pengusahaan Tahun 2014*)
Table
Mature Area and Hybrida Coconut Production by Province and Farming
Category, 2014*) ...
65
Tabel 49.
Luas Tanaman Menghasilkan dan Produksi Kelapa Hibrida Menurut
Provinsi dan Status Pengusahaan Tahun 2015**)
Table
Mature Area and Hybrida Coconut Production by Province and Farming
Tabel 50.
Luas Areal dan Produksi Kelapa Hibrida Perkebunan Rakyat Menurut
Provinsi dan Keadaan Tanaman Tahun 2013
Table
Area and Hybrida Coconut Production of Smallholder by Province and
Tree Crop Classification, 2013 ...
67
Tabel 51.
Luas Areal dan Produksi Kelapa Hibrida Perkebunan Rakyat Menurut
Kabupaten dan Keadaan Tanaman Tahun 2013
Table
Area and Hybrida Coconut Production of Smallholder by District and
Tree Crop Classification, 2013 ...
68
Tabel 52.
Luas Areal dan Produksi Kelapa Hibrida Perkebunan Rakyat Menurut
Provinsi dan Keadaan Tanaman Tahun 2014*)
Table
Area and Hybrida Coconut Production of Smallholder by Province and
Tree Crop Classification, 2014*) ...
73
Tabel 53.
Luas Areal dan Produksi Kelapa Hibrida Perkebunan Rakyat Menurut
Provinsi dan Keadaan Tanaman Tahun 2015**)
Table
Area and Hybrida Coconut Production of Smallholder by Province and
Tree Crop Classification, 2015**) ...
74
Tabel 54.
Luas Areal dan Produksi Kelapa Hibrida Perkebunan Besar Swasta
Menurut Provinsi dan Keadaan Tanaman Tahun 2013
Table
Area and Hybrida Coconut Production of Private Estate by Province and
Tree Crop Classification, 2013 ...
75
Tabel 55.
Luas Areal dan Produksi Kelapa Hibrida Perkebunan Besar Swasta
Menurut Kabupaten dan Keadaan Tanaman Tahun 2013
Table
Area and Hybrid Coconut Production of National Private Estates by
District and Tree Crop Classification, 2013 ...
76
Tabel 56.
Luas Areal dan Produksi Kelapa Hibrida Perkebunan Besar Swasta
Menurut Provinsi dan Keadaan Tanaman Tahun 2014*)
Table
Area and Hybrida Coconut Production of Private Estate by Province and
Tree Crop Classification, 2014*) ...
77
Tabel 57.
Luas Areal dan Produksi Kelapa Hibrida Perkebunan Besar Swasta
Menurut Provinsi dan Keadaan Tanaman Tahun 2015**)
Table
Area and Hybrida Coconut Production of Private Estate by Province and
Tree Crop Classification, 2015**) ...
78
Tabel 58.
Volume dan Nilai Ekspor-Impor Komoditi Kelapa Menurut
Negara Tujuan dan Asal Tahun 20139
Table
Export - Import Volume and Value of Coconut by Destination and
Origin Country, 2013 ...
79
Tabel 59.
Perkembangan Harga Rata-Rata Bulanan Kelapa di Pasar Domestik dan
Dunia Tahun 2013
Table
Monthly Average Price Trend of Coconut in Domestic and World
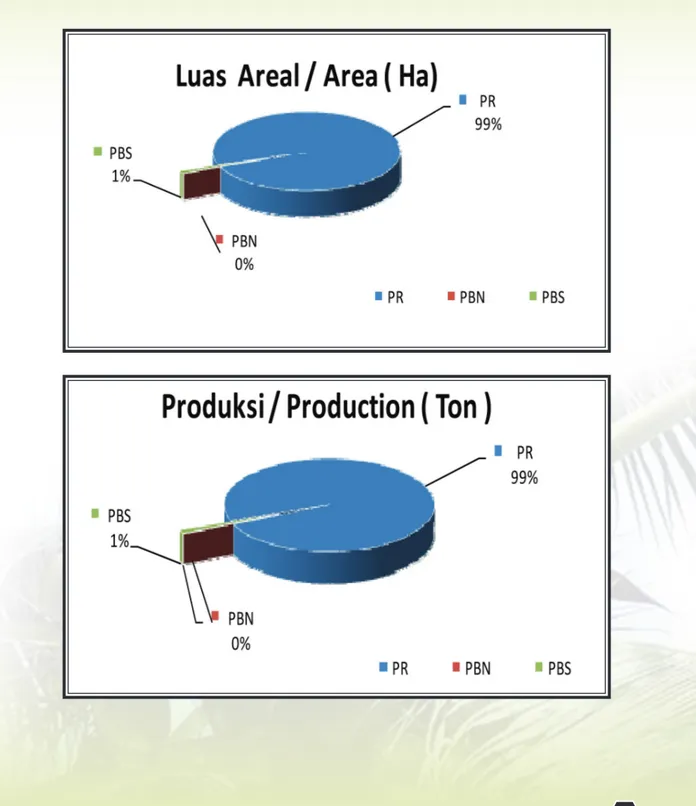
Gambar 1. Perbandingan Luas Areal dan Produksi Kelapa Menurut Status Pengusahaan
Tahun 2013
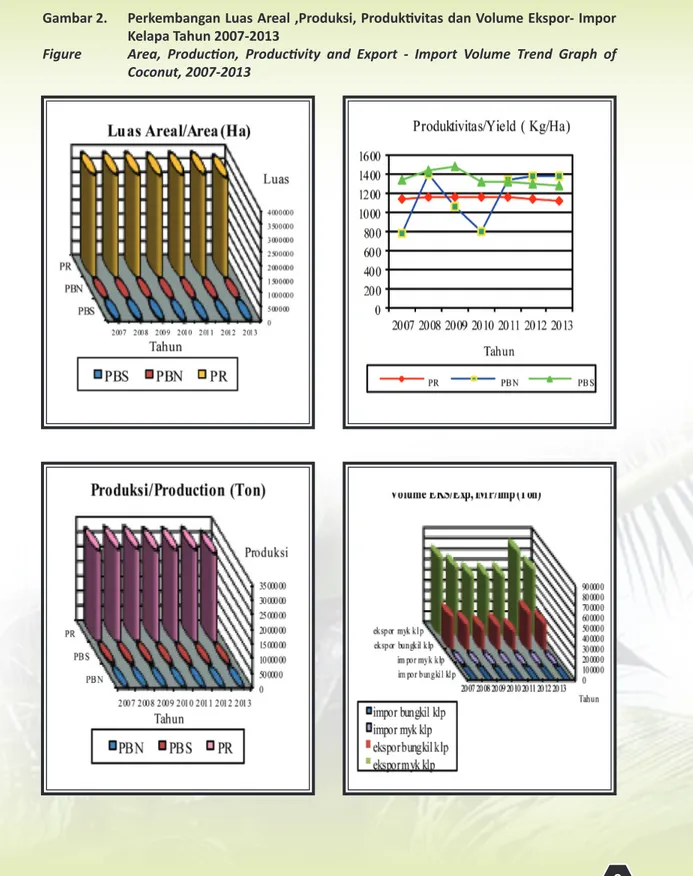
Gambar 2. Perkembangan Luas Areal ,Produksi, Produktivitas dan Volume Ekspor- Impor
Kelapa Tahun 2007-2013
Figure
Area, Production, Productivity and Export - Import Volume Trend Graph of
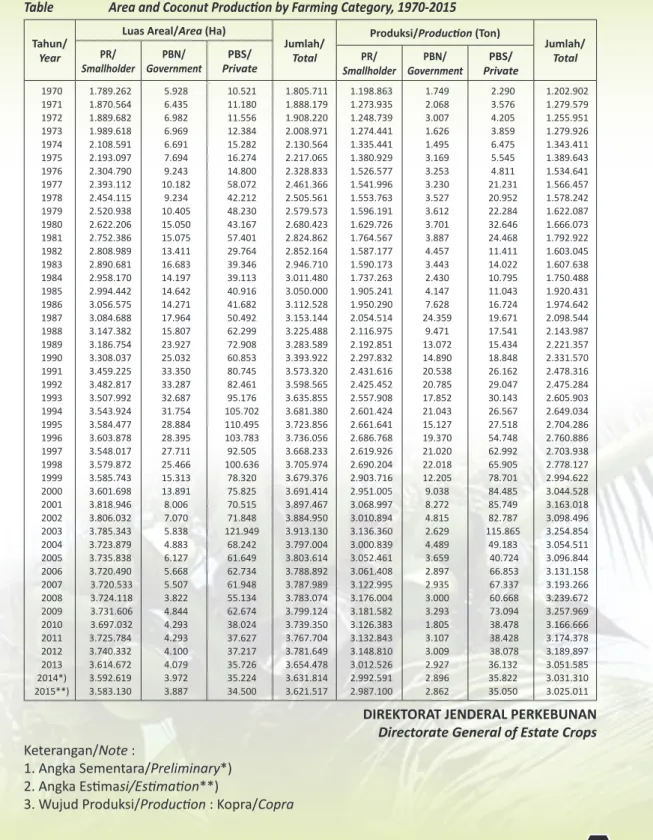
Tabel 1.
Luas Areal dan Produksi Kelapa Menurut Status Pengusahaan Tahun 1970-2015
Table
Area and Coconut Production by Farming Category, 1970-2015
Tahun/
Year
Luas Areal/Area (Ha)
Jumlah/
Total
Produksi/Production (Ton)
Jumlah/
Total
PR/
Smallholder
Government
PBN/
Private
PBS/
Smallholder
PR/
Government
PBN/
Private
PBS/
1970 1971 1972 1973 1974 1975 1976 1977 1978 1979 1980 1981 1982 1983 1984 1985 1986 1987 1988 1989 1990 1991 1992 1993 1994 1995 1996 1997 1998 1999 2000 2001 2002 2003 2004 2005 2006 2007 2008 2009 2010 2011 2012 2013 2014*) 2015**) 1.789.262 1.870.564 1.889.682 1.989.618 2.108.591 2.193.097 2.304.790 2.393.112 2.454.115 2.520.938 2.622.206 2.752.386 2.808.989 2.890.681 2.958.170 2.994.442 3.056.575 3.084.688 3.147.382 3.186.754 3.308.037 3.459.225 3.482.817 3.507.992 3.543.924 3.584.477 3.603.878 3.548.017 3.579.872 3.585.743 3.601.698 3.818.946 3.806.032 3.785.343 3.723.879 3.735.838 3.720.490 3.720.533 3.724.118 3.731.606 3.697.032 3.725.784 3.740.332 3.614.672 3.592.619 3.583.130 5.928 6.435 6.982 6.969 6.691 7.694 9.243 10.182 9.234 10.405 15.050 15.075 13.411 16.683 14.197 14.642 14.271 17.964 15.807 23.927 25.032 33.350 33.287 32.687 31.754 28.884 28.395 27.711 25.466 15.313 13.891 8.006 7.070 5.838 4.883 6.127 5.668 5.507 3.822 4.844 4.293 4.293 4.100 4.079 3.972 3.887 10.521 11.180 11.556 12.384 15.282 16.274 14.800 58.072 42.212 48.230 43.167 57.401 29.764 39.346 39.113 40.916 41.682 50.492 62.299 72.908 60.853 80.745 82.461 95.176 105.702 110.495 103.783 92.505 100.636 78.320 75.825 70.515 71.848 121.949 68.242 61.649 62.734 61.948 55.134 62.674 38.024 37.627 37.217 35.726 35.224 34.500 1.805.711 1.888.179 1.908.220 2.008.971 2.130.564 2.217.065 2.328.833 2.461.366 2.505.561 2.579.573 2.680.423 2.824.862 2.852.164 2.946.710 3.011.480 3.050.000 3.112.528 3.153.144 3.225.488 3.283.589 3.393.922 3.573.320 3.598.565 3.635.855 3.681.380 3.723.856 3.736.056 3.668.233 3.705.974 3.679.376 3.691.414 3.897.467 3.884.950 3.913.130 3.797.004 3.803.614 3.788.892 3.787.989 3.783.074 3.799.124 3.739.350 3.767.704 3.781.649 3.654.478 3.631.814 3.621.517 1.198.863 1.273.935 1.248.739 1.274.441 1.335.441 1.380.929 1.526.577 1.541.996 1.553.763 1.596.191 1.629.726 1.764.567 1.587.177 1.590.173 1.737.263 1.905.241 1.950.290 2.054.514 2.116.975 2.192.851 2.297.832 2.431.616 2.425.452 2.557.908 2.601.424 2.661.641 2.686.768 2.619.926 2.690.204 2.903.716 2.951.005 3.068.997 3.010.894 3.136.360 3.000.839 3.052.461 3.061.408 3.122.995 3.176.004 3.181.582 3.126.383 3.132.843 3.148.810 3.012.526 2.992.591 2.987.100 1.749 2.068 3.007 1.626 1.495 3.169 3.253 3.230 3.527 3.612 3.701 3.887 4.457 3.443 2.430 4.147 7.628 24.359 9.471 13.072 14.890 20.538 20.785 17.852 21.043 15.127 19.370 21.020 22.018 12.205 9.038 8.272 4.815 2.629 4.489 3.659 2.897 2.935 3.000 3.293 1.805 3.107 3.009 2.927 2.896 2.862 2.290 3.576 4.205 3.859 6.475 5.545 4.811 21.231 20.952 22.284 32.646 24.468 11.411 14.022 10.795 11.043 16.724 19.671 17.541 15.434 18.848 26.162 29.047 30.143 26.567 27.518 54.748 62.992 65.905 78.701 84.485 85.749 82.787 115.865 49.183 40.724 66.853 67.337 60.668 73.094 38.478 38.428 38.078 36.132 35.822 35.050 1.202.902 1.279.579 1.255.951 1.279.926 1.343.411 1.389.643 1.534.641 1.566.457 1.578.242 1.622.087 1.666.073 1.792.922 1.603.045 1.607.638 1.750.488 1.920.431 1.974.642 2.098.544 2.143.987 2.221.357 2.331.570 2.478.316 2.475.284 2.605.903 2.649.034 2.704.286 2.760.886 2.703.938 2.778.127 2.994.622 3.044.528 3.163.018 3.098.496 3.254.854 3.054.511 3.096.844 3.131.158 3.193.266 3.239.672 3.257.969 3.166.666 3.174.378 3.189.897 3.051.585 3.031.310 3.025.011
DIREKTORAT JENDERAL PERKEBUNAN
Directorate General of Estate Crops
Keterangan/Note :
1. Angka Sementara/Preliminary*)
2. Angka Estimasi/Estimation**)
Tabel 2.
Volume dan Nilai Ekspor - Impor Kelapa Tahun 2005-2013
Table
Export - Import Volume and Value of Coconut, 2005-2013
TAHUN
EKSPOR/EXPORT
IMPOR/IMPORT
VOLUME
(Ton)
(000 US$)
NILAI
VOLUME
(Ton)
(000 US$)
NILAI
2005
2006
2007
2008
2009
2010
2011
2012
2013
1.413.211
1.156.207
1.270.094
1.080.068
992.766
1.045.317
1.199.752
1.651.624
1.295.442
536.251
420.595
695.384
900.498
494.532
702.591
1.188.517
1.245.284
762.413
7.392
13.269
9.382
2.764
3.867
2.512
1.342
2.826
4.777
4.017
6.423
4.262
1.677
2.294
1.814
1.211
3.111
3.481
DIREKTORAT JENDERAL PERKEBUNAN
Directorate General of Estate Crops
Sumber/Source :
Badan Pusat Statistik
Central Bureau of Statistics
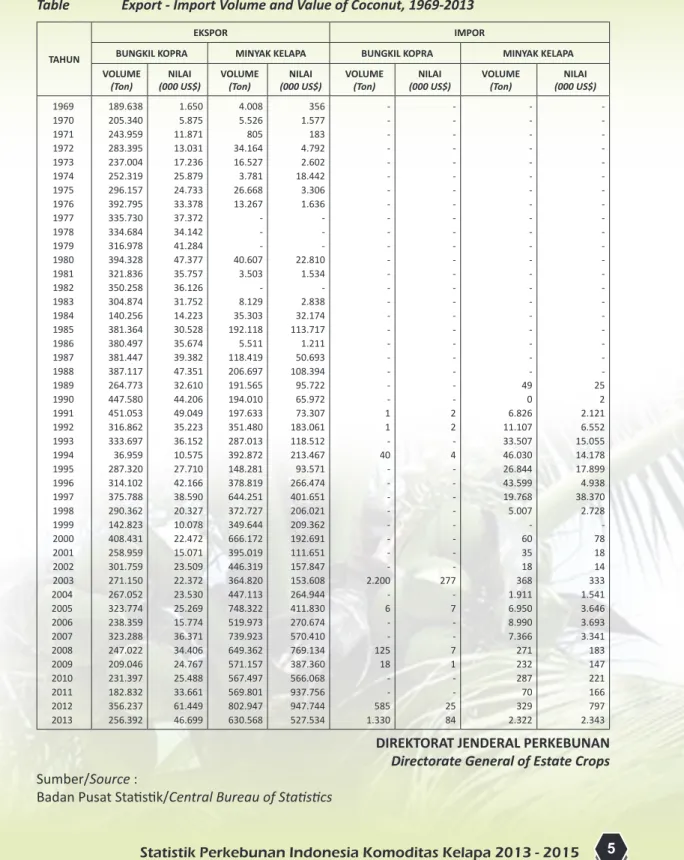
Tabel 3.
Volume dan Nilai Ekspor - Impor Kelapa Tahun 1969-2013
Table
Export - Import Volume and Value of Coconut, 1969-2013
TAHUN
EKSPOR IMPOR
BUNGKIL KOPRA MINYAK KELAPA BUNGKIL KOPRA MINYAK KELAPA VOLUME
(Ton) (000 US$)NILAI VOLUME(Ton) (000 US$)NILAI VOLUME(Ton) (000 US$)NILAI VOLUME(Ton) (000 US$)NILAI
1969 1970 1971 1972 1973 1974 1975 1976 1977 1978 1979 1980 1981 1982 1983 1984 1985 1986 1987 1988 1989 1990 1991 1992 1993 1994 1995 1996 1997 1998 1999 2000 2001 2002 2003 2004 2005 2006 2007 2008 2009 2010 2011 2012 2013 189.638 205.340 243.959 283.395 237.004 252.319 296.157 392.795 335.730 334.684 316.978 394.328 321.836 350.258 304.874 140.256 381.364 380.497 381.447 387.117 264.773 447.580 451.053 316.862 333.697 36.959 287.320 314.102 375.788 290.362 142.823 408.431 258.959 301.759 271.150 267.052 323.774 238.359 323.288 247.022 209.046 231.397 182.832 356.237 256.392 1.650 5.875 11.871 13.031 17.236 25.879 24.733 33.378 37.372 34.142 41.284 47.377 35.757 36.126 31.752 14.223 30.528 35.674 39.382 47.351 32.610 44.206 49.049 35.223 36.152 10.575 27.710 42.166 38.590 20.327 10.078 22.472 15.071 23.509 22.372 23.530 25.269 15.774 36.371 34.406 24.767 25.488 33.661 61.449 46.699 4.008 5.526 805 34.164 16.527 3.781 26.668 13.267 - - - 40.607 3.503 - 8.129 35.303 192.118 5.511 118.419 206.697 191.565 194.010 197.633 351.480 287.013 392.872 148.281 378.819 644.251 372.727 349.644 666.172 395.019 446.319 364.820 447.113 748.322 519.973 739.923 649.362 571.157 567.497 569.801 802.947 630.568 356 1.577 183 4.792 2.602 18.442 3.306 1.636 - - - 22.810 1.534 - 2.838 32.174 113.717 1.211 50.693 108.394 95.722 65.972 73.307 183.061 118.512 213.467 93.571 266.474 401.651 206.021 209.362 192.691 111.651 157.847 153.608 264.944 411.830 270.674 570.410 769.134 387.360 566.068 937.756 947.744 527.534 - - - - - - - - - - - - - - - - - - - - - - 1 1 - 40 - - - - - - - - 2.200 - 6 - - 125 18 - - 585 1.330 - - - - - - - - - - - - - - - - - - - - - - 2 2 - 4 - - - - - - - - 277 - 7 - - 7 1 - - 25 84 - - - - - - - - - - - - - - - - - - - - 49 0 6.826 11.107 33.507 46.030 26.844 43.599 19.768 5.007 - 60 35 18 368 1.911 6.950 8.990 7.366 271 232 287 70 329 2.322 - - - - - - - - - - - - - - - - - - - - 25 2 2.121 6.552 15.055 14.178 17.899 4.938 38.370 2.728 - 78 18 14 333 1.541 3.646 3.693 3.341 183 147 221 166 797 2.343
DIREKTORAT JENDERAL PERKEBUNAN
Directorate General of Estate Crops
Sumber/Source :
Tabel 4.
Luas Areal dan Produksi Kelapa Menurut Provinsi dan Status Pengusahaan
Tahun 2013
Table
Area and Coconut Production by Province and Farming Category, 2013
No.
Provinsi/Province
Perkebunan Rakyat
Smallholder
Perkebunan Negara
Government
Perkebunan Swasta
Private
Jumlah/Total
Luas/
Area
(Ha)
Produksi
Production
(Ton)
Luas/
Area
(Ha)
Produksi
Production
(Ton)
Luas/
Area
(Ha)
Produksi
Production
(Ton)
Luas/
Area
(Ha)
Produksi
Production
(Ton)
1. 2. 3. 4. 5. 6. 7. 8. 9. 10. ACEH SUMATERA UTARA SUMATERA BARAT R I A U KEPULAUAN RIAU J A M B I SUMATERA SELATAN KEP. BANGKA BELITUNG BENGKULU LAMPUNG 103.341 83.500 91.438 508.007 34.794 118.460 65.308 10.848 9.645 125.415 55.434 84.161 86.815 405.456 11.856 107.140 59.787 6.513 8.453 113.518 - - - - - - - - - - - - - - - - - - - - - 2.909 - 12.253 - - - - - 23 - 3.206 - 21.624 - - - - - - 103.341 86.409 91.438 520.260 34.794 118.460 65.308 10.848 9.645 125.438 55.434 87.367 86.815 427.080 11.856 107.140 59.787 6.513 8.453 113.518 WILAYAH SUMATERA 1.150.756 939.133 - - 15.185 24.830 1.165.941 963.963 11. 12. 13. 14. 15. 16. DKI. JAKARTA JAWA BARAT BANTEN JAWA TENGAH D.I. YOGYAKARTA JAWA TIMUR - 178.748 92.712 234.240 41.590 291.096 - 105.497 52.529 187.637 45.921 266.206 - - 50 555 - 1.907 - - 26 975 - 1.286 - 3.099 - 302 - 2.360 - 265 - 413 - 1.783 - 181.847 92.762 235.097 41.590 295.363 - 105.762 52.555 189.025 45.921 269.275 WILAYAH JAWA 838.386 657.790 2.513 2.287 5.761 2.461 846.660 662.538 17. 18. 19. B A L INUSA TENGGARA BARAT NUSA TENGGARA TIMUR
65.772 63.853 152.300 64.204 56.484 66.676 - - - - - - 216 - 418 125 - 174 65.988 63.853 152.718 64.330 56.484 66.850
WILAYAH NUSA TENGGARA & BALI 281.926 187.365 - - 634 299 282.560 187.664
20. 21. 22. 23. KALIMANTAN BARAT KALIMANTAN TENGAH KALIMANTAN SELATAN KALIMANTAN TIMUR 107.155 32.710 41.178 26.652 77.456 28.075 29.929 13.712 - - - - - - - - - - 514 - - - 306 - 107.155 32.710 41.692 26.652 77.456 28.075 30.235 13.712 WILAYAH KALIMANTAN 207.695 149.172 - - 514 306 208.209 149.478 24. 25. 26. 27. 28. 29. SULAWESI UTARA GORONTALO SULAWESI TENGAH SULAWESI SELATAN SULAWESI BARAT SULAWESI TENGGARA 268.677 67.405 214.995 108.992 49.710 57.435 277.025 64.003 189.572 79.993 45.285 42.699 1.566 - - - - - 641 - - - - - 8.356 3.332 538 1.407 - - 4.835 2.959 290 152 - - 278.600 70.737 215.533 110.399 49.710 57.435 282.500 66.962 189.862 80.145 45.285 42.699 WILAYAH SULAWESI 767.214 698.577 1.566 641 13.633 8.235 782.413 707.453 30. 31. 32. 33. M A L U K U MALUKU UTARA PAPUA PAPUA BARAT 110.252 214.120 23.670 20.652 95.992 251.391 15.604 17.501 - - - - - - - - - - - - - - - - 110.252 214.120 23.670 20.652 95.992 251.391 15.604 17.501
WILAYAH MALUKU & PAPUA 368.695 380.489 - - - - 368.695 380.489 I N D O N E S I A 3.614.672 3.012.526 4.079 2.927 35.726 36.132 3.654.478 3.051.585
DIREKTORAT JENDERAL PERKEBUNAN
Directorate General of Estate Crops
Keterangan/Note :
1. Angka Tetap/Fixed
Tabel 5.
Luas Areal dan Produksi Kelapa Menurut Provinsi dan Status Pengusahaan
Tahun 2014*)
Table
Area and Coconut Production by Province and Farming Category, 2014*)
No.
Provinsi/Province
Perkebunan Rakyat
Smallholder
Perkebunan Negara
Government
Perkebunan Swasta
Private
Jumlah/Total
Luas/
Area
(Ha)
Produksi
Production
(Ton)
Luas/
Area
(Ha)
Produksi
Production
(Ton)
Luas/
Area
(Ha)
Produksi
Production
(Ton)
Luas/
Area
(Ha)
Produksi
Production
(Ton)
1. 2. 3. 4. 5. 6. 7. 8. 9. 10. ACEH SUMATERA UTARA SUMATERA BARAT R I A U KEPULAUAN RIAU J A M B I SUMATERA SELATAN KEP. BANGKA BELITUNG BENGKULU LAMPUNG 103.938 83.750 92.332 505.139 34.555 119.197 67.740 11.102 9.640 121.815 55.706 84.413 87.353 396.803 11.782 114.350 61.583 6.602 8.378 109.163 - - - - - - - - - - - - - - - - - - - - - 2.868 - 12.090 - - - - - 23 - 3.178 - 21.444 - - - - - - 103.938 86.618 92.332 517.229 34.555 119.197 67.740 11.102 9.640 121.838 55.706 87.591 87.353 418.248 11.782 114.350 61.583 6.602 8.378 109.163 WILAYAH SUMATERA 1.149.208 936.133 - - 14.980 24.622 1.164.189 960.755 11. 12. 13. 14. 15. 16. DKI. JAKARTA JAWA BARAT BANTEN JAWA TENGAH D.I. YOGYAKARTA JAWA TIMUR - 177.475 90.540 234.194 39.510 288.587 - 104.744 51.331 187.576 44.956 268.512 - - 49 541 - 1.857 - - 26 964 - 1.272 - 3.056 - 298 - 2.325 - 263 - 409 - 1.767 - 180.531 90.589 235.032 39.510 292.769 - 105.008 51.357 188.949 44.956 271.551 WILAYAH JAWA 830.306 657.119 2.446 2.263 5.679 2.439 838.432 661.821 17. 18. 19. B A L INUSA TENGGARA BARAT NUSA TENGGARA TIMUR
65.788 63.225 151.405 64.225 56.032 66.403 - - - - - - 213 - 412 124 - 172 66.001 63.225 151.817 64.349 56.032 66.575
WILAYAH NUSA TENGGARA & BALI 280.419 186.660 - - 625 297 281.043 186.957
20. 21. 22. 23. 24. KALIMANTAN BARAT KALIMANTAN TENGAH KALIMANTAN SELATAN KALIMANTAN TIMUR KALIMANTAN UTARA 106.958 32.208 40.936 20.501 4.932 77.651 28.266 29.696 6.430 446 - - - - - - - - - - - - 507 - - - - 303 - - 106.958 32.208 41.443 20.501 4.932 77.651 28.266 29.999 6.430 446 WILAYAH KALIMANTAN 205.535 142.489 - - 507 303 206.043 142.793 25. 26. 27. 28. 29. 30. SULAWESI UTARA GORONTALO SULAWESI TENGAH SULAWESI SELATAN SULAWESI BARAT SULAWESI TENGGARA 268.490 68.415 213.869 108.130 49.340 57.055 277.795 64.447 184.990 79.112 44.763 42.410 1.525 - - - - - 634 - - - - - 8.232 3.283 530 1.387 - - 4.791 2.932 287 151 - - 278.247 71.698 214.399 109.517 49.340 57.055 283.219 67.380 185.277 79.262 44.763 42.410 WILAYAH SULAWESI 765.300 693.517 1.525 634 13.432 8.161 780.257 702.311 31. 32. 33. 34. M A L U K U MALUKU UTARA PAPUA PAPUA BARAT 109.494 208.779 23.244 20.334 95.458 248.758 15.228 17.228 - - - - - - - - - - - - - - - - 109.494 208.779 23.244 20.334 95.458 248.758 15.228 17.228
WILAYAH MALUKU & PAPUA 361.851 376.672 - - - - 361.851 376.672 I N D O N E S I A 3.592.619 2.992.591 3.972 2.896 35.224 35.822 3.631.814 3.031.310
DIREKTORAT JENDERAL PERKEBUNAN
Directorate General of Estate Crops
Keterangan/Note :
1. Angka Sementara/Preliminary*)
2. Wujud Produksi/Production : Kopra/Copra
Tabel 6.
Luas Areal dan Produksi Kelapa Menurut Provinsi dan Status Pengusahaan
Tahun 2015**)
Table
Area and Coconut Production by Province and Farming Category, 2015**)
No.
Provinsi/Province
Perkebunan Rakyat
Smallholder
Perkebunan Negara
Government
Perkebunan Swasta
Private
Jumlah/Total
Luas/
Area
(Ha)
Produksi
Production
(Ton)
Luas/
Area
(Ha)
Produksi
Production
(Ton)
Luas/
Area
(Ha)
Produksi
Production
(Ton)
Luas/
Area
(Ha)
Produksi
Production
(Ton)
1. 2. 3. 4. 5. 6. 7. 8. 9. 10. ACEH SUMATERA UTARA SUMATERA BARAT R I A U KEPULAUAN RIAU J A M B I SUMATERA SELATAN KEP. BANGKA BELITUNG BENGKULU LAMPUNG 104.263 84.000 92.885 502.185 34.430 119.549 69.312 11.253 9.544 119.063 56.124 84.766 87.814 390.060 11.715 119.124 63.578 6.867 8.327 108.584 - - - - - - - - - - - - - - - - - - - - - 2.809 - 11.841 - - - - - 22 - 3.109 - 20.982 - - - - - - 104.263 86.809 92.885 514.026 34.430 119.549 69.312 11.253 9.544 119.085 56.124 87.875 87.814 411.042 11.715 119.124 63.578 6.867 8.327 108.584 WILAYAH SUMATERA 1.146.484 936.959 - - 14.672 24.091 1.161.157 961.050 11. 12. 13. 14. 15. 16. DKI. JAKARTA JAWA BARAT BANTEN JAWA TENGAH D.I. YOGYAKARTA JAWA TIMUR - 176.064 89.336 234.150 39.030 285.537 - 103.905 50.392 186.451 44.867 275.100 - - 48 529 - 1.817 - - 26 953 - 1.257 - 2.993 - 291 - 2.277 - 257 - 400 - 1.729 - 179.057 89.384 234.971 39.030 289.632 - 104.162 50.418 187.804 44.867 278.086 WILAYAH JAWA 824.117 660.714 2.395 2.236 5.562 2.387 832.074 665.336 17. 18. 19. B A L INUSA TENGGARA BARAT NUSA TENGGARA TIMUR
65.928 63.187 150.712 64.307 55.640 66.099 - - - - - - 208 - 403 121 - 169 66.137 63.187 151.115 64.428 55.640 66.268
WILAYAH NUSA TENGGARA & BALI 279.827 186.046 - - 612 290 280.439 186.336
20. 21. 22. 23. 24. KALIMANTAN BARAT KALIMANTAN TENGAH KALIMANTAN SELATAN KALIMANTAN TIMUR KALIMANTAN UTARA 106.845 27.942 40.748 21.000 4.932 77.753 27.942 29.497 7.496 446 - - - - - - - - - - - - 497 - - - - 297 - - 106.845 27.942 41.245 21.000 4.932 77.753 27.942 29.794 7.496 446 WILAYAH KALIMANTAN 201.468 143.134 - - 497 297 201.965 143.431 25. 26. 27. 28. 29. 30. SULAWESI UTARA GORONTALO SULAWESI TENGAH SULAWESI SELATAN SULAWESI BARAT SULAWESI TENGGARA 278.149 70.558 212.861 107.636 49.114 56.673 278.450 64.444 181.001 78.325 44.252 41.693 1.493 - - - - - 626 - - - - - 8.063 3.215 519 1.359 - - 4.688 2.869 281 147 - - 287.705 73.774 213.380 108.994 49.114 56.673 283.764 67.313 181.283 78.473 44.252 41.693 WILAYAH SULAWESI 774.992 688.165 1.493 626 13.157 7.985 789.642 696.776 31. 32. 33. 34. M A L U K U MALUKU UTARA PAPUA PAPUA BARAT 108.184 204.846 23.035 20.177 93.770 246.411 14.886 17.015 - - - - - - - - - - - - - - - - 108.184 204.846 23.035 20.177 93.770 246.411 14.886 17.015
WILAYAH MALUKU & PAPUA 356.242 372.082 - - - - 356.242 372.082 I N D O N E S I A 3.583.130 2.987.100 3.887 2.862 34.500 35.050 3.621.517 3.025.011
DIREKTORAT JENDERAL PERKEBUNAN
Directorate General of Estate Crops
Keterangan/Note :
1. Angka Estimasi/Estimation**)
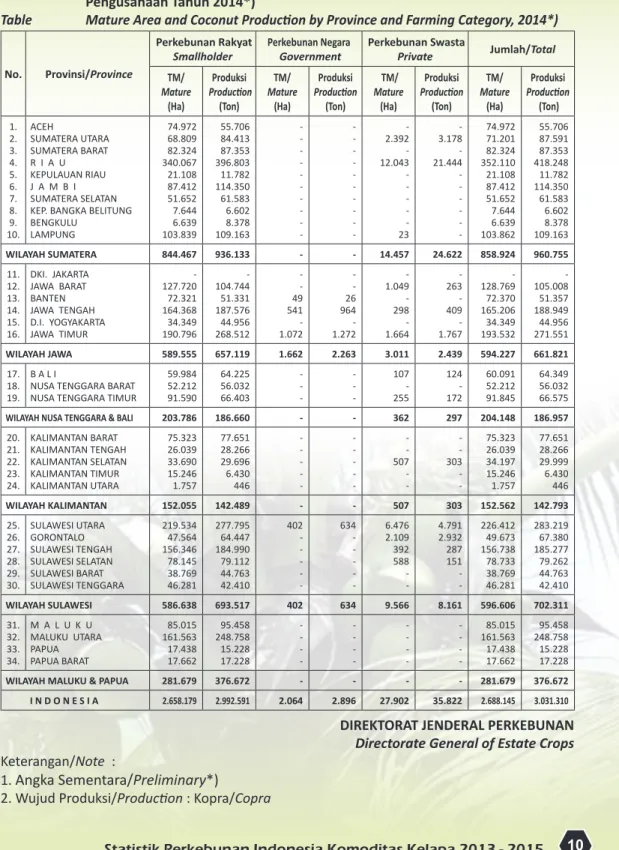
Tabel 7.
Luas Tanaman Menghasilkan dan Produksi Kelapa Menurut Provinsi dan Status
Pengusahaan Tahun 2013
Table
Mature Area and Coconut Production by Province and Farming Category, 2013
No.
Provinsi/Province
Perkebunan Rakyat
Smallholder
Perkebunan Negara
Government
Perkebunan Swasta
Private
Jumlah/Total
TM/
Mature
(Ha)
Produksi
Production
(Ton)
TM/
Mature
(Ha)
Produksi
Production
(Ton)
TM/
Mature
(Ha)
Produksi
Production
(Ton)
TM/
Mature
(Ha)
Produksi
Production
(Ton)
1. 2. 3. 4. 5. 6. 7. 8. 9. 10. ACEH SUMATERA UTARA SUMATERA BARAT R I A U KEPULAUAN RIAU J A M B I SUMATERA SELATAN KEP. BANGKA BELITUNG BENGKULU LAMPUNG 74.772 68.603 82.736 342.602 21.254 87.097 51.088 7.583 6.582 104.869 55.434 84.161 86.815 405.456 11.856 107.140 59.787 6.513 8.453 113.518 - - - - - - - - - - - - - - - - - - - - - 2.426 - 12.205 - - - - - 23 - 3.206 - 21.624 - - - - - - 74.772 71.029 82.736 354.807 21.254 87.097 51.088 7.583 6.582 104.892 55.434 87.367 86.815 427.080 11.856 107.140 59.787 6.513 8.453 113.518 WILAYAH SUMATERA 847.185 939.133 - - 14.654 24.830 861.839 963.963 11. 12. 13. 14. 15. 16. DKI. JAKARTA JAWA BARAT BANTEN JAWA TENGAH D.I. YOGYAKARTA JAWA TIMUR - 128.614 73.885 164.427 34.210 188.146 - 105.497 52.529 187.637 45.921 266.206 - - 50 555 - 1.101 - - 26 975 - 1.286 - 1.064 - 302 - 1.689 - 265 - 413 - 1.783 - 129.678 73.936 165.284 34.210 190.936 - 105.762 52.555 189.025 45.921 269.275 WILAYAH JAWA 589.282 657.790 1.707 2.287 3.055 2.461 594.043 662.538 17. 18. 19. B A L INUSA TENGGARA BARAT NUSA TENGGARA TIMUR
59.954 52.731 92.132 64.204 56.484 66.676 - - - - - - 108 - 259 125 - 174 60.062 52.731 92.391 64.330 56.484 66.850
WILAYAH NUSA TENGGARA & BALI 204.817 187.365 - - 367 299 205.184 187.664
20. 21. 22. 23. KALIMANTAN BARAT KALIMANTAN TENGAH KALIMANTAN SELATAN KALIMANTAN TIMUR 74.791 26.039 33.889 22.039 77.456 28.075 29.929 13.712 - - - - - - - - - - 514 - - - 306 - 74.791 26.039 34.403 22.039 77.456 28.075 30.235 13.712 WILAYAH KALIMANTAN 156.758 149.172 - - 514 306 157.272 149.478 24. 25. 26. 27. 28. 29. SULAWESI UTARA GORONTALO SULAWESI TENGAH SULAWESI SELATAN SULAWESI BARAT SULAWESI TENGGARA 218.709 45.448 158.048 78.759 39.048 46.593 277.025 64.003 189.572 79.993 45.285 42.699 413 - - - - - 641 - - - - - 6.573 2.141 398 597 - - 4.835 2.959 290 152 - - 225.694 47.589 158.446 79.356 39.048 46.593 282.500 66.962 189.862 80.145 45.285 42.699 WILAYAH SULAWESI 586.605 698.577 413 641 9.709 8.235 596.726 707.453 30. 31. 32. 33. M A L U K U MALUKU UTARA PAPUA PAPUA BARAT 83.917 165.696 17.758 17.939 95.992 251.391 15.604 17.501 - - - - - - - - - - - - - - - - 83.917 165.696 17.758 17.939 95.992 251.391 15.604 17.501
WILAYAH MALUKU & PAPUA 285.310 380.489 - - - - 285.310 380.489 I N D O N E S I A 2.669.957 3.012.526 2.120 2.927 28.299 36.132 2.700.375 3.051.585
DIREKTORAT JENDERAL PERKEBUNAN
Directorate General of Estate Crops
Keterangan/Note :
1. Angka Tetap/Fixed
Tabel 8.
Luas Tanaman Menghasilkan dan Produksi Kelapa Menurut Provinsi dan Status
Pengusahaan Tahun 2014*)
Table
Mature Area and Coconut Production by Province and Farming Category, 2014*)
No.
Provinsi/Province
Perkebunan Rakyat
Smallholder
Perkebunan Negara
Government
Perkebunan Swasta
Private
Jumlah/Total
TM/
Mature
(Ha)
Produksi
Production
(Ton)
TM/
Mature
(Ha)
Produksi
Production
(Ton)
TM/
Mature
(Ha)
Produksi
Production
(Ton)
TM/
Mature
(Ha)
Produksi
Production
(Ton)
1. 2. 3. 4. 5. 6. 7. 8. 9. 10. ACEH SUMATERA UTARA SUMATERA BARAT R I A U KEPULAUAN RIAU J A M B I SUMATERA SELATAN KEP. BANGKA BELITUNG BENGKULU LAMPUNG 74.972 68.809 82.324 340.067 21.108 87.412 51.652 7.644 6.639 103.839 55.706 84.413 87.353 396.803 11.782 114.350 61.583 6.602 8.378 109.163 - - - - - - - - - - - - - - - - - - - - - 2.392 - 12.043 - - - - - 23 - 3.178 - 21.444 - - - - - - 74.972 71.201 82.324 352.110 21.108 87.412 51.652 7.644 6.639 103.862 55.706 87.591 87.353 418.248 11.782 114.350 61.583 6.602 8.378 109.163 WILAYAH SUMATERA 844.467 936.133 - - 14.457 24.622 858.924 960.755 11. 12. 13. 14. 15. 16. DKI. JAKARTA JAWA BARAT BANTEN JAWA TENGAH D.I. YOGYAKARTA JAWA TIMUR - 127.720 72.321 164.368 34.349 190.796 - 104.744 51.331 187.576 44.956 268.512 - - 49 541 - 1.072 - - 26 964 - 1.272 - 1.049 - 298 - 1.664 - 263 - 409 - 1.767 - 128.769 72.370 165.206 34.349 193.532 - 105.008 51.357 188.949 44.956 271.551 WILAYAH JAWA 589.555 657.119 1.662 2.263 3.011 2.439 594.227 661.821 17. 18. 19. B A L INUSA TENGGARA BARAT NUSA TENGGARA TIMUR
59.984 52.212 91.590 64.225 56.032 66.403 - - - - - - 107 - 255 124 - 172 60.091 52.212 91.845 64.349 56.032 66.575
WILAYAH NUSA TENGGARA & BALI 203.786 186.660 - - 362 297 204.148 186.957
20. 21. 22. 23. 24. KALIMANTAN BARAT KALIMANTAN TENGAH KALIMANTAN SELATAN KALIMANTAN TIMUR KALIMANTAN UTARA 75.323 26.039 33.690 15.246 1.757 77.651 28.266 29.696 6.430 446 - - - - - - - - - - 507 - - - - 303 - - 75.323 26.039 34.197 15.246 1.757 77.651 28.266 29.999 6.430 446 WILAYAH KALIMANTAN 152.055 142.489 - - 507 303 152.562 142.793 25. 26. 27. 28. 29. 30. SULAWESI UTARA GORONTALO SULAWESI TENGAH SULAWESI SELATAN SULAWESI BARAT SULAWESI TENGGARA 219.534 47.564 156.346 78.145 38.769 46.281 277.795 64.447 184.990 79.112 44.763 42.410 402 - - - - - 634 - - - - - 6.476 2.109 392 588 - - 4.791 2.932 287 151 - - 226.412 49.673 156.738 78.733 38.769 46.281 283.219 67.380 185.277 79.262 44.763 42.410 WILAYAH SULAWESI 586.638 693.517 402 634 9.566 8.161 596.606 702.311 31. 32. 33. 34. M A L U K U MALUKU UTARA PAPUA PAPUA BARAT 85.015 161.563 17.438 17.662 95.458 248.758 15.228 17.228 - - - - - - - - - - - - - - - - 85.015 161.563 17.438 17.662 95.458 248.758 15.228 17.228
WILAYAH MALUKU & PAPUA 281.679 376.672 - - - - 281.679 376.672 I N D O N E S I A 2.658.179 2.992.591 2.064 2.896 27.902 35.822 2.688.145 3.031.310
DIREKTORAT JENDERAL PERKEBUNAN
Directorate General of Estate Crops
Keterangan/Note :
1. Angka Sementara/Preliminary*)
2. Wujud Produksi/Production : Kopra/Copra
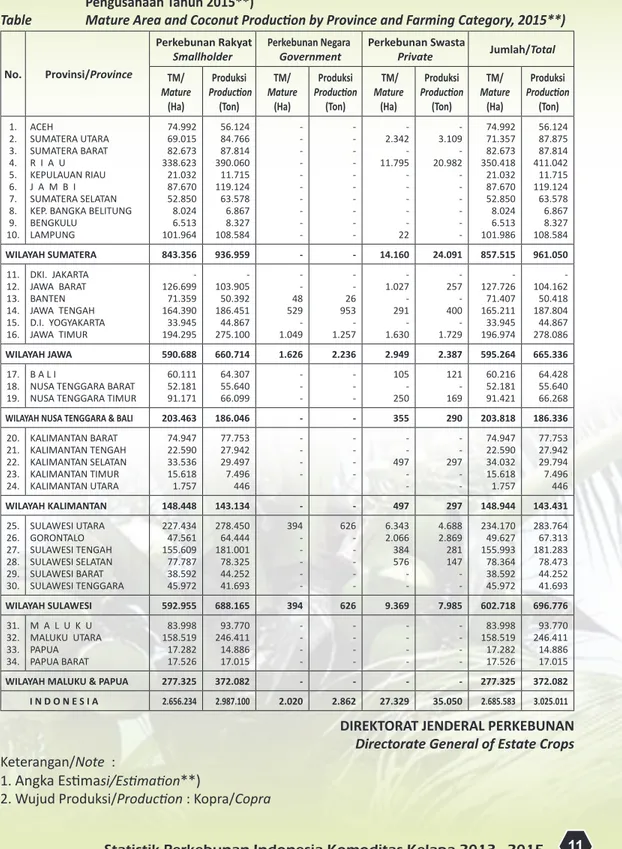
Tabel 9.
Luas Tanaman Menghasilkan dan Produksi Kelapa Menurut Provinsi dan Status
Pengusahaan Tahun 2015**)
Table
Mature Area and Coconut Production by Province and Farming Category, 2015**)
No.
Provinsi/Province
Perkebunan Rakyat
Smallholder
Perkebunan Negara
Government
Perkebunan Swasta
Private
Jumlah/Total
TM/
Mature
(Ha)
Produksi
Production
(Ton)
TM/
Mature
(Ha)
Produksi
Production
(Ton)
TM/
Mature
(Ha)
Produksi
Production
(Ton)
TM/
Mature
(Ha)
Produksi
Production
(Ton)
1. 2. 3. 4. 5. 6. 7. 8. 9. 10. ACEH SUMATERA UTARA SUMATERA BARAT R I A U KEPULAUAN RIAU J A M B I SUMATERA SELATAN KEP. BANGKA BELITUNG BENGKULU LAMPUNG 74.992 69.015 82.673 338.623 21.032 87.670 52.850 8.024 6.513 101.964 56.124 84.766 87.814 390.060 11.715 119.124 63.578 6.867 8.327 108.584 - - - - - - - - - - - - - - - - - - - - - 2.342 - 11.795 - - - - - 22 - 3.109 - 20.982 - - - - - - 74.992 71.357 82.673 350.418 21.032 87.670 52.850 8.024 6.513 101.986 56.124 87.875 87.814 411.042 11.715 119.124 63.578 6.867 8.327 108.584 WILAYAH SUMATERA 843.356 936.959 - - 14.160 24.091 857.515 961.050 11. 12. 13. 14. 15. 16. DKI. JAKARTA JAWA BARAT BANTEN JAWA TENGAH D.I. YOGYAKARTA JAWA TIMUR - 126.699 71.359 164.390 33.945 194.295 - 103.905 50.392 186.451 44.867 275.100 - - 48 529 - 1.049 - - 26 953 - 1.257 - 1.027 - 291 - 1.630 - 257 - 400 - 1.729 - 127.726 71.407 165.211 33.945 196.974 - 104.162 50.418 187.804 44.867 278.086 WILAYAH JAWA 590.688 660.714 1.626 2.236 2.949 2.387 595.264 665.336 17. 18. 19. B A L INUSA TENGGARA BARAT NUSA TENGGARA TIMUR
60.111 52.181 91.171 64.307 55.640 66.099 - - - - - - 105 - 250 121 - 169 60.216 52.181 91.421 64.428 55.640 66.268
WILAYAH NUSA TENGGARA & BALI 203.463 186.046 - - 355 290 203.818 186.336
20. 21. 22. 23. 24. KALIMANTAN BARAT KALIMANTAN TENGAH KALIMANTAN SELATAN KALIMANTAN TIMUR KALIMANTAN UTARA 74.947 22.590 33.536 15.618 1.757 77.753 27.942 29.497 7.496 446 - - - - - - - - - - 497 - - - - 297 - - 74.947 22.590 34.032 15.618 1.757 77.753 27.942 29.794 7.496 446 WILAYAH KALIMANTAN 148.448 143.134 - - 497 297 148.944 143.431 25. 26. 27. 28. 29. 30. SULAWESI UTARA GORONTALO SULAWESI TENGAH SULAWESI SELATAN SULAWESI BARAT SULAWESI TENGGARA 227.434 47.561 155.609 77.787 38.592 45.972 278.450 64.444 181.001 78.325 44.252 41.693 394 - - - - - 626 - - - - - 6.343 2.066 384 576 - - 4.688 2.869 281 147 - - 234.170 49.627 155.993 78.364 38.592 45.972 283.764 67.313 181.283 78.473 44.252 41.693 WILAYAH SULAWESI 592.955 688.165 394 626 9.369 7.985 602.718 696.776 31. 32. 33. 34. M A L U K U MALUKU UTARA PAPUA PAPUA BARAT 83.998 158.519 17.282 17.526 93.770 246.411 14.886 17.015 - - - - - - - - - - - - - - - - 83.998 158.519 17.282 17.526 93.770 246.411 14.886 17.015
WILAYAH MALUKU & PAPUA 277.325 372.082 - - - - 277.325 372.082 I N D O N E S I A 2.656.234 2.987.100 2.020 2.862 27.329 35.050 2.685.583 3.025.011
DIREKTORAT JENDERAL PERKEBUNAN
Directorate General of Estate Crops
Keterangan/Note :
1. Angka Estimasi/Estimation**)
Tabel 10.
Luas Areal dan Produksi Kelapa Perkebunan Rakyat, Besar Negara, Besar Swasta
Nasional dan Besar Swasta Asing (PR+PBN+PBS+PBSA) Menurut Provinsi dan
Keadaan Tanaman Tahun 2013
Table
Area and Coconut Production of Smallholder, Government, National Private
and Foreign Private Estate by Province and Tree Crop Classification, 2013
No.
Provinsi/Province
Luas Areal/Area (Ha)
Produksi
Production
(Ton)
Produktivitas/
Productivity
(Kg/Ha)
Jumlah
Petani/
Farmers
(KK)
Jumlah
Penyerapan
Tenaga Kerja
(TK)
TBM/
Immature
Mature
TM/
Damaged
TTM/TR/
Jumlah/
Total
1. 2. 3. 4. 5. 6. 7. 8. 9. 10. ACEH SUMATERA UTARA SUMATERA BARAT R I A U KEPULAUAN RIAU J A M B I SUMATERA SELATAN KEP. BANGKA BELITUNG BENGKULU LAMPUNG 15.536 7.302 7.670 46.351 3.901 12.545 5.477 2.322 2.578 14.032 74.772 71.029 82.736 354.807 21.254 87.097 51.088 7.583 6.582 104.892 13.033 8.078 1.033 119.102 9.639 18.818 8.743 943 485 6.514 103.341 86.409 91.438 520.260 34.794 118.460 65.308 10.848 9.645 125.438 55.434 87.367 86.815 427.080 11.856 107.140 59.787 6.513 8.453 113.518 741 1.230 1.049 1.204 558 1.230 1.170 859 1.284 1.082 149.141 134.000 231.611 205.948 24.286 97.440 161.875 11.416 54.371 179.164 - 1.024 - 6.125 - - - - - 12 WILAYAH SUMATERA 117.714 861.839 186.388 1.165.941 963.963 1.118 1.249.252 7.162 11. 12. 13. 14. 15. 16. DKI. JAKARTA JAWA BARAT BANTEN JAWA TENGAH D.I. YOGYAKARTA JAWA TIMUR - 21.616 12.829 53.585 7.380 65.439 - 129.678 73.936 165.284 34.210 190.936 - 30.553 5.998 16.228 - 38.988 - 181.847 92.762 235.097 41.590 295.363 - 105.762 52.555 189.025 45.921 269.275 - 816 711 1.144 1.342 1.410 - 838.281 389.448 1.135.358 179.452 1.438.954 - 1.471 23 804 - 1.702 WILAYAH JAWA 160.850 594.043 91.767 846.660 662.538 1.115 3.981.493 4.000 17. 18. 19. B A L I
NUSA TENGGARA BARAT NUSA TENGGARA TIMUR
5.011 7.894 41.555 60.062 52.731 92.391 915 3.229 18.772 65.988 63.853 152.718 64.330 56.484 66.850 1.071 1.071 724 200.778 95.253 248.581 87 - 167
WILAYAH NUSA TENGGARA & BALI 54.460 205.184 22.916 282.560 187.664 915 544.613 254
20. 21. 22. 23. KALIMANTAN BARAT KALIMANTAN TENGAH KALIMANTAN SELATAN KALIMANTAN TIMUR 12.937 6.387 5.618 3.433 74.791 26.039 34.403 22.039 19.427 285 1.671 1.180 107.155 32.710 41.692 26.652 77.456 28.075 30.235 13.712 1.036 1.078 879 622 78.713 39.584 105.953 27.051 - - 51 - WILAYAH KALIMANTAN 28.375 157.272 22.563 208.209 149.478 950 251.301 51 24. 25. 26. 27. 28. 29. SULAWESI UTARA GORONTALO SULAWESI TENGAH SULAWESI SELATAN SULAWESI BARAT SULAWESI TENGGARA 36.804 15.796 23.237 6.936 4.288 7.280 225.694 47.589 158.446 79.356 39.048 46.593 16.101 7.352 33.850 24.107 6.374 3.562 278.600 70.737 215.533 110.399 49.710 57.435 282.500 66.962 189.862 80.145 45.285 42.699 1.252 1.407 1.198 1.010 1.160 916 198.224 53.201 109.021 199.761 46.100 91.349 9.193 1.241 215 543 - - WILAYAH SULAWESI 94.340 596.726 91.346 782.413 707.453 1.186 697.656 11.192 30. 31. 32. 33. M A L U K U MALUKU UTARA PAPUA PAPUA BARAT 16.328 42.679 4.254 1.708 83.917 165.696 17.758 17.939 10.007 5.745 1.658 1.006 110.252 214.120 23.670 20.652 95.992 251.391 15.604 17.501 1.144 1.517 879 976 82.619 111.873 29.863 13.018 - - - -
WILAYAH MALUKU & PAPUA 64.969 285.310 18.416 368.695 380.489 1.334 237.373 - I N D O N E S I A 520.707 2.700.375 433.395 3.654.478 3.051.585 1.130 6.961.688 22.659