Tree Crop Estate Statistics Of Indonesia
STATISTIK PERKEBUNAN INDONESIA
Direktorat Jenderal Perkebunan
Directorate General of Estate Crops
Jakarta, Desember 2015
Jakarta, December 2015
T e a
2014 - 2016
2014 - 2016
T E H
T E H
STATISTIK PERKEBUNAN INDONESIA 2014-2016
TREE CROP ESTATE STATISTICS OF INDONESIA 2014-2016
Naskah/Manuscript
Direktorat Jenderal Perkebunan,
Directorate General of Estate Crops
Kementerian Pertanian
Ministry of Agriculture
Penasehat/Advisor:
Ir. Irmijati Rachmi Nurbahar, M.Sc.
Penyunting/Senior Editors:
Ir. Muh. Edi Subiyantoro, MM
Yanuar Arianto, STP, MM
Staf Penyunting/Editorial Staffs:
Widya Khonik Zuraina, S.Si
Eko Pudjianto, S.Kom
Asep Udin, S.Kom
Neny Kurniawati, S.Si
Susilo Novianto Damarjati, A.Md.
Diterbitkan oleh/Published by
Direktorat Jenderal Perkebunan
Directorate General of Estate Crops
Jl. Harsono RM No. 3 Gedung C
Pasar Minggu - Jakarta 12550
Kotak Pos 1060/Jkt,10010
Tlp. : 021 - 7815380 - 4
Fax. : 021 - 715486 - 7815586
Jakarta, Desember 2015
Jakarta, December 2015
Kata
Pengantar
K
omoditas perkebunan merupakan andalan bagi pendapatan
nasional dan devisa negara Indonesia, yang dapat dilihat dari nilai
ekspor komoditas perkebunan, pada Tahun 2014 total ekspor
perkebunan mencapai US$ 28,234 milyar atau setara dengan Rp. 367,040
triliun (asumsi 1 US$ = Rp. 13.000,00). Kontribusi sub sektor perkebunan
terhadap perekonomian nasional semakin meningkat dan diharapkan
dapat memperkokoh pembangunan perkebunan secara menyeluruh. Agar
informasi perkebunan dapat tersebar secara luas, setiap tahun diterbitkan
Buku Statistik Perkebunan Indonesia yang menyajikan data secara handal,
sahih, objektif, mutakhir dan konsisten.
S
tatistik Perkebunan Indonesia Tahun 2014-2016 menyajikan data luas areal, produksi,
produktivitas baik secara nasional maupun provinsi menurut status pengusahaannya
yaitu Perkebunan Rakyat, Perkebunan Besar Negara dan Perkebunan Besar Swasta.
Penyajian data juga dilengkapi dengan data ekspor dan impor untuk masing-masing komoditas
yang mencakup negara tujuan/asal, volume dan nilai, harga di dalam dan luar negeri serta untuk
beberapa komoditas tertentu disajikan data keseimbangan dunia.
D
ata yang disajikan merupakan hasil sinkronisasi dan validasi data statistik perkebunan
2014-2016 yang dilaksanakan secara berjenjang dari tingkat kabupaten sampai tingkat
nasional dengan mengacu pada Pedoman Pelaksanaan Pengelolaan Data Komoditas
Perkebunan yang diterbitkan Direktorat Jenderal Perkebunan. Data tersebut meliputi angka
tetap (ATAP) Tahun 2014, angka sementara (ASEM) Tahun 2015 dan angka estimasi (AESTI)
Tahun 2016. Data yang disajikan bersumber dari data primer yang dikumpulkan dari dinas yang
membidangi perkebunan di provinsi dan data sekunder yang dikutip dari data yang diterbitkan
oleh Badan Pusat Statistik (BPS), Kementerian Perindustrian, Kementerian Perdagangan, Bank
Indonesia, dan publikasi yang diterbitkan oleh asosiasi-asosiasi perkebunan baik dalam maupun
luar negeri.
B
uku ini dapat diterbitkan, atas dukungan dan kerjasama yang baik dari berbagai pihak.
Untuk itu, pada kesempatan ini, kami mengucapkan terima kasih atas dukungan dan
kerjasama tersebut. Kami menyadari bahwa buku yang diterbitkan ini masih jauh dari
sempurna. Untuk itu, kritik dan saran yang sifatnya membangun sangat diharapkan sebagai
bahan masukan dalam perbaikan penerbitan di masa datang.
S
emoga apa yang disajikan dalam buku ini dapat digunakan oleh berbagai kalangan dan
para pengguna data serta dapat dijadikan acuan dalam pengambilan kebijakan.
Jakarta, Desember 2015
DIREKTUR JENDERAL PERKEBUNAN
Ir. Gamal Nasir, MS
Preface
T
he estate crop commodities is the mainstay of national income
and Indonesia’s foreign exchange wich can be seen from export
value of the estate crop commodities. In 2014, total export of the
estate crops was US $ 28.234 billion or equivalent to Rp. 367.040 trillion
(assumed 1 US $ = Rp. 13,000.00). The contribution of estate crops sub
sector to the national economy tends to increase from year to year and
expected to strengthen overall national development. Furthermore,
to spread estate crops information widely, The Estate Crop Statistics of
Indonesia is published every year that presented reliable, valid, objective,
up to date and consistent data.
T
he Estate Crop Statistics of Indonesia 2014-2016 presents area, production and
productivity data by province and district level of smallhoder, government and private
estates. It is completed by volume, value of both export and import data, price data for
domestic and world market and also world balance data for some commodities.
D
ata presented are the result of synchronization and validation of the estate crop
statistical data 2014-2016 which are held hierarchical from the district to the national
level by using guidelines of data management of estate crop commodities. In this edition,
data of the 2014 are presented as fixed data, data of the 2015 are the preliminary data and data
of the 2016 are the estimation. The primary data were collected from the Estate Crops Province
Level and the secondary data were collected from related instution such as Board of Central
Statistics, Ministry of Industry, Ministry of Trade, Central Bank of Indonesia, the publication of
Estate Commodity Associations and others.
I
t would have been impossible to compile this book without substantional support and
contribution from many instutions. At this opportunity, we would like to thank all for their
support and cooperation. We realize that the publication still needs further improvement.
We would greatly appreciate comments and suggestions for future improvement.
H
opefully this publication will have high values for users and references for policy
makers.
Jakarta, December 2015
DIRECTOR GENERAL OF ESTATE CROPS
Ir. Gamal Nasir, MS
Kata Pengantar
Preface
...
iii
Daftar Isi
Contents
...
v
Daftar Gambar
List of Figures...
vi
Daftar Tabel
List of Tables ...
vii
Daftar
Isi
Daftar
Gambar
List of Figures
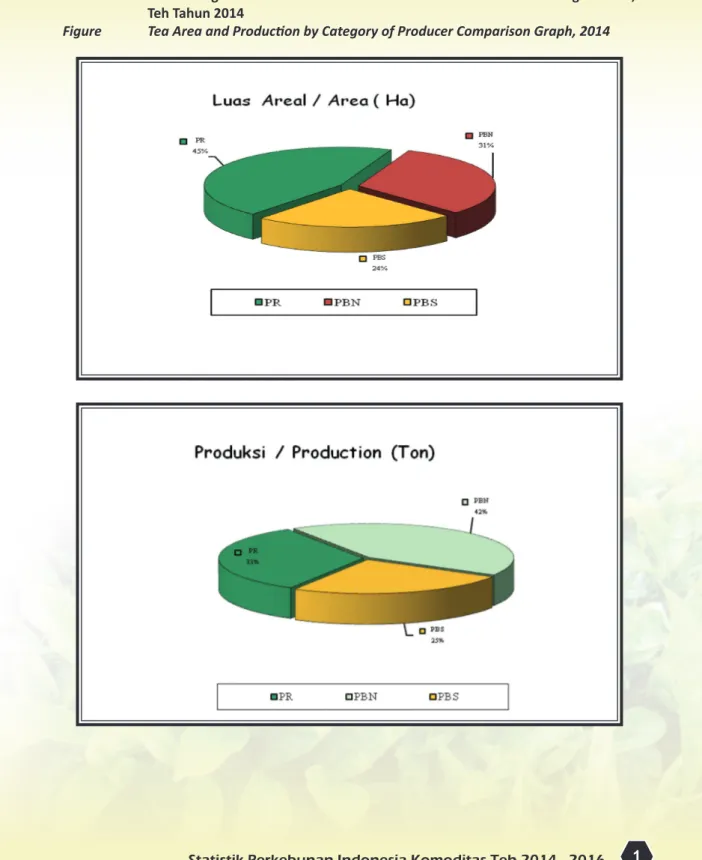
Gambar 1. Perbandingan Luas Areal dan Produksi Perkebunan Menurut
Status Pengusahaan, Teh Tahun 2014
Figure
Tea Area and Production by Category of Producer Comparison
Graph, 2014 ...
1
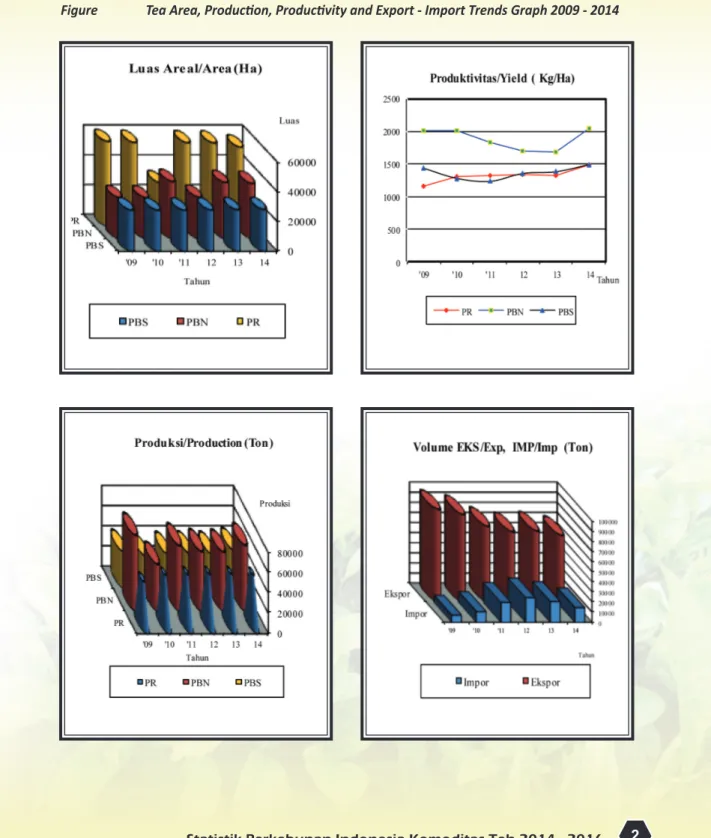
Gambar 2. Perkembangan Luas Areal, Produksi, Produktivitas dan
Ekspor - Impor, Teh Tahun 2009 - 2014
Figure
Tea Area, Production, Productivity and Export - Import Trends
Tabel 1.
Luas Areal dan Produksi Teh Menurut Status Pengusahaan
Tahun 1967 - 2016**)
Table
Area and Tea Production by Farming Category, 1967 - 2016**) ...
3
Tabel 2.
Volume dan Nilai Ekspor - Impor Teh Tahun 1970 -2014
Table
Export - Import Volume and Value of Tea, 1970 - 2014 ...
4
Tabel 3.
Luas Areal dan Produksi Teh Menurut Provinsi dan Status
Pengusahaan Tahun 2014
Table
Area and Tea Production by Province and Farming Category, 2014 ...
5
Tabel 4.
Luas Areal dan Produksi Teh Menurut Provinsi dan Statu
Pengusahaan Tahun 2015*)
Table
Area and Tea Production by Province and Farming Category, 2015*) ..
6
Tabel 5.
Luas Areal dan Produksi Teh Menurut Provinsi dan Status
Pengusahaan Tahun 2016**)
Table
Area and Tea Production by Province and Farming Category, 2016**)
7
Tabel 6.
Luas Tanaman Menghasilkan dan Produksi Teh Menurut Provinsi dan
Status Pengusahaan Tahun 2014
Table
Mature Area and Tea Production by Province and Farming
Category, 2014 ...
8
Tabel 7.
Luas Tanaman Menghasilkan dan Produksi Teh Menurut Provinsi dan
Status Pengusahaan Tahun 2015*)
Table
Mature Area and Tea Production by Province and Farming
Category, 2015*) ...
9
Tabel 8.
Luas Tanaman Menghasilkan dan Produksi Teh Menurut Provinsi dan
Status Pengusahaan Tahun 2016**)
Table
Mature Area and Tea Production by Province and Farming
Category, 2016**) ...
10
Tabel 9.
Luas Areal dan Produksi Teh Perkebunan Rakyat, Besar Negara dan
Besar Swasta (PR+PBN+PBS) Menurut Provinsi dan Keadaan
Tanaman Tahun 2014
Table
Area and Tea Production of Smallholder, Government and Private
Estate by Province and Tree Crop Classification, 2014 ...
11
Daftar
Tabel
Tabel 10.
Luas Areal Dan Produksi Teh Perkebunan Rakyat, Besar Negara dan
Besar Swasta (PR+PBN+PBS) Menurut Provinsi dan Keadaan
Tanaman Tahun 2015*)
Table
Area and Tea Production of Smallholder, Government and Private
Estate by Province and Tree Crop Classification, 2015*) ...
12
Tabel 11.
Luas Areal dan Produksi Teh Perkebunan Rakyat, Besar Negara dan
Besar Swasta (PR+PBN+PBS) Menurut Provinsi dan Keadaan
Tanaman Tahun 2016**)
Table
Area and Tea Production of Smallholder, Government and Private
Estate by Province and Tree Crop Classification, 2016**) ...
13
Tabel 12.
Luas Areal dan Produksi Teh Perkebunan Rakyat Menurut
Provinsi dan Keadaan Tanaman Tahun 2014
Table
Area and Tea Production of Smallholder by Province and Tree Crop
Classification, 2014 ...
14
Tabel 13.
Luas Areal dan Produksi Teh Perkebunan Rakyat Menurut
Kabupaten dan Keadaan Tanaman Tahun 2014
Table
Area and Tea Production of Smallholder by District and Tree Crop
Classification, 2014 ...
15
Tabel 14.
Luas Areal dan Produksi Teh Perkebunan Rakyat Menurut
Provinsi dan Keadaan Tanaman Tahun 2014 *)
Table
Area and Tea Production of Smallholder by Province and Tree Crop
Classification, 2015*) ...
17
Tabel 15.
Luas Areal dan Produksi Teh Perkebunan Rakyat Menurut
Provinsi dan Keadaan Tanaman Tahun 2016**)
Table
Area and Tea Production of Smallholder by Province and Tree Crop
Classification, 2015 **) ...
18
Tabel 16.
Luas Areal dan Produksi Teh Perkebunan Besar Negara Menurut
Provinsi dan Keadaan Tanaman Tahun 2014
Table
Area and Tea Production of Government Estate by Province and
Tree Crop Classification, 2014 ...
19
Tabel 17.
Luas Areal dan Produksi Teh Perkebunan Besar Negara Menurut
Kabupaten dan Keadaan Tanaman Tahun 2014
Table
Area and Tea Production of Government Estate by District and
Tree Crop Classification, 2014 ...
20
Tabel 18.
Luas Areal dan Produksi Teh Perkebunan Besar Negara Menurut
Provinsi dan Keadaan Tanaman Tahun 2014 *)
Table
Area and Tea Production of Government Estate by Provnce and
Tabel 19.
Luas Areal dan Produksi Teh Perkebunan Besar Negara Menurut
Provinsi dan Keadaan Tanaman Tahun 2016**)
Table
Area and Tea Production of Government Estate by Province and
Tree Crop Classification, 2016**) ...
23
Tabel 20.
Luas Areal dan Produksi Teh Perkebunan Besar Swasta Menurut
Provinsi dan Keadaan Tanaman Tahun 2014
Table
Area and Tea Production of Private Estate by Province and
Tree Crop Classification, 2014 ...
24
Table 21.
Luas Areal dan Produksi Teh Perkebunan Besar Swasta Menurut
Kabupaten dan Keadaan Tanaman Tahun 2014
Table
Area and Tea Production of Private Estate by District and
Tree Crop Classification, 2014 ...
25
Table 22.
Luas Areal dan Produksi Teh Perkebunan Besar Swasta Menurut
Provinsi dan Keadaan Tanaman Tahun 2014 *)
Table
Area and Tea Production of Private Estate by Province and
Tree Crop Classification, 2015*) ...
27
Table 23.
Luas Areal dan Produksi Teh Perkebunan Besar Swasta Menurut
Provinsi dan Keadaan Tanaman Tahun 2015 **)
Table
Area and Tea Production of Private Estate by Province and
Tree Crop Classification, 2016**) ...
28
Tabel 24.
Volume dan Nilai Ekspor - Impor Teh Menurut Negara Tujuan dan
Asal Tahun 2014
Table
Export - Import Volume and Value of Tea by Destination and
Origin Country, 2014 ...
29
Tabel 25.
Perkembangan Harga Rata-Rata Bulanan Teh Di Pasar Domestik
Tahun 2014 - 2015
Table
Monthly Average Price Trend of Tea In Domestic Market, 2014 - 2015
33
Tabel 26. Perkembangan Harga Rata-rata Tahunan Komoditi Teh di Pasar Dunia
Tahun 1985 - 2014
Gambar 1. Perbandingan Luas Areal dan Produksi Perkebunan Menurut Status Pengusahaan,
Teh Tahun 2014
Gambar 2. Perkembangan Luas Areal, Produksi, Produktivitas dan Ekspor - Impor, Teh
Tahun 2009 - 2014
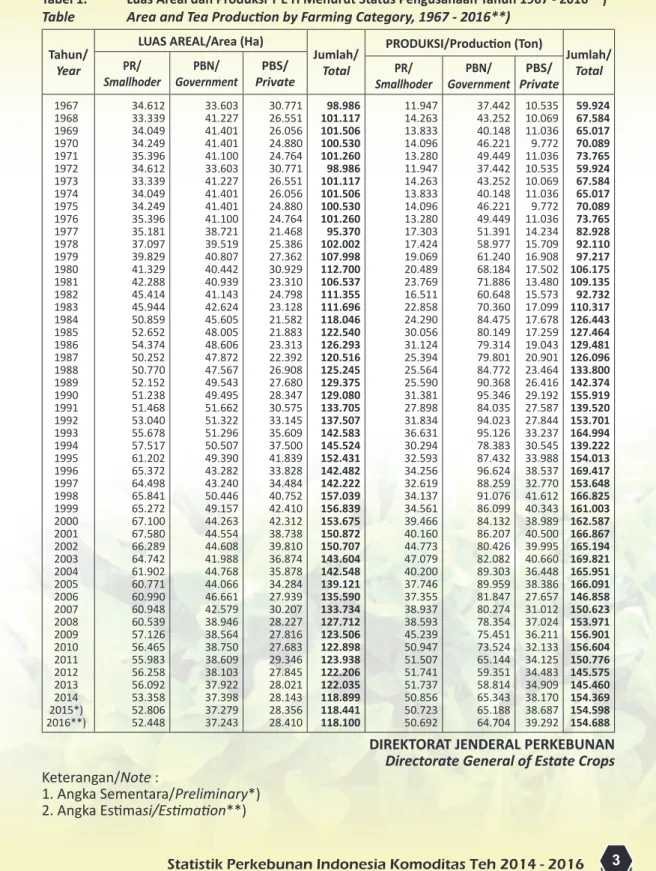
Tabel 1.
Luas Areal dan Produksi T E H Menurut Status Pengusahaan Tahun 1967 - 2016**)
Table
Area and Tea Production by Farming Category, 1967 - 2016**)
Tahun/
Year
LUAS AREAL/Area (Ha)
Jumlah/
Total
PRODUKSI/Production (Ton)
Jumlah/
Total
PR/
Smallhoder
Government
PBN/
Private
PBS/
Smallhoder
PR/
Government
PBN/
Private
PBS/
1967
1968
1969
1970
1971
1972
1973
1974
1975
1976
1977
1978
1979
1980
1981
1982
1983
1984
1985
1986
1987
1988
1989
1990
1991
1992
1993
1994
1995
1996
1997
1998
1999
2000
2001
2002
2003
2004
2005
2006
2007
2008
2009
2010
2011
2012
2013
2014
2015*)
2016**)
34.612
33.339
34.049
34.249
35.396
34.612
33.339
34.049
34.249
35.396
35.181
37.097
39.829
41.329
42.288
45.414
45.944
50.859
52.652
54.374
50.252
50.770
52.152
51.238
51.468
53.040
55.678
57.517
61.202
65.372
64.498
65.841
65.272
67.100
67.580
66.289
64.742
61.902
60.771
60.990
60.948
60.539
57.126
56.465
55.983
56.258
56.092
53.358
52.806
52.448
33.603
41.227
41.401
41.401
41.100
33.603
41.227
41.401
41.401
41.100
38.721
39.519
40.807
40.442
40.939
41.143
42.624
45.605
48.005
48.606
47.872
47.567
49.543
49.495
51.662
51.322
51.296
50.507
49.390
43.282
43.240
50.446
49.157
44.263
44.554
44.608
41.988
44.768
44.066
46.661
42.579
38.946
38.564
38.750
38.609
38.103
37.922
37.398
37.279
37.243
30.771
26.551
26.056
24.880
24.764
30.771
26.551
26.056
24.880
24.764
21.468
25.386
27.362
30.929
23.310
24.798
23.128
21.582
21.883
23.313
22.392
26.908
27.680
28.347
30.575
33.145
35.609
37.500
41.839
33.828
34.484
40.752
42.410
42.312
38.738
39.810
36.874
35.878
34.284
27.939
30.207
28.227
27.816
27.683
29.346
27.845
28.021
28.143
28.356
28.410
98.986
101.117
101.506
100.530
101.260
98.986
101.117
101.506
100.530
101.260
95.370
102.002
107.998
112.700
106.537
111.355
111.696
118.046
122.540
126.293
120.516
125.245
129.375
129.080
133.705
137.507
142.583
145.524
152.431
142.482
142.222
157.039
156.839
153.675
150.872
150.707
143.604
142.548
139.121
135.590
133.734
127.712
123.506
122.898
123.938
122.206
122.035
118.899
118.441
118.100
11.947
14.263
13.833
14.096
13.280
11.947
14.263
13.833
14.096
13.280
17.303
17.424
19.069
20.489
23.769
16.511
22.858
24.290
30.056
31.124
25.394
25.564
25.590
31.381
27.898
31.834
36.631
30.294
32.593
34.256
32.619
34.137
34.561
39.466
40.160
44.773
47.079
40.200
37.746
37.355
38.937
38.593
45.239
50.947
51.507
51.741
51.737
50.856
50.723
50.692
37.442
43.252
40.148
46.221
49.449
37.442
43.252
40.148
46.221
49.449
51.391
58.977
61.240
68.184
71.886
60.648
70.360
84.475
80.149
79.314
79.801
84.772
90.368
95.346
84.035
94.023
95.126
78.383
87.432
96.624
88.259
91.076
86.099
84.132
86.207
80.426
82.082
89.303
89.959
81.847
80.274
78.354
75.451
73.524
65.144
59.351
58.814
65.343
65.188
64.704
10.535
10.069
11.036
9.772
11.036
10.535
10.069
11.036
9.772
11.036
14.234
15.709
16.908
17.502
13.480
15.573
17.099
17.678
17.259
19.043
20.901
23.464
26.416
29.192
27.587
27.844
33.237
30.545
33.988
38.537
32.770
41.612
40.343
38.989
40.500
39.995
40.660
36.448
38.386
27.657
31.012
37.024
36.211
32.133
34.125
34.483
34.909
38.170
38.687
39.292
59.924
67.584
65.017
70.089
73.765
59.924
67.584
65.017
70.089
73.765
82.928
92.110
97.217
106.175
109.135
92.732
110.317
126.443
127.464
129.481
126.096
133.800
142.374
155.919
139.520
153.701
164.994
139.222
154.013
169.417
153.648
166.825
161.003
162.587
166.867
165.194
169.821
165.951
166.091
146.858
150.623
153.971
156.901
156.604
150.776
145.575
145.460
154.369
154.598
154.688
DIREKTORAT JENDERAL PERKEBUNAN
Directorate General of Estate Crops
Keterangan/Note :
1. Angka Sementara/Preliminary*)
2. Angka Estimasi/Estimation**)
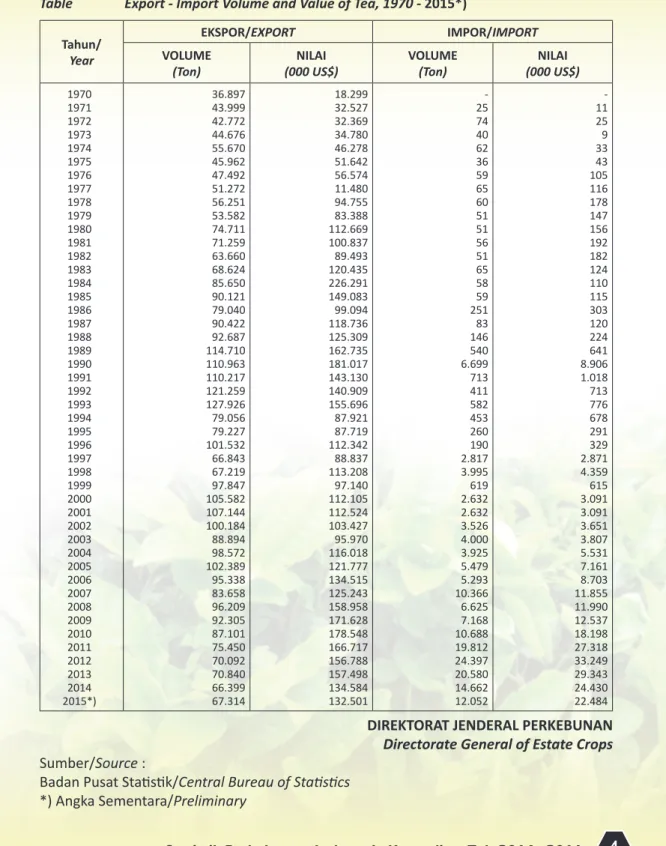
Tabel 2.
Volume dan Nilai Ekspor - Impor Teh Tahun 1970 - 2015*)
Table
Export - Import Volume and Value of Tea, 1970 - 2015*)
Tahun/
Year
EKSPOR/EXPORT
IMPOR/IMPORT
VOLUME
(Ton)
(000 US$)
NILAI
VOLUME
(Ton)
(000 US$)
NILAI
1970
1971
1972
1973
1974
1975
1976
1977
1978
1979
1980
1981
1982
1983
1984
1985
1986
1987
1988
1989
1990
1991
1992
1993
1994
1995
1996
1997
1998
1999
2000
2001
2002
2003
2004
2005
2006
2007
2008
2009
2010
2011
2012
2013
2014
2015*)
36.897
43.999
42.772
44.676
55.670
45.962
47.492
51.272
56.251
53.582
74.711
71.259
63.660
68.624
85.650
90.121
79.040
90.422
92.687
114.710
110.963
110.217
121.259
127.926
79.056
79.227
101.532
66.843
67.219
97.847
105.582
107.144
100.184
88.894
98.572
102.389
95.338
83.658
96.209
92.305
87.101
75.450
70.092
70.840
66.399
67.314
18.299
32.527
32.369
34.780
46.278
51.642
56.574
11.480
94.755
83.388
112.669
100.837
89.493
120.435
226.291
149.083
99.094
118.736
125.309
162.735
181.017
143.130
140.909
155.696
87.921
87.719
112.342
88.837
113.208
97.140
112.105
112.524
103.427
95.970
116.018
121.777
134.515
125.243
158.958
171.628
178.548
166.717
156.788
157.498
134.584
132.501
-
25
74
40
62
36
59
65
60
51
51
56
51
65
58
59
251
83
146
540
6.699
713
411
582
453
260
190
2.817
3.995
619
2.632
2.632
3.526
4.000
3.925
5.479
5.293
10.366
6.625
7.168
10.688
19.812
24.397
20.580
14.662
12.052
-
11
25
9
33
43
105
116
178
147
156
192
182
124
110
115
303
120
224
641
8.906
1.018
713
776
678
291
329
2.871
4.359
615
3.091
3.091
3.651
3.807
5.531
7.161
8.703
11.855
11.990
12.537
18.198
27.318
33.249
29.343
24.430
22.484
DIREKTORAT JENDERAL PERKEBUNAN
Directorate General of Estate Crops
Sumber/Source :
Badan Pusat Statistik/Central Bureau of Statistics
*) Angka Sementara/Preliminary
Tabel 3.
Luas Areal dan Produksi Teh Menurut Provinsi dan Status Pengusahaan Tahun 2014
Table
Area and Tea Production by Province and Farming Category, 2014
No. Provinsi/Province
Perkebunan Rakyat
Smallholder
Perkebunan Negara
Government
Perkebunan Swasta
Private
Jumlah/Total
Luas/
Area
(Ha)
Produksi
Production
(Ton)
Luas/
Area
(Ha)
Produksi
Production
(Ton)
Luas/
Area
(Ha)
Produksi
Production
(Ton)
Luas/
Area
(Ha)
Produksi
Production
(Ton)
1. 2. 3. 4. 5. 6. 7. 8. 9. 10. ACEH SUMATERA UTARA SUMATERA BARAT R I A U KEPULAUAN RIAU J A M B I SUMATERA SELATAN KEP. BANGKA BELITUNG BENGKULU LAMPUNG - - 2.275 - - - - - - - - - 2.895 - - - - - - - - 5.550 604 - - 2.324 1.438 - - - - 12.647 1.225 - - 5.265 3.023 - - - - 274 2.052 - - - - - 1.223 - - 163 3.879 - - - - - 1.316 - - 5.824 4.931 - - 2.324 1.438 - 1.223 - - 12.810 7.999 - - 5.265 3.023 - 1.316 - WILAYAH SUMATERA 2.275 2.895 9.916 22.160 3.549 5.358 15.740 30.413 11. 12. 13. 14. 15. 16. DKI. JAKARTA JAWA BARAT BANTEN JAWA TENGAH D.I. YOGYAKARTA JAWA TIMUR - 45.850 45 4.997 136 56 - 40.403 23 7.400 112 23 - 23.213 - 1.376 - 2.893 - 37.140 - 466 - 5.576 - 20.914 27 2.465 - 1.059 - 27.736 19 3.639 - 1.280 - 89.977 72 8.838 136 4.008 - 105.279 42 11.505 112 6.879 WILAYAH JAWA 51.083 47.961 27.482 43.183 24.465 32.674 103.030 123.818 17. 18. 19. B A L INUSA TENGGARA BARAT NUSA TENGGARA TIMUR
- - - - - - - - - - - - - - - - - - - - - - - -
WILAYAH NUSA TENGGARA & BALI - - - - - - - -
20. 21. 22. 23. 24. KALIMANTAN BARAT KALIMANTAN TENGAH KALIMANTAN SELATAN KALIMANTAN TIMUR KALIMANTAN UTARA - - - -- - - - -- - - - -- - - - - - - - -- - - - -- - - - - - - - -- WILAYAH KALIMANTAN - - - - - - - - 25. 26. 27. 28. 29. 30. SULAWESI UTARA GORONTALO SULAWESI TENGAH SULAWESI SELATAN SULAWESI BARAT SULAWESI TENGGARA - - - - - - - - - - - - - - - - - - - - - - - - - - - 129 - - - - - 138 - - - - - 129 - - - - - 138 - - WILAYAH SULAWESI - - - - 129 138 129 138 31. 32. 33. 34. M A L U K U MALUKU UTARA PAPUA PAPUA BARAT - - - - - - - - - - - - - - - - - - - - - - - - - - - - -
-WILAYAH MALUKU & PAPUA - - - -
I N D O N E S I A 53.358 50.856 37.398 65.343 28.143 38.170 118.899 154.369
DIREKTORAT JENDERAL PERKEBUNAN
Directorate General of Estate Crops
Keterangan/Note :
1. Angka Tetap/Fixed
Tabel 4.
Luas Areal dan Produksi Teh Menurut Provinsi dan Status Pengusahaan Tahun 2015*)
Table
Area and Tea Production by Province and Farming Category, 2015*)
No. Provinsi/Province
Perkebunan Rakyat
Smallholder
Perkebunan Negara
Government
Perkebunan Swasta
Private
Jumlah/Total
Luas/
Area
(Ha)
Produksi
Production
(Ton)
Luas/
Area
(Ha)
Produksi
Production
(Ton)
Luas/
Area
(Ha)
Produksi
Production
(Ton)
Luas/
Area
(Ha)
Produksi
Production
(Ton)
1. 2. 3. 4. 5. 6. 7. 8. 9. 10. ACEH SUMATERA UTARA SUMATERA BARAT R I A U KEPULAUAN RIAU J A M B I SUMATERA SELATAN KEP. BANGKA BELITUNG BENGKULU LAMPUNG - - 2.289 - - - - - - - - - 2.898 - - - - - - - - 5.563 604 - - 2.326 1.438 - - - - 12.979 1.234 - - 5.268 3.028 - - - - 263 2.052 - - - - - 1.182 - - 142 3.881 - - - - - 1.331 - - 5.826 4.945 - - 2.326 1.438 - 1.182 - - 13.121 8.013 - - 5.268 3.028 - 1.331 - WILAYAH SUMATERA 2.289 2.898 9.931 22.509 3.497 5.354 15.717 30.761 11. 12. 13. 14. 15. 16. DKI. JAKARTA JAWA BARAT BANTEN JAWA TENGAH D.I. YOGYAKARTA JAWA TIMUR - 45.156 45 5.130 130 56 - 40.260 23 7.409 110 23 - 23.214 - 1.254 - 2.880 - 36.634 - 469 - 5.576 - 21.168 27 2.476 - 1.059 - 28.247 20 3.646 - 1.280 - 89.538 72 8.860 130 3.995 - 105.141 43 11.524 110 6.879 WILAYAH JAWA 50.517 47.825 27.348 42.679 24.730 33.193 102.595 123.697 17. 18. 19. B A L INUSA TENGGARA BARAT NUSA TENGGARA TIMUR
- - - - - - - - - - - - - - - - - - - - - - - -
WILAYAH NUSA TENGGARA & BALI - - - - - - - -
20. 21. 22. 23. 24. KALIMANTAN BARAT KALIMANTAN TENGAH KALIMANTAN SELATAN KALIMANTAN TIMUR KALIMANTAN UTARA - - - -- - - - -- - - - -- - - - - - - - -- - - - -- - - - - - - - -- WILAYAH KALIMANTAN - - - - - - - - 25. 26. 27. 28. 29. 30. SULAWESI UTARA GORONTALO SULAWESI TENGAH SULAWESI SELATAN SULAWESI BARAT SULAWESI TENGGARA - - - - - - - - - - - - - - - - - - - - - - - - - - - 129 - - - - - 140 - - - - - 129 - - - - - 140 - - WILAYAH SULAWESI - - - - 129 140 129 140 31. 32. 33. 34. M A L U K U MALUKU UTARA PAPUA PAPUA BARAT - - - - - - - - - - - - - - - - - - - - - - - - - - - - -
-WILAYAH MALUKU & PAPUA - - - -
I N D O N E S I A 52.806 50.723 37.279 65.188 28.356 38.687 118.441 154.598
DIREKTORAT JENDERAL PERKEBUNAN
Directorate General of Estate Crops
Keterangan/Note :
1. Angka Sementara/Preliminary*)
Tabel 5.
Luas Areal dan Produksi Teh Menurut Provinsi dan Status Pengusahaan Tahun 2016**)
Table
Area and Tea Production by Province and Farming Category, 2016**)
No. Provinsi/Province
Perkebunan Rakyat
Smallholder
Perkebunan Negara
Government
Perkebunan Swasta
Private
Jumlah/Total
Luas/
Area
(Ha)
Produksi
Production
(Ton)
Luas/
Area
(Ha)
Produksi
Production
(Ton)
Luas/
Area
(Ha)
Produksi
Production
(Ton)
Luas/
Area
(Ha)
Produksi
Production
(Ton)
1. 2. 3. 4. 5. 6. 7. 8. 9. 10. ACEH SUMATERA UTARA SUMATERA BARAT R I A U KEPULAUAN RIAU J A M B I SUMATERA SELATAN KEP. BANGKA BELITUNG BENGKULU LAMPUNG - - 2.290 - - - - - - - - - 2.956 - - - - - - - - 5.574 608 - - 2.331 1.437 - - - - 13.117 1.300 - - 5.272 3.032 - - - - 256 2.053 - - - - - 1.173 - - 139 3.894 - - - - - 1.276 - - 5.830 4.951 - - 2.331 1.437 - 1.173 - - 13.256 8.150 - - 5.272 3.032 - 1.276 - WILAYAH SUMATERA 2.290 2.956 9.950 22.721 3.482 5.309 15.722 30.986 11. 12. 13. 14. 15. 16. DKI. JAKARTA JAWA BARAT BANTEN JAWA TENGAH D.I. YOGYAKARTA JAWA TIMUR - 44.673 45 5.259 122 59 - 40.164 23 7.418 107 24 - 23.182 - 1.230 - 2.880 - 35.652 - 476 - 5.855 - 21.222 27 2.491 - 1.059 - 28.827 21 3.649 - 1.344 - 89.077 72 8.980 122 3.998 - 104.643 44 11.543 107 7.223 WILAYAH JAWA 50.158 47.736 27.292 41.983 24.799 33.841 102.249 123.560 17. 18. 19. B A L INUSA TENGGARA BARAT NUSA TENGGARA TIMUR
- - - - - - - - - - - - - - - - - - - - - - - -
WILAYAH NUSA TENGGARA & BALI - - - - - - - -
20. 21. 22. 23. 24. KALIMANTAN BARAT KALIMANTAN TENGAH KALIMANTAN SELATAN KALIMANTAN TIMUR KALIMANTAN UTARA - - - - - - - -- - - - -- - - - -- - - - - - - - -- - - - - - - - -- WILAYAH KALIMANTAN - - - - - - - - 25. 26. 27. 28. 29. 30. SULAWESI UTARA GORONTALO SULAWESI TENGAH SULAWESI SELATAN SULAWESI BARAT SULAWESI TENGGARA - - - - - - - - - - - - - - - - - - - - - - - - - - - 129 - - - - - 142 - - - - - 129 - - - - - 142 - - WILAYAH SULAWESI - - - - 129 142 129 142 31. 32. 33. 34. M A L U K U MALUKU UTARA PAPUA PAPUA BARAT - - - - - - - - - - - - - - - - - - - - - - - - - - - - -
-WILAYAH MALUKU & PAPUA - - - -
I N D O N E S I A 52.448 50.692 37.243 64.704 28.410 39.292 118.100 154.688
DIREKTORAT JENDERAL PERKEBUNAN
Directorate General of Estate Crops
Keterangan/Note :
1. Angka Estimasi/Estimation**)
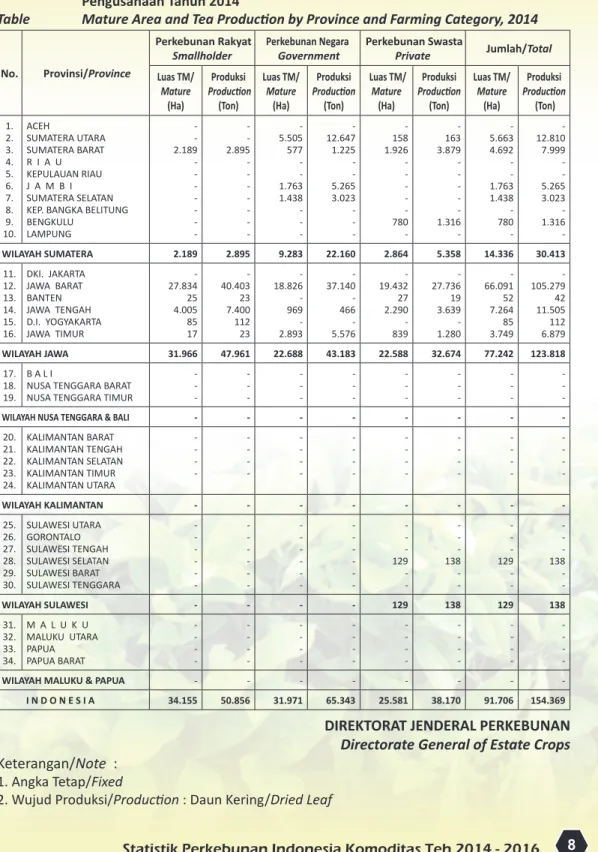
Tabel 6.
Luas Tanaman Menghasilkan dan Produksi Teh Menurut Provinsi dan Status
Pengusahaan Tahun 2014
Table
Mature Area and Tea Production by Province and Farming Category, 2014
No.
Provinsi/Province
Perkebunan Rakyat
Smallholder
Perkebunan Negara
Government
Perkebunan Swasta
Private
Jumlah/Total
Luas TM/
Mature
(Ha)
Produksi
Production
(Ton)
Luas TM/
Mature
(Ha)
Produksi
Production
(Ton)
Luas TM/
Mature
(Ha)
Produksi
Production
(Ton)
Luas TM/
Mature
(Ha)
Produksi
Production
(Ton)
1. 2. 3. 4. 5. 6. 7. 8. 9. 10. ACEH SUMATERA UTARA SUMATERA BARAT R I A U KEPULAUAN RIAU J A M B I SUMATERA SELATAN KEP. BANGKA BELITUNG BENGKULU LAMPUNG - - 2.189 - - - - - - - - - 2.895 - - - - - - - - 5.505 577 - - 1.763 1.438 - - - - 12.647 1.225 - - 5.265 3.023 - - - - 158 1.926 - - - - - 780 - - 163 3.879 - - - - - 1.316 - - 5.663 4.692 - - 1.763 1.438 - 780 - - 12.810 7.999 - - 5.265 3.023 - 1.316 - WILAYAH SUMATERA 2.189 2.895 9.283 22.160 2.864 5.358 14.336 30.413 11. 12. 13. 14. 15. 16. DKI. JAKARTA JAWA BARAT BANTEN JAWA TENGAH D.I. YOGYAKARTA JAWA TIMUR - 27.834 25 4.005 85 17 - 40.403 23 7.400 112 23 - 18.826 - 969 - 2.893 - 37.140 - 466 - 5.576 - 19.432 27 2.290 - 839 - 27.736 19 3.639 - 1.280 - 66.091 52 7.264 85 3.749 - 105.279 42 11.505 112 6.879 WILAYAH JAWA 31.966 47.961 22.688 43.183 22.588 32.674 77.242 123.818 17. 18. 19. B A L INUSA TENGGARA BARAT NUSA TENGGARA TIMUR
- - - - - - - - - - - - - - - - - - - - - - - -
WILAYAH NUSA TENGGARA & BALI - - - - - - - -
20. 21. 22. 23. 24. KALIMANTAN BARAT KALIMANTAN TENGAH KALIMANTAN SELATAN KALIMANTAN TIMUR KALIMANTAN UTARA - - - - - - - - - - - - - - - - - - - - - - - - - - - - - - WILAYAH KALIMANTAN - - - - - - - - 25. 26. 27. 28. 29. 30. SULAWESI UTARA GORONTALO SULAWESI TENGAH SULAWESI SELATAN SULAWESI BARAT SULAWESI TENGGARA - - - - - - - - - - - - - - - - - - - - - - - - - - - 129 - - - - - 138 - - - - - 129 - - - - - 138 - - WILAYAH SULAWESI - - - - 129 138 129 138 31. 32. 33. 34. M A L U K U MALUKU UTARA PAPUA PAPUA BARAT - - - - - - - - - - - - - - - - - - - - - - - - - - - - -
-WILAYAH MALUKU & PAPUA - - - -
I N D O N E S I A 34.155 50.856 31.971 65.343 25.581 38.170 91.706 154.369
DIREKTORAT JENDERAL PERKEBUNAN
Directorate General of Estate Crops
Keterangan/Note :
1. Angka Tetap/Fixed
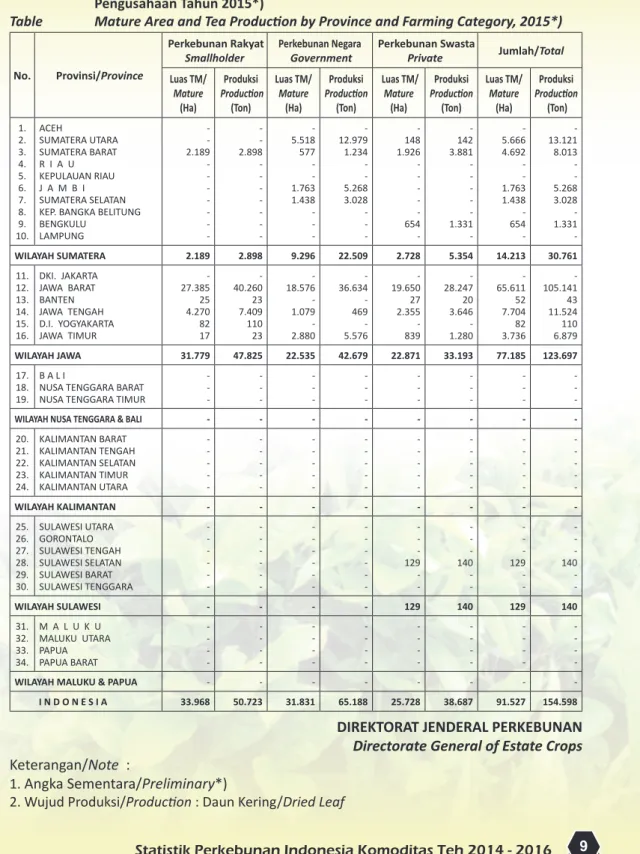
Tabel 7.
Luas Tanaman Menghasilkan dan Produksi Teh Menurut Provinsi dan Status
Pengusahaan Tahun 2015*)
Table
Mature Area and Tea Production by Province and Farming Category, 2015*)
No.
Provinsi/Province
Perkebunan Rakyat
Smallholder
Perkebunan Negara
Government
Perkebunan Swasta
Private
Jumlah/Total
Luas TM/
Mature
(Ha)
Produksi
Production
(Ton)
Luas TM/
Mature
(Ha)
Produksi
Production
(Ton)
Luas TM/
Mature
(Ha)
Produksi
Production
(Ton)
Luas TM/
Mature
(Ha)
Produksi
Production
(Ton)
1. 2. 3. 4. 5. 6. 7. 8. 9. 10. ACEH SUMATERA UTARA SUMATERA BARAT R I A U KEPULAUAN RIAU J A M B I SUMATERA SELATAN KEP. BANGKA BELITUNG BENGKULU LAMPUNG - - 2.189 - - - - - - -- - 2.898 - - - - - - - - 5.518 577 - - 1.763 1.438 - - - - 12.979 1.234 - - 5.268 3.028 - - -- 148 1.926 - - - - - 654 - - 142 3.881 - - - - - 1.331 - - 5.666 4.692 - - 1.763 1.438 - 654 -- 13.121 8.013 - - 5.268 3.028 - 1.331 - WILAYAH SUMATERA 2.189 2.898 9.296 22.509 2.728 5.354 14.213 30.761 11. 12. 13. 14. 15. 16. DKI. JAKARTA JAWA BARAT BANTEN JAWA TENGAH D.I. YOGYAKARTA JAWA TIMUR - 27.385 25 4.270 82 17 - 40.260 23 7.409 110 23 - 18.576 - 1.079 - 2.880 - 36.634 - 469 - 5.576 - 19.650 27 2.355 - 839 - 28.247 20 3.646 - 1.280 - 65.611 52 7.704 82 3.736 - 105.141 43 11.524 110 6.879 WILAYAH JAWA 31.779 47.825 22.535 42.679 22.871 33.193 77.185 123.697 17. 18. 19. B A L INUSA TENGGARA BARAT NUSA TENGGARA TIMUR
- - - - - - - - - - - - - - - - - - - - - - - -
WILAYAH NUSA TENGGARA & BALI - - - - - - - -
20. 21. 22. 23. 24. KALIMANTAN BARAT KALIMANTAN TENGAH KALIMANTAN SELATAN KALIMANTAN TIMUR KALIMANTAN UTARA - - - -- - - - -- - - - - - - - -- - - - -- - - - -- - - - - - - - -- WILAYAH KALIMANTAN - - - - - - - - 25. 26. 27. 28. 29. 30. SULAWESI UTARA GORONTALO SULAWESI TENGAH SULAWESI SELATAN SULAWESI BARAT SULAWESI TENGGARA - - - - - - - - - - - - - - - - - - - - - - - - - - - 129 - - - - - 140 - - - - - 129 - - - - - 140 - - WILAYAH SULAWESI - - - - 129 140 129 140 31. 32. 33. 34. M A L U K U MALUKU UTARA PAPUA PAPUA BARAT - - - - - - - - - - - - - - - - - - - - - - - - - - - - -
-WILAYAH MALUKU & PAPUA - - - -
I N D O N E S I A 33.968 50.723 31.831 65.188 25.728 38.687 91.527 154.598
DIREKTORAT JENDERAL PERKEBUNAN
Directorate General of Estate Crops
Keterangan/Note :
1. Angka Sementara/Preliminary*)
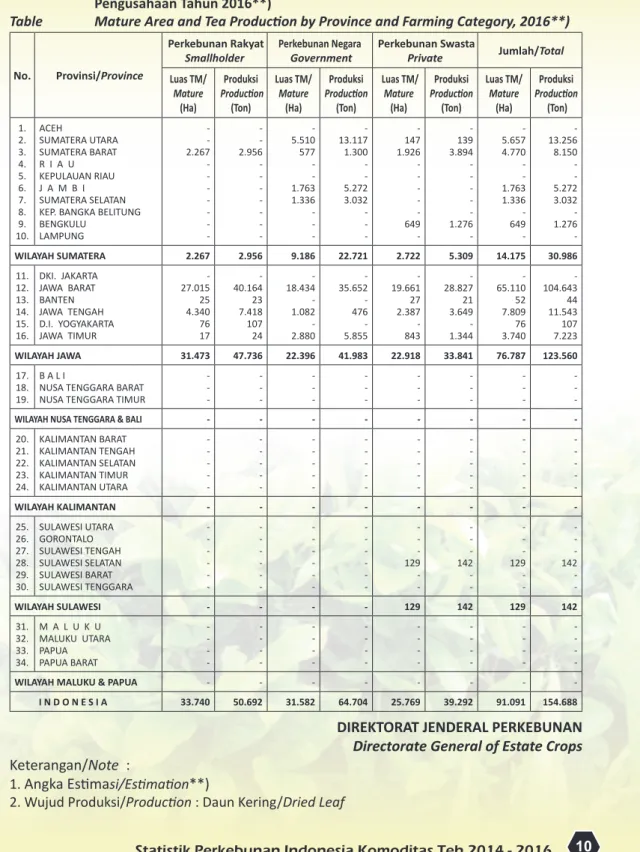
Tabel 8.
Luas Tanaman Menghasilkan dan Produksi Teh Menurut Provinsi dan Status
Pengusahaan Tahun 2016**)
Table
Mature Area and Tea Production by Province and Farming Category, 2016**)
No.
Provinsi/Province
Perkebunan Rakyat
Smallholder
Perkebunan Negara
Government
Perkebunan Swasta
Private
Jumlah/Total
Luas TM/
Mature
(Ha)
Produksi
Production
(Ton)
Luas TM/
Mature
(Ha)
Produksi
Production
(Ton)
Luas TM/
Mature
(Ha)
Produksi
Production
(Ton)
Luas TM/
Mature
(Ha)
Produksi
Production
(Ton)
1. 2. 3. 4. 5. 6. 7. 8. 9. 10. ACEH SUMATERA UTARA SUMATERA BARAT R I A U KEPULAUAN RIAU J A M B I SUMATERA SELATAN KEP. BANGKA BELITUNG BENGKULU LAMPUNG - - 2.267 - - - - - - - - - 2.956 - - - - - - - - 5.510 577 - - 1.763 1.336 - - - - 13.117 1.300 - - 5.272 3.032 - - -- 147 1.926 - - - - - 649 - - 139 3.894 - - - - - 1.276 - - 5.657 4.770 - - 1.763 1.336 - 649 - - 13.256 8.150 - - 5.272 3.032 - 1.276 - WILAYAH SUMATERA 2.267 2.956 9.186 22.721 2.722 5.309 14.175 30.986 11. 12. 13. 14. 15. 16. DKI. JAKARTA JAWA BARAT BANTEN JAWA TENGAH D.I. YOGYAKARTA JAWA TIMUR - 27.015 25 4.340 76 17 - 40.164 23 7.418 107 24 - 18.434 - 1.082 - 2.880 - 35.652 - 476 - 5.855 - 19.661 27 2.387 - 843 - 28.827 21 3.649 - 1.344 - 65.110 52 7.809 76 3.740 - 104.643 44 11.543 107 7.223 WILAYAH JAWA 31.473 47.736 22.396 41.983 22.918 33.841 76.787 123.560 17. 18. 19. B A L INUSA TENGGARA BARAT NUSA TENGGARA TIMUR
- - - - - - - - - - - - - - - - - - - - - - - -
WILAYAH NUSA TENGGARA & BALI - - - - - - - -
20. 21. 22. 23. 24. KALIMANTAN BARAT KALIMANTAN TENGAH KALIMANTAN SELATAN KALIMANTAN TIMUR KALIMANTAN UTARA - - - -- - - - -- - - - - - - - -- - - - -- - - - -- - - - - - - - -- WILAYAH KALIMANTAN - - - - - - - - 25. 26. 27. 28. 29. 30. SULAWESI UTARA GORONTALO SULAWESI TENGAH SULAWESI SELATAN SULAWESI BARAT SULAWESI TENGGARA - - - - - - - - - - - - - - - - - - - - - - - - - - - 129 - - - - - 142 - - - - - 129 - - - - - 142 - - WILAYAH SULAWESI - - - - 129 142 129 142 31. 32. 33. 34. M A L U K U MALUKU UTARA PAPUA PAPUA BARAT - - - - - - - - - - - - - - - - - - - - - - - - - - - - -
-WILAYAH MALUKU & PAPUA - - - -
I N D O N E S I A 33.740 50.692 31.582 64.704 25.769 39.292 91.091 154.688
DIREKTORAT JENDERAL PERKEBUNAN
Directorate General of Estate Crops
Keterangan/Note :
1. Angka Estimasi/Estimation**)
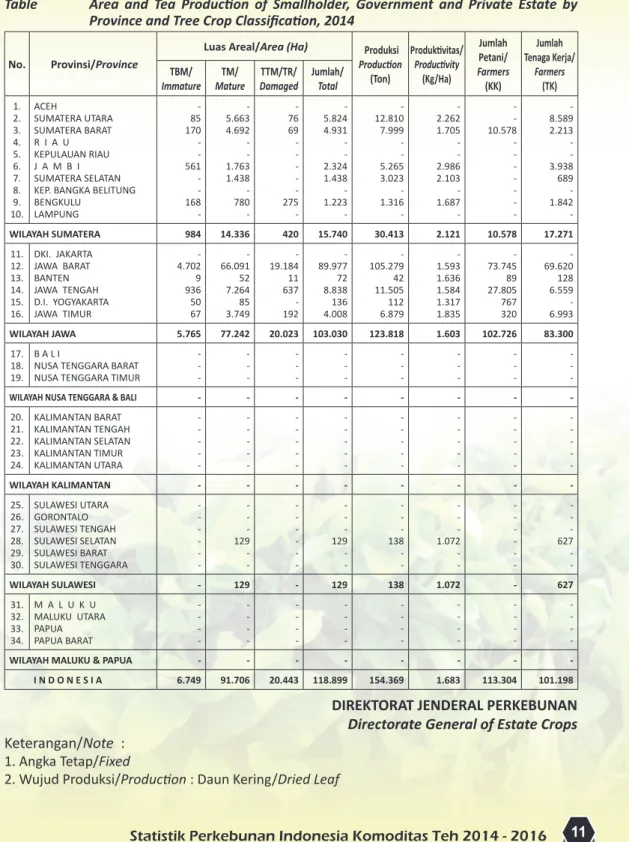
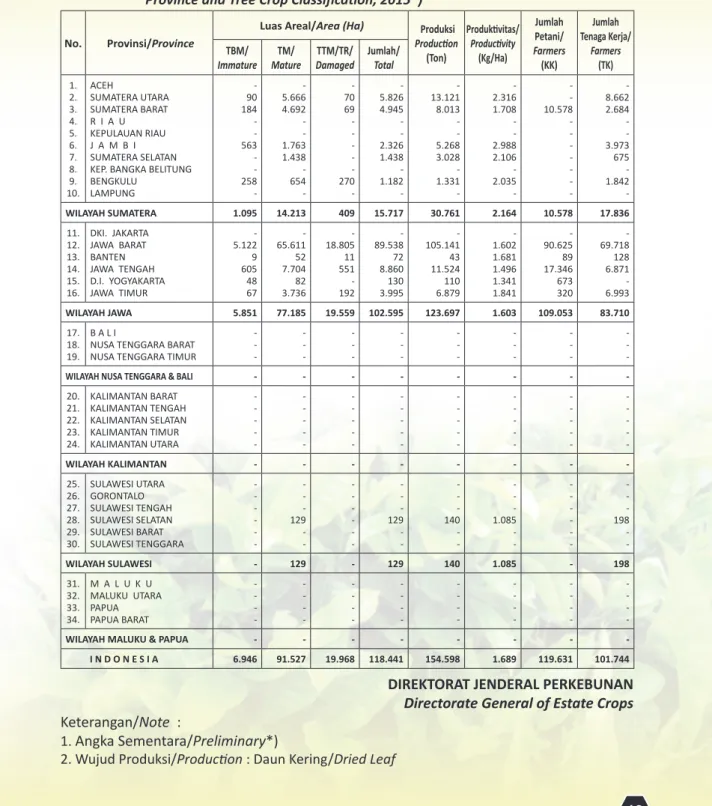
Tabel 9.
Luas Areal dan Produksi Teh Perkebunan Rakyat, Besar Negara dan Besar Swasta
(PR+PBN+PBS) Menurut Provinsi dan Keadaan Tanaman Tahun 2014
Table
Area and Tea Production of Smallholder, Government and Private Estate by
Province and Tree Crop Classification, 2014
No.
Provinsi/Province
Luas Areal/Area (Ha)
Produksi
Production
(Ton)
Produktivitas/
Productivity
(Kg/Ha)
Jumlah
Petani/
Farmers
(KK)
Jumlah
Tenaga Kerja/
Farmers
(TK)
TBM/
Immature
Mature
TM/
Damaged
TTM/TR/
Jumlah/
Total
1. 2. 3. 4. 5. 6. 7. 8. 9. 10. ACEH SUMATERA UTARA SUMATERA BARAT R I A U KEPULAUAN RIAU J A M B I SUMATERA SELATAN KEP. BANGKA BELITUNG BENGKULU LAMPUNG - 85 170 - - 561 - - 168 - - 5.663 4.692 - - 1.763 1.438 - 780 - - 76 69 - - - - - 275 - - 5.824 4.931 - - 2.324 1.438 - 1.223 - - 12.810 7.999 - - 5.265 3.023 - 1.316 - - 2.262 1.705 - - 2.986 2.103 - 1.687 - - - 10.578 - - - - - - - - 8.589 2.213 - - 3.938 689 - 1.842 - WILAYAH SUMATERA 984 14.336 420 15.740 30.413 2.121 10.578 17.271 11. 12. 13. 14. 15. 16. DKI. JAKARTA JAWA BARAT BANTEN JAWA TENGAH D.I. YOGYAKARTA JAWA TIMUR - 4.702 9 936 50 67 - 66.091 52 7.264 85 3.749 - 19.184 11 637 - 192 - 89.977 72 8.838 136 4.008 - 105.279 42 11.505 112 6.879 - 1.593 1.636 1.584 1.317 1.835 - 73.745 89 27.805 767 320 - 69.620 128 6.559 - 6.993 WILAYAH JAWA 5.765 77.242 20.023 103.030 123.818 1.603 102.726 83.300 17. 18. 19. B A L I
NUSA TENGGARA BARAT NUSA TENGGARA TIMUR
- - - - - - - - - - - - - - - - - - - - - - - -
WILAYAH NUSA TENGGARA & BALI - - - - - - - -
20. 21. 22. 23. 24. KALIMANTAN BARAT KALIMANTAN TENGAH KALIMANTAN SELATAN KALIMANTAN TIMUR KALIMANTAN UTARA - - - - - - -- - - - - - - -- - - - - - - -- - - - - - - -- WILAYAH KALIMANTAN - - - - - - - - 25. 26. 27. 28. 29. 30. SULAWESI UTARA GORONTALO SULAWESI TENGAH SULAWESI SELATAN SULAWESI BARAT SULAWESI TENGGARA - - - - - - - - - 129 - - - - - - - - - - - 129 - - - - - 138 - - - - - 1.072 - - - - - - - - - - - 627 - - WILAYAH SULAWESI - 129 - 129 138 1.072 - 627 31. 32. 33. 34. M A L U K U MALUKU UTARA PAPUA PAPUA BARAT - - - - - - - - - - - - - - - - - - - - - - - - - - - - - - - -
WILAYAH MALUKU & PAPUA - - - - - - - - I N D O N E S I A 6.749 91.706 20.443 118.899 154.369 1.683 113.304 101.198
DIREKTORAT JENDERAL PERKEBUNAN
Directorate General of Estate Crops
Keterangan/Note :
1. Angka Tetap/Fixed
Tabel 10.
Luas Areal Dan Produksi Teh Perkebunan Rakyat, Besar Negara dan Besar Swasta
(PR+PBN+PBS) Menurut Provinsi dan Keadaan Tanaman Tahun 2015*)
Table
Area and Tea Production of Smallholder, Government and Private Estate by
Province and Tree Crop Classification, 2015*)
No.
Provinsi/Province
Luas Areal/Area (Ha)
Produksi
Production
(Ton)
Produktivitas/
Productivity
(Kg/Ha)
Jumlah
Petani/
Farmers
(KK)
Jumlah
Tenaga Kerja/
Farmers
(TK)
TBM/
Immature
Mature
TM/
Damaged
TTM/TR/
Jumlah/
Total
1. 2. 3. 4. 5. 6. 7. 8. 9. 10. ACEH SUMATERA UTARA SUMATERA BARAT R I A U KEPULAUAN RIAU J A M B I SUMATERA SELATAN KEP. BANGKA BELITUNG BENGKULU LAMPUNG - 90 184 - - 563 - - 258 - - 5.666 4.692 - - 1.763 1.438 - 654 -- 70 69 - - - - - 270 - - 5.826 4.945 - - 2.326 1.438 - 1.182 - - 13.121 8.013 - - 5.268 3.028 - 1.331 - - 2.316 1.708 - - 2.988 2.106 - 2.035 - - - 10.578 - - - - - - - - 8.662 2.684 - - 3.973 675 - 1.842 - WILAYAH SUMATERA 1.095 14.213 409 15.717 30.761 2.164 10.578 17.836 11. 12. 13. 14. 15. 16. DKI. JAKARTA JAWA BARAT BANTEN JAWA TENGAH D.I. YOGYAKARTA JAWA TIMUR - 5.122 9 605 48 67 - 65.611 52 7.704 82 3.736 - 18.805 11 551 - 192 - 89.538 72 8.860 130 3.995 - 105.141 43 11.524 110 6.879 - 1.602 1.681 1.496 1.341 1.841 - 90.625 89 17.346 673 320 - 69.718 128 6.871 - 6.993 WILAYAH JAWA 5.851 77.185 19.559 102.595 123.697 1.603 109.053 83.710 17. 18. 19. B A L I
NUSA TENGGARA BARAT NUSA TENGGARA TIMUR
- - - - - - - - - - - - - - - - - - - - - - - -
WILAYAH NUSA TENGGARA & BALI - - - - - - - -
20. 21. 22. 23. 24. KALIMANTAN BARAT KALIMANTAN TENGAH KALIMANTAN SELATAN KALIMANTAN TIMUR KALIMANTAN UTARA - - - -- - - - - - - - -- - - - - - - - -- - - - - - - - -- - - - - -WILAYAH KALIMANTAN - - - - - - - - 25. 26. 27. 28. 29. 30. SULAWESI UTARA GORONTALO SULAWESI TENGAH SULAWESI SELATAN SULAWESI BARAT SULAWESI TENGGARA - - - - - - - - - 129 - - - - - - - - - - - 129 - - - - - 140 - - - - - 1.085 - - - - - - - - - - - 198 - - WILAYAH SULAWESI - 129 - 129 140 1.085 - 198 31. 32. 33. 34. M A L U K U MALUKU UTARA PAPUA PAPUA BARAT - - - - - - - - - - - - - - - - - - - - - - - - - - - - - - - -
WILAYAH MALUKU & PAPUA - - - - - - - - I N D O N E S I A 6.946 91.527 19.968 118.441 154.598 1.689 119.631 101.744
DIREKTORAT JENDERAL PERKEBUNAN
Directorate General of Estate Crops
Keterangan/Note :
1. Angka Sementara/Preliminary*)
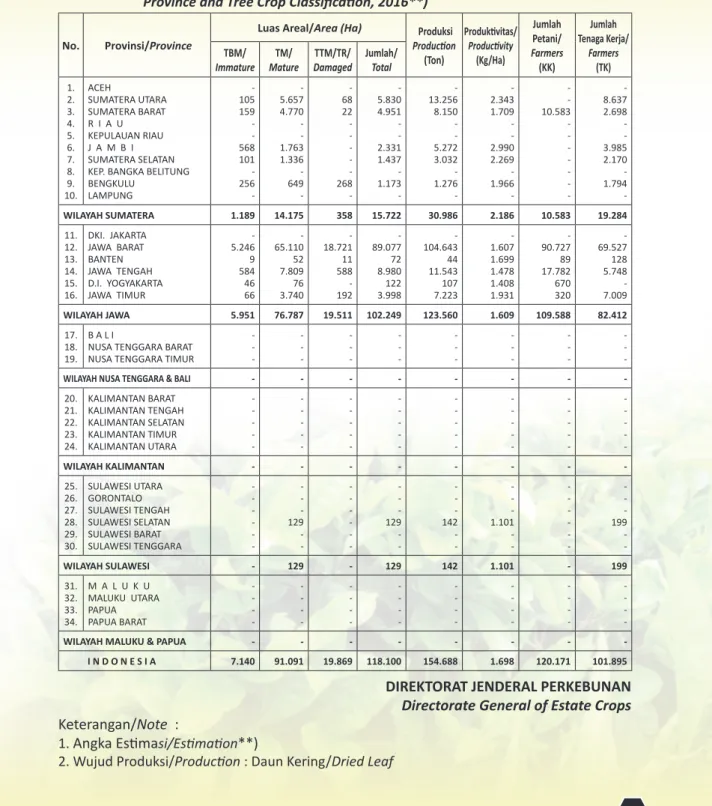
Tabel 11.
Luas Areal dan Produksi Teh Perkebunan Rakyat, Besar Negara dan Besar Swasta
(PR+PBN+PBS) Menurut Provinsi dan Keadaan Tanaman Tahun 2016**)
Table
Area and Tea Production of Smallholder, Government and Private Estate by
Province and Tree Crop Classification, 2016**)
No.
Provinsi/Province
Luas Areal/Area (Ha)
Produksi
Production
(Ton)
Produktivitas/
Productivity
(Kg/Ha)
Jumlah
Petani/
Farmers
(KK)
Jumlah
Tenaga Kerja/
Farmers
(TK)
TBM/
Immature
Mature
TM/
Damaged
TTM/TR/
Jumlah/
Total
1. 2. 3. 4. 5. 6. 7. 8. 9. 10. ACEH SUMATERA UTARA SUMATERA BARAT R I A U KEPULAUAN RIAU J A M B I SUMATERA SELATAN KEP. BANGKA BELITUNG BENGKULU LAMPUNG - 105 159 - - 568 101 - 256 - - 5.657 4.770 - - 1.763 1.336 - 649 - - 68 22 - - - - - 268 - - 5.830 4.951 - - 2.331 1.437 - 1.173 - - 13.256 8.150 - - 5.272 3.032 - 1.276 - - 2.343 1.709 - - 2.990 2.269 - 1.966 - - - 10.583 - - - - - - - - 8.637 2.698 - - 3.985 2.170 - 1.794 - WILAYAH SUMATERA 1.189 14.175 358 15.722 30.986 2.186 10.583 19.284 11. 12. 13. 14. 15. 16. DKI. JAKARTA JAWA BARAT BANTEN JAWA TENGAH D.I. YOGYAKARTA JAWA TIMUR - 5.246 9 584 46 66 - 65.110 52 7.809 76 3.740 - 18.721 11 588 - 192 - 89.077 72 8.980 122 3.998 - 104.643 44 11.543 107 7.223 - 1.607 1.699 1.478 1.408 1.931 - 90.727 89 17.782 670 320 - 69.527 128 5.748 - 7.009 WILAYAH JAWA 5.951 76.787 19.511 102.249 123.560 1.609 109.588 82.412 17. 18. 19. B A L I
NUSA TENGGARA BARAT NUSA TENGGARA TIMUR
- - - - - - - - - - - - - - - - - - - - - - - -
WILAYAH NUSA TENGGARA & BALI - - - - - - - -
20. 21. 22. 23. 24. KALIMANTAN BARAT KALIMANTAN TENGAH KALIMANTAN SELATAN KALIMANTAN TIMUR KALIMANTAN UTARA - - - - - - - -- - - - - - - - -- - - - -- - - - - -- - - - - - - -- WILAYAH KALIMANTAN - - - - - - - - 25. 26. 27. 28. 29. 30. SULAWESI UTARA GORONTALO SULAWESI TENGAH SULAWESI SELATAN SULAWESI BARAT SULAWESI TENGGARA - - - - - - - - - 129 - - - - - - - - - - - 129 - - - - - 142 - - - - - 1.101 - - - - - - - - - - - 199 - - WILAYAH SULAWESI - 129 - 129 142 1.101 - 199 31. 32. 33. 34. M A L U K U MALUKU UTARA PAPUA PAPUA BARAT - - - - - - - - - - - - - - - - - - - - - - - - - - - - - - - -
WILAYAH MALUKU & PAPUA - - - - - - - - I N D O N E S I A 7.140 91.091 19.869 118.100 154.688 1.698 120.171 101.895
DIREKTORAT JENDERAL PERKEBUNAN
Directorate General of Estate Crops
Keterangan/Note :
1. Angka Estimasi/Estimation**)
Tabel 12.
Luas Areal dan Produksi Teh Perkebunan Rakyat Menurut Provinsi dan Keadaan
Tanaman Tahun 2014
Table
Area and Tea Production of Smallholder by Province and Tree Crop Classification, 2014
No.
Provinsi/Province
Luas Areal/Area (Ha)
Produksi
Production
(Ton)
Produktivitas/
Productivity
(Kg/Ha)
Jumlah
Petani/
Farmers
(KK)
TBM/
Immature
Mature
TM/
Damaged
TTM/TR/
Jumlah/
Total
1. 2. 3. 4. 5. 6. 7. 8. 9. 10. ACEH SUMATERA UTARA SUMATERA BARAT R I A U KEPULAUAN RIAU J A M B I SUMATERA SELATAN KEP. BANGKA BELITUNG BENGKULU LAMPUNG - - 44 - - - - - - - - - 2.189 - - - - - - - - - 42 - - - - - - - - - 2.275 - - - - - - - - - 2.895 - - - - - - - - - 1.323 - - - - - - - - - 10.578 - - - - - - - WILAYAH SUMATERA 44 2.189 42 2.275 2.895 1.323 10.578 11. 12. 13. 14. 15. 16. DKI. JAKARTA JAWA BARAT BANTEN JAWA TENGAH D.I. YOGYAKARTA JAWA TIMUR - 2.229 9 355 50 - - 27.834 25 4.005 85 17 - 15.787 11 637 - 39 - 45.850 45 4.997 136 56 - 40.403 23 7.400 112 23 - 1.452 940 1.848 1.317 1.353 - 73.745 89 27.805 767 320 WILAYAH JAWA 2.643 31.966 16.474 51.083 47.961 1.500 102.726 17. 18. 19. B A L I
NUSA TENGGARA BARAT NUSA TENGGARA TIMUR
- - - - - - - - - - - - - - - - - - - - -
WILAYAH NUSA TENGGARA & BALI - - - - - - -
20. 21. 22. 23. 24. KALIMANTAN BARAT KALIMANTAN TENGAH KALIMANTAN SELATAN KALIMANTAN TIMUR KALIMANTAN UTARA - - - -- - - - -- - - - -- - - - -- - - - -- - - - -- - - - -- WILAYAH KALIMANTAN - - - - - - -25. 26. 27. 28. 29. 30. SULAWESI UTARA GORONTALO SULAWESI TENGAH SULAWESI SELATAN SULAWESI BARAT SULAWESI TENGGARA - - - - - - - - - - - - - - - - - - - - - - - - - - - - - - - - - - - - - - - - - - WILAYAH SULAWESI - - - - - - - 31. 32. 33. 34. M A L U K U MALUKU UTARA PAPUA PAPUA BARAT - - - - - - - - - - - - - - - - - - - - - - - - - - - -
WILAYAH MALUKU & PAPUA - - - - - - - I N D O N E S I A 2.687 34.155 16.516 53.358 50.856 1.489 113.304