POWER PLANT EMISSIONS INVENTORY IN BATAM
Dwi Kartikasari
Politeknik Negeri Batam
Jl. A. Yani, Kel. Teluk Tering, Kec. Batam Kota, Batam, 29461
Telp/Fax: 085668385622/(0778) 463620
Email: [email protected]
ABSTRACT
POWER PLANT EMISSIONS INVENTORY IN BATAM. This research is motivated by the rising electricity demands and a need to curb emissions from the electricity generation in Batam city, a city often called industrial city because of the large number of companies in the city. This study aims to provide an estimate of the emissions generated by all power plants which electricity produced is used for internal and external parties in the city of Batam. External parties for power plant companies can be households, as well as other companies inside and outside the industrial park. This study focuses on power plants because they are responsible for one fifth of total emissions of NOx,and a significant amount of other emissions in Batam. Primary data are obtained from field survey to all power plants in Batam. The emissions of NOx, CO, SOx, PM10, and HC are calculated using the 2013 EMEP/EEA methods and those of COx are estimated using the 2006 Intergovernmental Panel on Climate Change (IPCC) guidelines. Out of 116 companies surveyed as potential point sources, the author concluded that 24 power plants meet the criteria of companies that use the electricity generated for external user(s). After emissions inventory estimation, the author concludes the increasingly dominant coal power plant brings the highest environmental consequences. Thus the author argues that the emissions reduction actions should focus on this power plant.
Keyword: power plants, emissions, Batam
ABSTRAK
INVENTARISASI EMISI PADA PEMBANGKIT LISTRIK DI KOTA BATAM. Penelitian ini dilatarbelakangi oleh tingginya kebutuhan listrik yang dibarengi dengan kebutuhan untuk mengendalikan emisi akibat pembangkitan listrik tersebut di kota Batam, kota yang sering disebut kota industri karena banyaknya perusahaan di kota ini. Penelitian ini bertujuan memberikan estimasi emisi yang dihasilkan oleh seluruh pembangkit listrik yang listriknya digunakan untuk pihak internal dan pihak eksternal di kota Batam. Pihak eksternal perusahaan pembangkit listrik dapat berupa rumah tangga, maupun perusahan lainnya di dalam maupun di luar kawasan industri. Penelitian ini fokus pada pembangkit listrik karena pembangkit listrik bertanggung jawab terhadap seperlima dari total emisi NOx, dan sejumlah gas buang jenis lainnya. Gas buang yang dikalkulasi pada penelitian ini adalah NOx, CO, SOx, PM10, dan HC menggunakan metode estimasi emisi yang digariskan oleh EMEP/EEA pada tahun 2013, sedangkan gas buang COx diestimasi menggunakan metode yang diinstruksikan oleh IPCC pada tahun 2006. Dari 116 perusahaan yang disurvei sebagai sumber titik potensial, penulis menemukan 24 pembangkit listrik yang memenuhi kriteria sebagai perusahaan yang menghasilkan listrik untuk pihak eksternal. Setelah memperkirakan inventorisasi emisi, penulis menyimpulkan bahwa penggunaan batu bara yang kian dominan untuk pembangkit listrik membawa konsekuensi lingkungan yang terbesar. Sehingga penulis berpendapat bahwa upaya pengurangan emisi sebaiknya bertumpu pada pembangkit listrik yang berbahan bakar batu bara ini.
Kata kunci: pembangkit listrik, emisi, Batam
INTRODUCTION
progress and develop strategies towards emission reduction targets, and help scientists build emission trends over time and assess air quality through dispersion modeling.
Diverse methods for calculating the emissions are available, such as continuous monitoring to measure actual emissions like Rashid, M. Et all (1998) did in a field evaluation in mill boilers [1]; extrapolating the results from short-term source emissions tests like Yusoff, A. R. and Aziz, I. A. (2009) did when predicting boiler emission by using artificial neural networks model [2]; and combining published emission factors with known activity levels like Rashidi, M. and Jaswar (2014) did in predicting carbon dioxide emitted by marine transport [3]. The later method is used in this paper considering the limited data, time, staff and funding.
Given the above-average-for-decades rate of economic development in the free trade zone Batam and the degradation of air quality in the future which is likely resulted from this, it becomes necessary to use all of the scientific tools available for the management of the atmospheric environment. In the light of electricity demands rising, power plants generate energy not only for households but also for companies inside and outside of industrial zone . This paper focuses on power plants because they are responsible for more than one fifth of total NOx emissions and a significant amount of other emissions in Batam [4]. The energy sector is usually the most important sector in greenhouse gas emission inventory because it typically contributes over 90 percent of the CO2 emissions and 75 percent of the total greenhouse gas emissions in developed countries [4]. Unless emission reduction actions are taken, the power plant emissions will not decrease anytime soon since the demand rises and the energy industry expands as the latter supplies power to not only Batam, but also to neighboring Bintan island which would be delivered in 2015 and to Singapore in 2017.
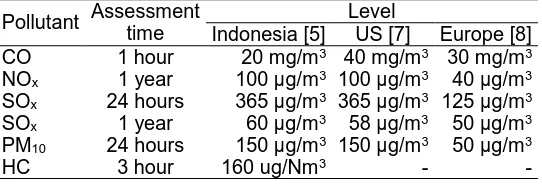
This article covers exclusively on substances that parties in Indonesia need to report under Indonesian regulation [5] such as NOx, CO, SOx, PM10, and HC in addition to a substance that is responsible for global warming and climate change such as COx under Indonesian law [6]. All substances under scrutiny are emitted directly from their sources, also called as primary pollutants. When compared to other countries, the Indonesian ambient air quality standards for these substances are quite similar in some aspects as shown in Table 1.
Table 1. National Ambient Air Quality Standards For Countries Pollutant Assessment
time
Level
Indonesia [5] US [7] Europe [8] CO 1 hour 20 mg/m3 40 mg/m3 30 mg/m3 NOx 1 year 100 µg/m3 100 µg/m3 40 µg/m3 SOx 24 hours 365 µg/m3 365 µg/m3 125 µg/m3 SOx 1 year 60 µg/m3 58 µg/m3 50 µg/m3 PM10 24 hours 150 µg/m3 150 µg/m3 50 µg/m3
HC 3 hour 160 ug/Nm3 - -
This paper discusses the estimation of power plant emission in Batam for six primary substances. Aditionally, this paper tries to give details regarding the estimated emissions for the regulated community, the government, the public, and other affected parties, as the information is substantial for air quality management process.
METHODOLOGY
Primary data are obtained from field survey to all power plants in Batam. Power plants are defined as facilities with stationary combustion appliance to generate electric power for internal use and for sale to external user(s). The emissions are calculated by multiplying emission factors with activity levels found in the survey. An emission factor is used to estimate emissions because the actual emission data is not available. Since Indonesian emission factors is not existing yet, this paper uses emission factors of EMEP/EEA methods launched in 2013 and those of COx using the Intergovernmental Panel on Climate Change (IPCC) guidelines issued in 2006. The both of methods are used instead of another method such as USEPA, because the former ones have more similarities in the combustion technologies than the latter one does given that engines in Batam were imported from European countries.
Epollutant = ARfuelconsumption x EFpollutant (1) Where:
Epollutant = annual emission of pollutant EFpollutant = emission factor of pollutant ARfuel consumption = activity rate by fuel consumption
Both of EMEP/EEA and IPCC use average value of all available data of acceptable quality (usually from national energy statistics) assuming an average or typical technology and abatement implementation.
Meanwhile, Tier 2 technique includes type of combustion plant and relative mix of fuels which is stated in equation (2):
Epollutant = ∑ARi,j x EFi,j (2)
Where:
Epollutant = annual emmission of pollutant EF = emission factor
AR = activity rate
i = type of fuel
j = type of combustion plants
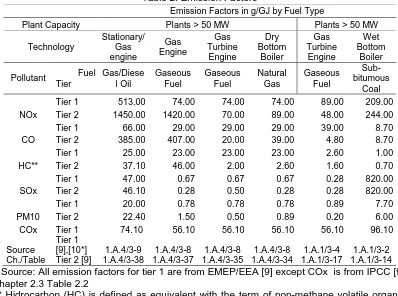
Tier 2 emission factor for CO2 is not available because Indonesia does not set national emission factors. In this paper, Tier 1 and Tier 2 emission factors used are stated in Table 2.
Table 2. Emission Factors
* Source: All emission factors for tier 1 are from EMEP/EEA [9] except COx is from IPCC [9] chapter 2.3 Table 2.2
** Hidrocarbon (HC) is defined as equivalent with the term of non-methane volatile organic (NMVOC)
The best practice is using Tier 3 data where applicable. Unfortunately it is not applicable in this research because facility-level emission reports are not available for all relevant combustion processes in Indonesia.
RESULTS AND DISCUSSION
Energy in Indonesia, like in most countries, largely generated from combustion of fossil fuels. In Batam, although biofuel is available and can be supplied by local producers, power plants prefer fossil fuels based on technology and security of supply reasons. Local
Emission Factors in g/GJ by Fuel Type
government is considering municipal waste for electricity generation [10] but the amount of waste in Batam alone is not enough to secure a continous supply for power plants, thus the current dominance of fossil fuels will not change in anytime soon.
The typical process scheme for power plants in Batam is shown in figure 1.
Figure 1. The Typical Process Scheme for Power Plants in Batam [9] Source: EMEP/EEA Emission Inventory Guidebook 2013, Fig. 2-2, Chapter 1.
During combustion of the fossil fuels, heat is produced to generate electricity. Most power plants in Batam only deliver electricity excluding wasted heat because heat is not
required in their own industrial process nor in their clients’ manufacturing process. PT Citra Tubindo Tbk is the only company that might install cogeneration system using waste heat because it may uses waste heat for internal manufacturing process besides electricity generation.
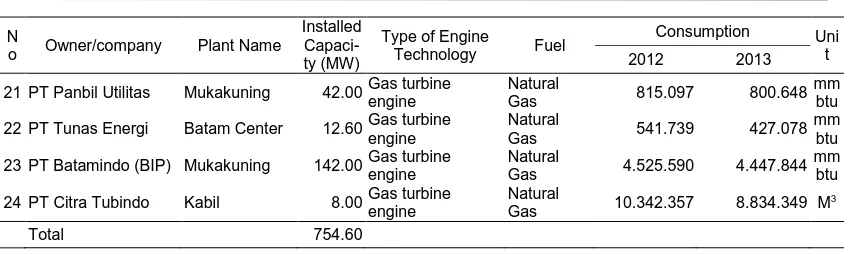
Out of 116 companies surveyed as potential point sources, 65 companies have gensets with capacity mostly under 1 MW. Most companies use the electricity generated for back up only and do not sell electricity to external user(s), thus, this research excludes them as samples. There are 24 power plants that fulfill the above definition and their activity rate are stated in Table 3.
Table 3. Power Plants in Batam and Their Activity Profiles
N
o Owner/company Plant Name
Installed
Kasam 130.00 Wet Bottom Boiler Coal 186.461 432.573.171 Ton
2 PLN Batam Sekupang 2 18.00 Stationery Engine Diesel 3.548.705 16.934 L
Energindo Jembo 2 Baloi 24.00 Gas engine
N
o Owner/company Plant Name
Installed
21 PT Panbil Utilitas Mukakuning 42.00 Gas turbine engine
23 PT Batamindo (BIP) Mukakuning 142.00 Gas turbine engine electricity exclusively for companies within their industrial zones. However, they would supply their excess capacity to PT PLN Batam, a state-owned utility, should the latter one needs to support public demand. However, the power tariff charged by the three companies is higher than the PLN tariff but they compensate this by ensuring the high-level of security of power supply to their customers [11].
All other companies outside PT Panbil, PT Tunas, and PT Batamindo industrial zone along with residential end-users purchase power from PLN Batam. PT PLN Batam has nine plants but it continues to decrease its own production and prefers buying from independent power producer, especially PT TJK. The reason for this preference is that high speed diesel which is used by most of PLN plants, is not competitive anymore in terms of security of supply and price fluctuation. Another reason is that PT TJK offers lower tariff because it uses coals as main input supply.
To estimate the emissions of power plants in Batam, the conversion units are assumed and stated in Table 4.
Table 4. Conversion Unit Assumptions Fuel Calorific Value Units Sub-bitumous Coal in 2012* 1.97 x 101 GJ/Ton Sub-bitumous Coal in 2013* 1.57 x 101 GJ/Ton High Speed Diesel* 3.59 x 10⁻⁵ GJ/L
Marine Fuel Oil 3.97 x 10⁻⁵ GJ/L
Natural Gas 3.29 x 101 GJ/M3
Natural Gas 3.94 x 10⁻³ GJ/mmbtu
Because the quality of coals imported from Korea varies through out year 2012 and 2013, then the average calorific value of coals in 2012 differs with that in 2013. Meanwhile, the quality of other types of fuels tends to be persistent year to year. The calorific values used in this research are based on PLN internal data.
When compared to the gross calorific values in the United Kingdom (UK) [12], this assumptions seem plausible (look at Table 5).
Table 5. Conversion Unit Assumptions
Fuel Calorific Value Units
Research UK Variance
Sub-bitumous Coal 15.7 - 19.7 26.2 (8.5) GJ/Ton High Speed Diesel 46.2 45.6 0.6 GJ/Ton Marine Fuel Oil 42.3 43.3 (1.0) GJ/Ton
Natural Gas 32.9 39.8 (6.9) MJ/M3
Diesel is the only type of fuel which the power plants in Batam have higher calorific value than those in the UK. Power plants in Batam use a very low quality of coal, thus the calorific value of coal in Batam is lower than that in the UK.
The increasing dominance coal power plant brings consequences on the environment. Based on emission factors (Table 2 and Table 3), activity rate of power plants (Table 4) and conversion units assumed (Table 5), the total emissions could be calculated as stated in Table 6.
Table 6. The Total Emissions of Power Plants
tant 1 2 3 4 5 6 7 8 9 10 11 12 13 14 15 16 17 18 19 20 21 22 23 24
Emission Tier 1 2012 in
Ton
NOx 768 0 0 0 0 0 0 0 0 0 1 - 0 0 0 0 0 0 0 2 0 0 2 9
CO 32 0 0 0 0 0 0 0 0 0 1 - 0 0 0 0 0 0 0 1 0 0 1 1
HC 4 0 0 0 0 0 0 0 0 0 0 - 0 0 0 0 0 0 0 0 0 0 0 9
SOx 3.014 0 0 0 0 0 0 0 0 0 0 - 0 0 0 0 0 0 0 0 0 0 0 0
PM10 28 0 0 0 0 0 0 0 0 0 0 - 0 0 0 0 0 0 0 0 0 0 0 0
CO2 353 0 0 0 0 0 0 0 0 0 1 - 0 0 0 0 0 0 0 1 0 0 1 2
Emission Tier 2 2012 in
Ton
NOx 897 0 0 0 0 0 0 0 0 0 1 - 5 6 4 7 0 0 8 1 0 0 1 7
CO 32 0 0 0 0 0 0 0 0 0 0 - 1 2 1 2 0 0 2 0 0 0 0 8
HC 3 0 0 0 0 0 0 0 0 0 0 - 0 0 0 0 0 0 0 0 0 0 0 1
SOx 3.014 0 0 0 0 0 0 0 0 0 0 - 0 0 0 0 0 0 0 0 0 0 0 0
PM10 22 0 0 0 0 0 0 0 0 0 0 - 0 0 0 0 0 0 0 0 0 0 0 0
Emission Tier 1 2013 in
Ton
NOx 1.415.103 0 - - 0 - - - 0 0 2 - 0 0 0 - - - 0 1 0 0 2 25
CO 58.906 0 - - 0 - - - 0 0 1 - 0 0 0 - - - 0 1 0 0 1 10
HC 6.771 0 - - 0 - - - 0 0 0 - 0 0 0 - - - 0 0 0 0 0 8
SOx 5.552.081 0 - - 0 - - - 0 0 0 - 0 0 0 - - - 0 0 0 0 0 0
PM10 52.135 0 - - 0 - - - 0 0 0 - 0 0 0 - - - 0 0 0 0 0 0
CO2 650.677 0 - - 0 - - - 0 0 1 - 0 0 0 - - - 0 1 0 0 1 19
Emission Tier 2 2012 in
Ton
NOx 1.652.083 0 - - 0 - - - 0 6 1 - 3 5 3 - - - 6 1 0 0 1 23
CO 58.906 0 - - 0 - - - 0 2 0 - 1 1 1 - - - 2 0 0 0 0 7
HC 4.740 0 - - 0 - - - 0 0 0 - 0 0 0 - - - 0 0 0 0 0 1
SOx 5.552.081 0 - - 0 - - - 0 0 0 - 0 0 0 - - - 0 0 0 0 0 0
PM10 40.625 0 - - 0 - - - 0 0 0 - 0 0 0 - - - 0 0 0 0 0 0
All numbers above are rounded numbers. Thus, zero numbers in the above table is not exactly zero. When the plant is not utilized in 2013, the plant will emit zero pollutant and dash (-) symbol is used.
As we can see from table 6, we can see that PT TJK (plant number 1) which uses sub-bituminous coals as its main input supply emits the most significant pollutant to the air, and it continues to generate more emissions from time to time. When compared to other power plants, the emissions of PT TJK stands out, thus the author argues that the emissions reduction actions should focus on this power plant either by switching the type of fuel, improving the powerplant efficiency, or capturing the COx in the flue gas and storing it [13].
CONCLUSIONS
ACKNOWLEDGEMENT
The author thanks to the cooperation between Ministry of Environment of the Republic of Indonesia, the Environmental Impact ManagementAgency (BAPEDAL) of Batam Municipality, Politeknik Negeri Batam i.e. Andy Triwinarko, Didi Istardi, Dian Mulyaningtyas, and Syafei Ghozali, for their support in this research.
REFERENCES
1. Rashid, M., M. Rasli, M. Rozainee. 1998. A Field Evaluation of Particulate Emission Concentrations in Palm Oil Mill Boilers. Jurnal Teknologi. 29(Dec 1998): 1-6.
2. Yusoff, A. R., Aziz, I. A. 2009. Predicting Boiler Emission by Using Artificial Neural Networks. Jurnal Teknologi. 50(June 2009): 15-28.
3. Rashidi, M., Jaswar. 2014. Prediction of CO2 Emitted by Marine Transport in Batam-Singapore Channel using AIS. Jurnal Teknologi. 69(7): 121-126.
4. Triwinarko, A., Kartikasari, D., Istardi, D., Ghozali, S., Mulyaningtyas, D. 2015. Air Pollutant Emissions in Batam: An Overview. Jurnal Teknologi. 77(23): 71-76.
5. Air Pollution Control. Indonesian Government Regulation Number 41. 1999.
6. Indonesian Law Number 17. 2004. Ratification of The Kyoto Protocol to the United Nations Framework C'onvention on Climate Change.
7. The United States Environmental Protection Agency. 1996. Emission Inventory Improvement Program: Preferred and Alternative Methods for Gathering and Locating Specific Emission Data. Washington D.C. U.S. EPA.
8. World Health Organization. 2005. WHO Air Quality Guidelines for Particulate Matter, Ozone, Nitrogen Dioxide and Sulfur Dioxide. WHO/SDE/PHE/OEH/06.02
9. European Environment Agency/Long Range Transboundary Air Pollution. 2013. EMEP/EEA Air Pollutant Emission Inventory Guidebook. Luxembourg: Publications Office of the European Union.
10. Greene, W.H. 2010. Econometric Analysis. New Jersey: Prentice Hall
11. Witjaksono, Y., Biomass Power Plants and Biofuel Industries Development in Indonesia. 2013. Finland: Masyarakat Energi Terbarukan Indonesia (METI) and Energy and Environment Partnership (EEP) Indonesia.
12. Clean Development Mechanism. 2006. Batamindo Project Design Document. United Nations Framework Convention on Climate Change.
![Figure 1. The Typical Process Scheme for Power Plants in Batam [9] Source: EMEP/EEA Emission Inventory Guidebook 2013, Fig](https://thumb-ap.123doks.com/thumbv2/123dok/1776657.1129218/4.595.86.505.416.773/figure-typical-process-scheme-plants-emission-inventory-guidebook.webp)