Gadjah Mada International Journal of Business
May-August 2010, Vol. 12, No. 2, pp. 159–187
Mamduh M. Hanafi
Faculty of Economics and Business, Universitas Gadjah Mada#
UNUSUAL MARKET ACTIVITY
ANNOUNCEMENTS
A Study of Price Manipulation on the Indonesian Stock
Exchange*
Keywords: emerging market; price manipulation; unusual market activity announce-ment
We investigate stocks involved in the Unusual Market Activity (UMA) Announcements. The Indonesian Stock Exchange occasionally issues UMA announcements when it suspects that there are unusual price increases (positive UMAs) or price decreases (negative UMAs), as well as unusual increases in trading volumes. We believe that UMA announcements signal a high probability that stocks are being manipulated. We find no differences in fundamentals and trading variables between stocks in the UMA announcements and those not in the UMA announcements. Any stock is vulnerable to market manipula-tion. Stocks in the UMA announcements do not exhibit reversal patterns, suggesting that price effect is permanent. UMAs seem to convey relevant information, which is most likely in the form of insider type of information.
* We gratefully acknowledge research grant from Faculty of Economics and Business, Universitas
Introduction
The story of market manipulation is plentiful; such practice is probably as old as the stock market per se. There are colorful instances of market ma-nipulation, from the traditional era to the most recent one, the internet era. In the old era, such as on the Amsterdam Stock Exchange in the 17th century,
manipulators spread out false news in local cafes, forcing other investors to sell or buy based on inaccurate infor-mation. The manipulators then traded in the opposite direction to earn profit. In the internet era, manipulative ac-tions are facilitated by technology. The manipulators spread out false rumors using internet message boards. While the techniques harnessed are essen-tially the same, manipulations in internet era exert faster impacts and involve larger audiences, hence larger effects (Leinweber and Madhavan 2001).
Emerging markets, such as Indo-nesia, are more vulnerable to market manipulations for several reasons. First, law infrastructure and enforcement in emerging markets tend to be young and still weak. For instance, the Indonesian government already passed the Capital Market Law in 1995, in which there are rules against market manipulation. However, heretofore, there has been no criminal indictment for market ma-nipulation cases. Second, corporate governance tends to be weak. Outside investors are constantly faced with potential for tunneling, revenues hiding, and other forms of expropriations. Conversations with market regulators, brokers, traders, and investors suggest
that market manipulation is so preva-lent on the Indonesian Stock Exchange. Although the manipulations are be-lieved to be a significant impediment to the development of the stock market, the evidence on the manipulations, es-pecially in emerging markets, has been anecdotal. There have been a few academic studies that provide evidence on the market manipulation in emerg-ing markets.
The study of price manipulation is pivotal for several reasons. From the academic perspective, there is an on-going debate as to whether price ma-nipulation can be used to gain profit. If the market is efficient, arbitrageurs will quickly take advantage of any mispricing, moving prices into equilib-rium conditions. The question is whether the market is as efficient as what described in the academic literature. The issue of efficiency as a necessary condition is of particular concern in emerging markets, such as the Indone-sian Stock Exchange. Market infra-structure, disclosure, regulations, and the enforcement of regulations on the Indonesian market are arguably lower than those in developed markets. Even in a developed market, market manipu-lation is still an important issue.
manipu-lated stocks 11 times by posting mes-sages on the Yahoo Finance message boards, and made profit of $800,000. The results of market manipulation research, albeit being derived from the studies of penny stocks, may also be useful for analyzing larger cases of fraud such as Enron or WorldCom. Of course, studies of market manipulation are important in emerging markets where the market infrastructure has not developed, such as that shown in Pakistan (Khwaja and Mian 2003) and China (Walter and Howie 2003).
From the policy perspective, re-search on market manipulation could provide significant contributions. The regulator generally has an objective of maintaining a fair and efficient market. Research on market manipulation could provide insights into the characteristics of manipulated stocks and manipula-tion techniques, thereby helping regu-lators design more effective market surveillance (Cumming and Johan 2007; Jiang et al. 2005). Indonesia is well suited for such a study. As aforemen-tioned, market infrastructure in Indo-nesia is not well developed compared to that in the developed markets. The Indonesian market is basically small, especially for its small cap stocks, which increases the probability of manipula-tion.
This paper attempts to investigate the issue of price manipulation on the Indonesian Stock Exchange. Direct evidence on market manipulation is difficult to obtain. As explained above, there has been no prosecution against market manipulation on the Indonesian
market. Hence, we use indirect evi-dence on market manipulation by study-ing stocks involved in the announce-ments of Unusual Market Activity (UMA) by the Indonesian Stock Ex-change (ISX). The ISX occasionally issues UMA announcements when the Exchange suspects unusual movements in listed stocks. While the ISX explicitly states that the announcements do not necessarily indicate the existence of manipulation, we believe that the an-nouncements signal a high probability that the stocks announced are being manipulated. Therefore, we use the UMA announcements as a proxy for market manipulation. The ISX issues both positive and negative UMA nouncements. In a positive UMA an-nouncement, the ISX reveals that there have been unusual price and trading volume increases. Meanwhile, in a negative UMA announcement, the ISX states that there has been an unusual price decrease and trading volume in-crease. We investigate both types of UMA announcements.
suggest that any stock is vulnerable to price manipulation.
When we investigate price move-ments and trading activities on the days leading to UMA announcements, we find significant positive (negative) ab-normal returns on the days leading to positive (negative) UMA announce-ments. Trading volume, trading fre-quency, and price range increase sig-nificantly during this period. We com-pare our sample with matched stocks and abnormal return matched stocks. The matched stocks do not show price movements and trading activities as do the sample stocks. Abnormal return matched stocks show a similar pattern to that of sample stocks. Price move-ments and trading activities increase significantly in the event period (days leading to UMA announcements). In the last section, we find that UMA stocks do not exhibit price reversals. This pattern suggests that UMA an-nouncements contain relevant infor-mation. Price manipulations in UMA announcements are more likely to in-volve relevant “inside” information.
The remainder of this paper is organized as follows. Next section dis-cusses literature review. Section 3 ex-plains the Unusual Market Announce-ments on the Indonesian Stock Ex-change. Subsequently, Section 4 dis-cusses the fundamental and trading characteristics of UMA stocks. In sec-tion 5, we investigate price movements and trading behavior in the periods of pre-, leading to, and post-UMA an-nouncements. Section 6 conducts ro-bustness checks by creating a matched
portfolio based on abnormal returns. Then we investigate stock performance in the post-UMA announcement pe-riod in Section 7. Eventually, Section 8 concludes.
Literature Review
This study investigates the issues around stock manipulation, i.e., the characteristics of manipulated stocks, the trading characteristics of manipu-lated stocks before, during, and after being manipulated, the price move-ments of manipulated stocks, and the various ways of manipulating stocks. As described by Aggarwal and Wu (2006), manipulation can occur in a variety of ways such as: (1) actions taken by insiders that influence stock prices (e.g., accounting and earnings manipulations) and (2) the release of false information or rumors in Internet chat rooms. Aggarwal and Wu (2006) and Merrick et al. (2005) provide inter-esting descriptions of the anatomy of manipulation.
prompted the current anti-manipula-tion rules in the U.S.
Khwaja and Mian (2005) investi-gated a strategy of “pump and dump” price manipulation on the Pakistani Stock Exchange. When prices are low, colluding brokers trade among them-selves to artificially raise prices and attract positive-feedback traders. Once prices have risen, the former brokers exit, leaving the latter to suffer the price fall. Using unique trade level data, they find that when brokers trade on their own behalf, the brokers earn an annual rate of return which is 50-90 percentage points higher than that earned by outside investors. This profit could not be explained by market tim-ing or liquidity provision by brokers. This result has adverse implications to the capital markets, i.e., market re-forms are hard to implement and emerging equity markets often remain marginal with few outside investors.
This study aims to shed light on the nature of stock manipulation using the Indonesian market. From the meth-odological perspective, Aggarwal and Wu (2006) is probably the closest to this paper. This paper identifies certain manipulation actions, in this case the Unusual Market Announcements, and then investigates stock trading activi-ties in the pre-, during, and post-ma-nipulation periods. However, our con-clusion is probably closest to Jiang et al. (2005) and Mahoney (1999), who find that stock pools in U.S. are associated with inside and relevant information. This paper provides evidence that stocks in the UMA announcements do not
experience reversals, suggesting that information contained in the UMA is permanent. We argue that the UMA announcements are more likely to con-tain inside information. From the sample perspective, this paper is probably clos-est to Khwaja and Mian (2005) who conducted a study on the Pakistani market, which is also an example of emerging markets. We believe that the Indonesian and the Pakistani markets share similarity with respect to emerg-ing market characteristics.
Unusual Market Activity
Announcements and Sample
Selection
Starting in April 2008, the Indone-sian Stock Exchange (ISX) has occa-sionally issued Unusual Market Activ-ity (UMA) announcements. In 2008, there were 49 UMA announcements issued by the ISX. We use all 49 UMA announcements in 2008 as our sample. The announcements basically inform investors that there have been unusual market activities for certain stocks. While the ISX explicitly says that the announcements do not necessarily im-ply the existence of market manipula-tions for the stocks, we believe that the ISX has valid reasons to issue the announcements. We believe that the UMA announcements signal a high probability of manipulations in stocks involved.
re-veals that there have been unusual price and trading volume increases, compared to the previous period. Mean-while, in a negative UMA announce-ment, the ISX reports that there has been an unusual price decrease and trading volume increase, compared to the previous period. The ISX officially mentions price and trading volume as the indicators of UMA announcements. The UMA announcements use standard language. In the first sen-tence, the ISX states that there have been unusual price movement and trad-ing activity in a certain stock. The next sentence states that the ISX has asked for confirmation from the company, and it announces the last published information on the stock. Then the ISX reveals that the Exchange is paying close attention to price movements and
trading activities of the stock, and warns investors to: (1) pay attention to the company’s response to the ISX’s in-quiry, (2) scrutinize the company’s fun-damentals and corporate actions to find out if some plans have not been approved by the stockholder meeting, and (3) consider all possibilities that may occur in the future before making investment decisions.
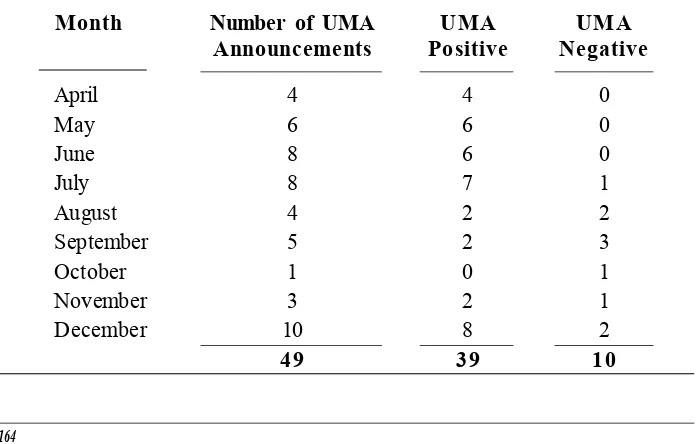
During 2008, the ISX issued 49 UMA announcements. Table 1 reports the distribution of UMA announce-ments based on months and types of UMA.
In 2008, the ISX issued positive UMAs more often than negative UMAs, i.e., 39 and 10, respectively.
Given asymmetric responses for negative and positive events, or buying and selling events, found in several
Table 1. Distribution of UMA Announcements
This table reports the Unusual Market Activity Announcements on the Indonesian Stock Exchange during 2008. UMA Positive announces that there are significant price increases, whereas UMA Negative announces that there are significant price decreases.
Month Number of UMA UMA UMA
Announcements Positive Negative
April 4 4 0
May 6 6 0
June 8 6 0
July 8 7 1
August 4 2 2
September 5 2 3
October 1 0 1
November 3 2 1
December 10 8 2
studies,1 we believe that separate
analy-ses between negative and positive market manipulations should be con-ducted. However, most manipulation models, such as Aggarwal and Wu (2006), are focused on price-increas-ing type of manipulation. The positive and negative UMA announcements are suitable to investigate the asym-metric patterns found in previous stud-ies. The asymmetric findings for posi-tive and negaposi-tive UMA announce-ments are expected to provide addi-tional insights.
Fundamental and Trading
Characteristics of Sample
Stocks and Matched Stocks
Fundamental Characteristics
We create a matched portfolio comprised of 49 stocks in the same industry as the sample stocks, and which have the closest market capitali-zations to those of the sample stocks. The average capitalization for the sample is Rp1.839 trillion, with stan-dard deviation of around Rp3.38
tril-1 For example, Cheuk et al. (2006) report that in Hong Kong, insider selling yields higher profit
than insider buying.
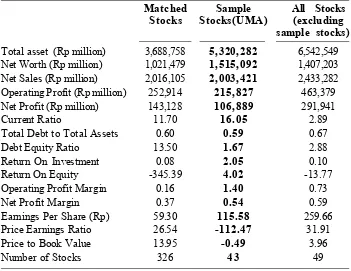
Table 2. Fundamental Characteristics of Matched, Sample (UMA), and All Stocks
This table presents the fundamental characteristics of matched stocks, sample (UMA) stocks, and all stocks (excluding the sample stocks) by the end of 2007.
Matched Sample All Stocks
Stocks Stocks(UMA) (excluding
sample stocks) Total asset (Rp million) 3,688,758 5,320,282 6,542,549 Net Worth (Rp million) 1,021,479 1,515,092 1,407,203 Net Sales (Rp million) 2,016,105 2,003,421 2,433,282 Operating Profit (Rp million) 252,914 215,827 463,379 Net Profit (Rp million) 143,128 106,889 291,941
Current Ratio 11.70 16.05 2.89
Total Debt to Total Assets 0.60 0.59 0.67
Debt Equity Ratio 13.50 1.67 2.88
Return On Investment 0.08 2.05 0.10
Return On Equity -345.39 4.02 -13.77
Operating Profit Margin 0.16 1.40 0.73
Net Profit Margin 0.37 0.54 0.59
Earnings Per Share (Rp) 59.30 115.58 259.66
Price Earnings Ratio 26.54 -112.47 31.91
Price to Book Value 13.95 -0.49 3.96
lion. The biggest stock in our sample is Barito Pacific Tbk., whose capitaliza-tion is around Rp15.355 trillion. The smallest stock in our sample is Betonjaya Manunggal Tbk., with the capitaliza-tion of around Rp28.8 billion. If we truncate the three biggest stocks in our sample (Barito Pacific, Bakrie Sumatra Plantation, and Bakrie Brothers), the average capitalization drops to around Rp865 billion, with standard deviation of around Rp1.4 trillion. Table 2 reports
the fundamental characteristics of sample, matched stocks, and all stocks listed on the ISX, excluding the sample stocks.
The sample and matched stocks seem to have similar fundamentals. The last column reports the averages of fundamentals for the rest of the companies listed on the ISX (excluding the sample stocks). Compared to the rest of the companies, the sample stocks tend to have smaller size as shown by Table 3. Regression Analysis on the Fundamental Differences for Sample
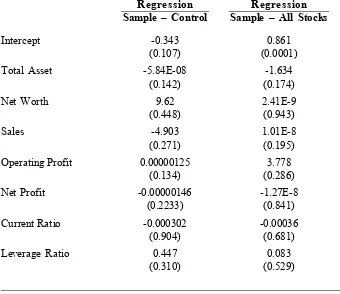
(UMA) Stocks, Matched Stocks, and All Stocks
This table presents the regression analysis to investigate whether there are fundamental differences between sample (UMA) stocks and matched stocks, and between sample stocks and all stocks. All stocks exclude the sample stocks. Dependent variable has a value of 1 for matched stocks and 0 for sample stocks, and has a value of 1 for all stocks (excluding the sample stocks) and 0 for sample stocks. P-values are in parentheses.
Regression Regression
Sample – Control Sample – All Stocks
Intercept -0.343 0.861
(0.107) (0.0001)
Total Asset -5.84E-08 -1.634
(0.142) (0.174)
Net Worth 9.62 2.41E-9
(0.448) (0.943)
Sales -4.903 1.01E-8
(0.271) (0.195)
Operating Profit 0.00000125 3.778
(0.134) (0.286)
Net Profit -0.00000146 -1.27E-8
(0.2233) (0.841)
Current Ratio -0.000302 -0.00036
(0.904) (0.681)
Leverage Ratio 0.447 0.083
smaller total assets, total net worth, and sales. The non-sample stocks also tend to have higher profitability than do sample stocks. Unfortunately, statisti-cal tests fail to show significant differ-ences. None of the fundamental vari-ables show significant differences be-tween sample stocks and matched port-folio and between sample stocks and the rest of the stocks.
Table 3 reports multivariate tests for fundamental variables between sample stocks and matched stocks and
between sample stocks and the rest of the stocks. Again, the tests do not find significant differences.
Trading Characteristics
We investigate whether sample stocks have different trading charac-teristics from those of matched stocks and all stocks. Table 4 reports the descriptive statistics of trading vari-ables of sample, matched, and all stocks (excluding the sample stocks).
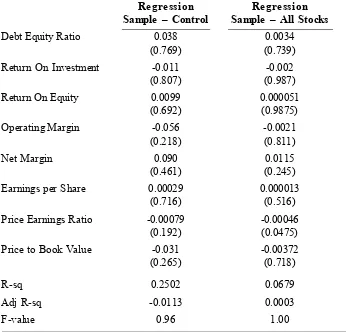
Continued from Table 3
Regression Regression
Sample – Control Sample – All Stocks
Debt Equity Ratio 0.038 0.0034
(0.769) (0.739)
Return On Investment -0.011 -0.002
(0.807) (0.987)
Return On Equity 0.0099 0.000051
(0.692) (0.9875)
Operating Margin -0.056 -0.0021
(0.218) (0.811)
Net Margin 0.090 0.0115
(0.461) (0.245)
Earnings per Share 0.00029 0.000013
(0.716) (0.516)
Price Earnings Ratio -0.00079 -0.00046
(0.192) (0.0475)
Price to Book Value -0.031 -0.00372
(0.265) (0.718)
R-sq 0.2502 0.0679
Adj R-sq -0.0113 0.0003
Table 4.Trading Characteristics of Sample (UMA) Stocks, Matched Stocks, and the Rest of the Stocks
This table presents the trading characteristics of matched stocks, sample (UMA) stocks, and all stocks (excluding the sample stocks) by the end of 2007.
All F-value
Stocks Matched Sample Sample Matched
(excluding Stocks Stocks – All – Sample
sample Stocks Stocks
stocks)
Price (Rp) 2,348 1,288 704 1.74 1.13
Trading Volume 5,522,200 7,569,070 8,568,514 1.06 0.06 (shares)
Trading Frequency 133 143 188 0.90 0.70
Beta 0.0846 0.0814 0.0853 0.04 0.81
Stock Variance 0.00168 0.00192 0.02618 7.96*** 0.99 Residual Variance 0.25021 0.25196 0.24913 0.13 0.81
Trade Size 37,060 40,216 31,345 0.27 0.54
Number of Stocks 326 43 49
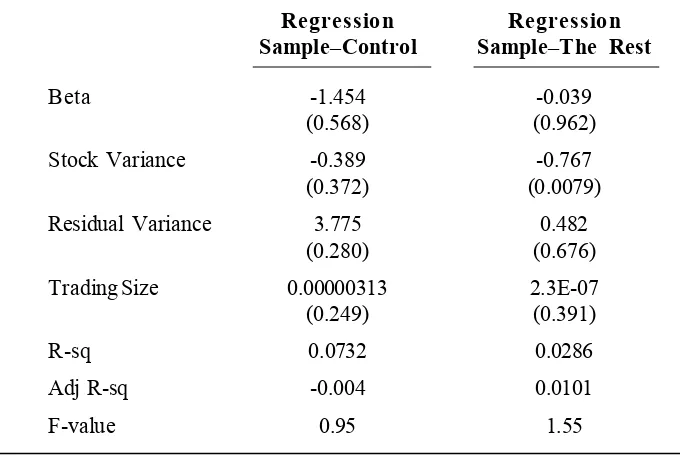
Table 5.Regression Analysis on the Trading Variable Differences for Sample Stocks, Matched Stocks, and All Stocks
This table presents the regression analysis of fundamental differences between sample stocks and matched stocks, and between sample stocks and all stocks. The rest excludes sample stocks. Dependent variable has a value of 1 for matched stocks and 0 for sample stocks, and has a value of 1 for the rest and 0 for sample stocks. P-values are in parentheses
Regression Regression
Sample–Control Sample–The Rest
Intercept -0.435 0.749
(0.640) (0.012)
Price 0.000026 0.0000028
(0.201) (0.171)
Trading Volume -8.98E-9 -8.944E-10
(0.359) (0.459)
Trading Frequency 0.00125 -0.0000102
Sample stocks tend to have lower prices. The average price of sample stocks is Rp704, which is approxi-mately one-third of the average price of the rest of the stocks. Interestingly, trading volumes and trading frequency of sample stocks are on average higher than those of matched stocks and the rest of the companies. Betas of sample stocks tend to be similar to those of matched and the rest of the stocks. However, stock and residual variances of sample stocks are larger than those of matched stocks and the rest of the stocks. Meanwhile, trading size of sample stocks tends to be smaller. Unfortunately, statistical tests show a significant difference only for the stock variance.
Table 5 shows the results of mul-tivariate tests for differences in trading
characteristics between sample stocks and matched stocks and the rest of the stocks. Again, only the stock variance exhibits a significant regression coeffi-cient.
Comparison with BAPEPAM
Statements Regarding Market
Manipulation
Our findings in this section par-tially support the BAPEPAM’s (Indo-nesian Stock Market Supervisory Board) conjecture of manipulated stocks. The BAPEPAM officially de-scribes a manipulated stock as follows: (1) market capitalization is less than Rp20 trillion, (2) the stock is illiquid, with the number of transactions fewer 30 times annually, (3) fundamentals are weak, (4) market price is low, less than Rp500, (5) the stock experiences
Continued from Table 5
Regression Regression
Sample–Control Sample–The Rest
Beta -1.454 -0.039
(0.568) (0.962)
Stock Variance -0.389 -0.767
(0.372) (0.0079)
Residual Variance 3.775 0.482
(0.280) (0.676)
Trading Size 0.00000313 2.3E-07
(0.249) (0.391)
R-sq 0.0732 0.0286
Adj R-sq -0.004 0.0101
significant price and volume increases, up to more than 30 persent a day. Our findings show that the sample stocks tend to have lower market capitaliza-tions and lower prices, consistent with the BAPEPAM’s descriptions. How-ever, the sample stocks tend to be more liquid, as shown by higher trading vol-umes and frequency. The fundamen-tals of sample stocks tend to be similar to other stocks. Unfortunately, the sta-tistical power in our tests is low. Next section discusses the trading charac-teristics around the event of UMA announcement.
Price Movements and
Trading Characteristics in
the Pre-, During, and
Post-Manipulation Periods
Descriptive Analysis
In this section, we investigate the trading patterns around the UMA an-nouncements. We calculate the cumu-lative abnormal returns using market-adjusted, risk-and-market-adjusted (market model adjustment) and matched-stocks-adjusted models around the announcements. We
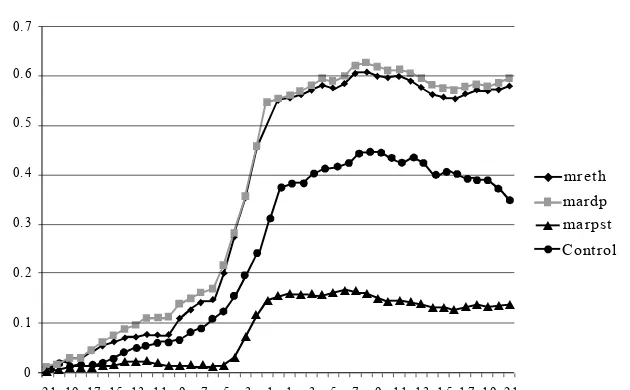
re-Figure 1. Price Movements Around UMA Announcements
This figure shows the price movements around UMA Announcements from days -21 to +21 around the announcements. Mreth is daily return. Mardp is market-adjusted abnormal return (return – market return). Marpst is risk-and-market-adjusted abnormal return. Risk-and-market-adjustment abnor-mal return is constructed using the market model which is estimated by utilizing data for one year leading to the announcement day. Control is matched stocks’ abnormal returns (Return on the sample stocks – Return on matched stocks)
Panel A. Positive UMA Announcements
-21 -19 -17 -15 -13 -11 -9 -7 -5 -3 -1 1 3 5 7 9 11 13 15 17 19 21 0
0.1 0.2 0.3 0.4 0.5 0.6 0.7
strict the period from days -21 to +21 relative to the announcements. Figure 1 shows the price movements on the days around announcements for posi-tive and negaposi-tive UMAs. For posiposi-tive UMAs (Panel A), prices tend to stabi-lize after the announcements whereas for negative UMAs (Panel B), prices tend to decline further. These results indicate that unusual price movements convey information rather than pure market manipulations. In market ma-nipulations, Aggrawal and Wu (2006) show that the manipulators drive prices to a high level in the manipulation pe-riod. The prices are still at the high level in the post-manipulation period, as the manipulators sell their shares. Finally, the prices decrease as their true values are revealed. However, Jiang et al. (2005) find that conditional on trading volumes, stock pools show a continua-tion pattern. This finding implies that stock pools convey information
(in-sider trading, in this case) rather than pure or noisy price manipulations.
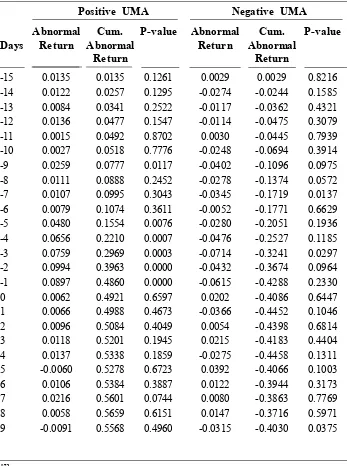
Table Table 6 reports the market-adjusted abnormal returns on the days surrounding UMA announcements. For positive UMAs, stock prices start in-creasing significatly on day -5. On this day, the stock return is around 4 persent, which is statistically significant at 1 persent level. Price increase continues until day -1. During the five days lead-ing to announcements, stocks increase by more than 30 persent. This number is economically and statistically signifi-cant. On the post-announcement days, stock prices move insignificantly. For negative UMAs, stock prices start de-creasing on day -3, but the movements tend to be weaker as shown by the weak statistical significances. During five days leading to negative UMA announcements, the cumulative nega-tive return reaches the level of -20 persent. This figure seems to be eco-Panel A. Negative UMA Announcements
nomically significant, although it is weaker statistically than that for posi-tive UMAs. Similar to posiposi-tive UMAs,
price movements in the post-announce-ment period are statistically insignifi-cant.
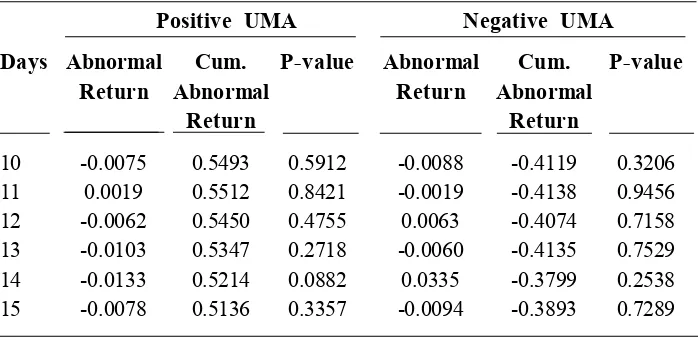
Table 6. Abnormal Returns around UMA Announcement Days
This table reports the abnormal returns during days -15 to +15 relative to UMA announcements. Abnormal return is calculated using the market-adjusted method (Returnit – Market returnt).
Positive UMA Negative UMA
Abnormal Cum. P-value Abnormal Cum. P-value
Days Return Abnormal Return Abnormal
Return Return
To examine whether there are certain patterns associated with un-usual market activities, we further in-vestigate trading volumes, trading val-ues, trading frequency, price volatility, and return volatility around the event days. Appendix 1 to 4 show the activi-ties around event days.
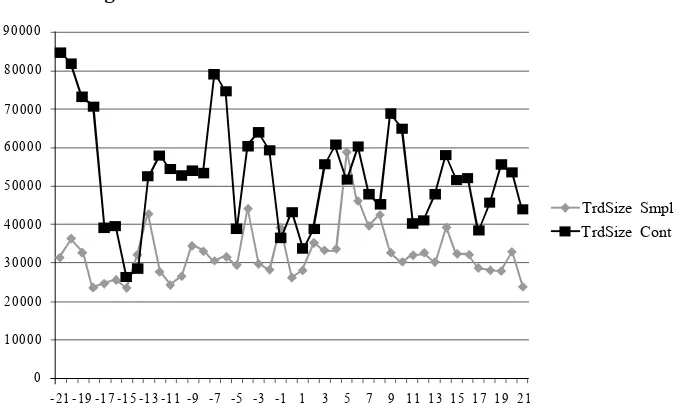
We observe noticeable findings for the trading characteristics of sample stocks, i.e., trading volumes and fre-quency increase dramatically from day -5 to day -1. We also observe a significant increase in price range from day -5 to day -1. Trading size does not seem to change during the same days.
We further define more formally the pre-, leading to, and post-UMA announcement periods, and investigate price movements and trading charac-teristics during these periods. Unlike
Aggarwal and Wu (2006) who have actual manipulation data that enable them to identify the starting and ending dates of manipulations, we do not have actual manipulation data. We rely on the visual inspection of Figures 1 and 2 to determine the pre-, leading to, and post-UMA announcement periods. Specifically, we define the period of pre-UMA announcements as days -21 to -6, the period of leading to UMA announcements as days -5 to 1, and the period of post-UMA announcements as days +1 to +7. We also define days +8 to +50 as the “normal” period, in which we believe the effect of UMA announcements has diminished.2
Table 7 reports the descriptive statistics of price movements and trad-ing variables in the pre-, leadtrad-ing to, and post-UMA announcement periods. For
Continued from Table 6
Positive UMA Negative UMA
Days Abnormal Cum. P-value Abnormal Cum. P-value
Return Abnormal Return Abnormal
Return Return
10 -0.0075 0.5493 0.5912 -0.0088 -0.4119 0.3206 11 0.0019 0.5512 0.8421 -0.0019 -0.4138 0.9456 12 -0.0062 0.5450 0.4755 0.0063 -0.4074 0.7158 13 -0.0103 0.5347 0.2718 -0.0060 -0.4135 0.7529 14 -0.0133 0.5214 0.0882 0.0335 -0.3799 0.2538 15 -0.0078 0.5136 0.3357 -0.0094 -0.3893 0.7289
2 Aggarwal and Wu (2006) report the length of manipulation period; the mean is 308.33 days,
positive UMAs, the mean of cumula-tive returns from days -5 to -1 is 41 persent, while the cumulative abnor-mal return with market-adjusted model is 38 persent and the cumulative return with risk-and-market-adjusted model is 13.8 persent. These numbers are statistically significant at 1 persent level.
While the average is positive, we still observe negative numbers for cumula-tive returns or abnormal returns al-though these numbers are small. For negative UMAs, the means of cumula-tive numbers from days -5 to -1 are 27 persent for cumulative returns, 23 persent for CAR with market-adjusted Table 7. Descriptive Statistics for Returns, Abnormal Returns, and
Trad-ing Variables on the Days LeadTrad-ing to UMA Announcements
This table presents the descriptive statistics for Returns, Abnormal Returns, and Trading Variables on the days leading to (defined as day -5 to day -1) UMA Announcements. Market-adjusted abnormal return is calculated as return – market return. Risk-and-market-adjusted abnormal return is calculated as return minus expected return constructed from the market model. Parameters in market model are estimated using the data for one year leading to the announcement day. Price range is calculated as follows: {(Daily Highest Price – Daily Lowest Price) / Average of Daily Highest and Lowest Price} x 100 persent. Daily trading size is calculated as daily trading volume divided by daily trading frequency. ***, **, and * mean significant at 1 persent, 5 persent, and 10 persent, respectively. Significance is reported only for return variables.
A. Positive UMA Announcements
Mean Median Std Dev Min Max
Daily Return 0.4088*** 0.4299 0.3142 -0.4206 1.3531 # of positive return 37
CAR 0.3858*** 0.4281 0.3237 -0.4211 1.4037
(Market Adjusted)
# of positive CAR 35
CAR 0.1370*** 0.0911 0.1849 -0.2993 0.6181
(Risk and Market Adj)
# of positive CAR 35
Daily Trading Volume 19,411,756 2,573,300 28,499,709 0 100,352,800
Daily Trading 453 215 529 0 1,732
Frequency
Daily Trade Size 29,876 19,828 35,666 1,722 188,918
Price Range (%) 10 10 5 3 24
model, and 0.9 persent for CAR with risk-and-market-adjusted model. CAR with risk-and-market-adjusted model seems to be less robust, as evidenced by weak statistical results. CAR with risk-and-market-adjusted model is not statistically significant within 10 persent level.
For comparison, we also calculate the trading variables from days +8 to +21, the period we argue as a normal period. We report the descriptive sta-tistics in Table 8. Initial observation seems to suggest a reversal pattern in the normal period for positive UMAs. Stocks with positive UMAs turn out to be fewer than those in the UMA peri-ods. For instance, with the
market-adjusted model, we have 35 stocks with positive CARs in the UMA peri-ods. In the normal period, stocks with positive CARs decrease into 12 stocks (suggesting that the rest have negative CARs in the normal period). Unfortu-nately, statistical power is weak. Only CARs with the risk-and-market-ad-justed model show significant results within 10 persent level. For negative UMAs, we observe a continuation pat-tern. The number of negative CARs in the normal period is almost at the same level as that in the UMA periods. Trading activities, as shown by trading volumes and frequency, decrease in the normal period. For example, daily trading volumes in the normal period
Continued from Table 7
B. Negative UMA Announcements
Mean Median Std Dev Min Max
Daily Return -0.272*** -0.3415 0.2384 -0.4735 0.3459 # of negative return 10
CAR -0.2369** -0.2768 0.2641 -0.5399 0.3915 (Market Adjusted)
# of negative CAR 9
CAR -0.0097 -0.0174 0.1234 -0.1778 0.2644
(Risk and Market Adj)
# of negative CAR 5
Trading Volume 30,712,960 4,594,150 5,424,4525 90,500 174,656,500
Trading Frequency 701 159 1,111 4 3,558
Trade Size 52,019 31,434 49,792 14,548 176,499
Price Range 12% 10 12 1.96 39
decrease almost half of those in the UMA periods (10 million shares versus 19 million shares for positive UMAs, and 22 million shares versus 30 million shares for negative UMAs). Price
range also decreases in the normal period compared to that in the UMA periods. The patterns for trading size and price are not clear.
Table 8. Descriptive Statistics for Returns, Abnormal Returns, and
Trading Variables on Normal Days
This table presents the descriptive statistics for Returns, Abnormal Returns, and Trading Variables on normal days (defined as days +8 to +21) after UMA Announcements. Market-adjusted abnormal return is calculated as return – market return. Risk-and-market-adjusted abnormal return is calculated as return minus expected return constructed from market model. Parameters in market model are estimated using data for one year leading to announcement day. Price range is calculated as follows: {(Daily Highest Price – Daily Lowest Price) / Average of Daily Highest and Lowest Price} x 100 persent. Daily trading size is calculated as daily trading volume divided by daily trading frequency. ***, **, and * mean significant at 1 persent, 5 persent, and 10 persent, respectively. Signifi-cance is reported only for return variables.
A. Positive UMA Announcements
Mean Median Std Dev Min Max
Daily Return -0.0194 -0.0348 0.2726 -0.7577 0.7542 # of positive return 15
CAR -0.0209 -0.0523 0.2857 -0.7246 0.7779
(Market Adjusted)
# of positive CAR 12 CAR
(Risk and Market Adj) -0.0231* -0.0164 0.0776 -0.2217 0.2163 # of positive CAR 10
Daily Trading Volume 10,816,505 1,876,750 18,303,776 0 61,763,000 Daily Trading Frequency 277 102 456 0 1,855 Daily Trade Size 29,884 15,085 29,243 500 101,000
Price Range (%) 6% 6 3 0 13
Regression Tests
We formally examine the differ-ences in returns and trading activities in the periods of pre-UMA, leading to UMA, and post-UMA announcements. Tables 9 and 10 report the results for both positive and negative UMA an-nouncements.
Table 9 shows that trading activi-ties increase significantly on the days leading to UMA announcements (day -5 to day -1). For example, for positive UMAs, market-adjusted abnormal re-turns on the days leading to UMA announcements are about 7.62 persent higher than those in the ‘normal’ period (days +8 to +50). Trading volumes and
frequency increase around 200 persent compared to those in the ‘normal’ pe-riod. Price range also increases by about 89 persent for the same period. On the days post-UMA announce-ments, the regression coefficients on abnormal returns show positive signs. For instance, the coefficient on a3 shows that market-adjusted abnormal returns from days 0 to +7 are around 0.97 persent higher than those in the ’normal’ period. Abnormal returns in the post-UMA announcement period tend to decrease relative to those in the leading-to-UMA-announcement pe-riod, but still at a higher level than those in the normal period. Trading volumes and frequency in the post-UMA
an-Continued from Table 8 B. Negative UMA Announcements
Mean Median Std Dev Min Max
Daily Return -0.3558** -0.2494 0.3942 -1.2411 0.1333 # of negative return 9
CAR -0.2056* -0.1689 0.3457 -1.0535 0.1932
(Market Adjusted)
# of negative CAR 8
CAR -0.0515* -0.0384 0.0834 -0.2450 0.0469 (Risk and Market Adj)
# of negative CAR 7
Trading Volume 22,409,128 995,803 47,887,753 1,017 154,644,786
Trading Frequency 379 52 551 1 1,234
Trade Size 37,454 21,842 38,771 5,250 136,644
Price Range 7% 6 5 0 19
nouncement period still exhibit high
levels, although they are lower than those on the days leading to UMAannouncements.
Table 9. Regression Results in the Pre-, Leading to, and Post-Positive UMA Announcement Periods
We report the regression results for the following model: Variables i,t = 0 + 1 Dummy1 + 2 Dummy2 + 3 Dummy3 + eit . Variables we are interested in are: Return, market adjusted CAR, risk and market adjusted CAR, Daily Trading Volume, Daily Trading Frequency, Daily Price Range, and Daily Trading Size. The definitions of the variables are as follows:
Daily Trading Volume i,t = Daily Trading Volume i,t / Average of Daily Trading Volume (i) from days -21 to +50; Daily Trading Frequency i,t =Daily Trading Frequency i,t / Average of Daily Trading Frequency (i) from days -21 to + 50; Price Range i,t = (Maximum price i,t – Minimum Price i,t)/ Average of Maximum Price i,t and Minimum Price i,t
Dummy1=1 for days -21 to -6, and zero otherwise; Dummy2=1 for days -5 to -1, and zero otherwise; Dummy3=1 for days 0 to +7, and zero otherwise. p-values are in parentheses
Abnormal Abnormal
Return Return Return Trading Trading Price Trade
(Market (Risk and Volume Frequency Range Size
Adjusted) Market Adj.)
0 -0.0033 -0.00049 -0.0012 0.799 0.8262 0.9146 27,923 (0.060) (0.775) (0.161) (0.0001) (0.0001) (0.0001) (0.0001) 1 0.0124 0.0111 0.0019 0.0564 0.0731 0.0571 1,927
(0.0001) (0.0003) (0.214) (0.618) (0.461) (0.253) (0.4273) 2 0.0836 0.0762 0.0285 2.1708 2.1887 0.8911 2,166
(0.0001) (0.0001) (0.0001) (0.0001) (0.0001) (0.0001) (0.543) 3 0.0104 0.0097 0.0035 1.4903 1.3137 0.6067 2,114
(0.009) (0.014) (0.085) (0.0001) (0.0001) (0.0001) (0.510) R2 0.108 0.093 0.054 0.0884 0.1037 0.0939 0.0005
Adj R2 0.107 0.092 0.053 0.0872 0.1025 0.0925 -0.001
F-value 100.16 84.56 46.40 77.61 92.59 70.54 0.34
N 2,477 2,477 2,456 2,405 2,405 2,046 2,564
For negative UMA announce-ments, as expected, we observe sig-nificant decreases in abnormal returns on the days leading to UMA announce-ments. For example, using the market-adjusted model, abnormal returns in
to be weak. Trading activities are also significantly higher on the days leading to UMA announcements, and continue to be so in the post-UMA
announce-Table 10.Regression Results in the Pre-, Leading to, and Post-Negative UMA Announcement Periods
We report the regression results for the following model: Variables i,t = 0 + 1 Dummy1 + 2 Dummy2 + 3 Dummy3
+ eit. Variables we are interested in are: Return, market adjusted CAR, risk and market adjusted CAR, Daily Trading Volume, Daily Trading Frequency, Daily Price Range, and Daily Trade Size. The definitions of the variables are as follows: Daily Trading Volume i,t = Daily Trading Volume i,t / Average of Daily Trading Volume (i) from days -21 to +50; Daily Trading Frequency i,t =Daily Trading Frequency i,t / Average of Daily Trading Frequency (i) from days -21 to + 50; Price Range i,t = (Maximum price i,t – Minimum Price i,t)/ Average of Maximum Price i,t and Minimum Price i,t
Dummy1=1 for days -21 to -6, and zero otherwise; Dummy2=1 for days -5 to -1, and zero otherwise; Dummy3=1 for days 0 to +7, and zero otherwise. p-values are in parentheses
Abnormal Abnormal
Return Return Trading Trading Price Trade
Return (Market (Risk and Volume Frequency Range Size
Adjusted) Market Adj.)
0 -0.0143 -0.0691 -0.0021 0.8637 0.7461 0.919 42,045 (0.0001) (0.047) (0.187) (0.0001) (0.0001) (0.0001) (0.0001) 1 -0.0055 -0.0108 -0.0033 -0.1745 0.1994 0.0701 -9,666
(0.410) (0.095) (0.255) (0.630) (0.489) (0.545) (0.190) 2 -0.0435 -0.0435 -0.00005 2.501 2.721 0.751 10,416 (0.0001) (0.0001) (0.991) (0.0001) (0.0001) (0.0001) (0.328) 3 0.0196 0.0122 0.0016 1.619 1.328 0.531 18,756 (0.019) (0.132) (0.653) (0.0004) (0.0003) (0.0001) (0.029) R2 0.108 0.093 0.054 0.0884 0.1037 0.0939 0.0005
Adj R2 0.107 0.092 0.053 0.0872 0.1025 0.0925 -0.001
F-value 100.16 84.56 46.40 77.61 92.59 70.54 0.34
N 2,477 2,477 2,456 2,405 2,405 2,046 2,564
Regression Results for Matched
Stocks
We perform equivalent regres-sion tests for matched stocks. As de-fined in the previous section, matched stocks are taken from the same in-dustries as of UMA stocks, have the closest size to UMA stocks, but do not experience UMA announcements.
Table 11 reports the regression results for matched stocks.
In general, matched stocks show weak regression results, indicating that there is not enough variation in the data on matched stocks. As expected, we do not observe clear patterns in the behavior of returns and trading activi-ties on the days around UMA
an-Table 11.Regression Results in the Pre-, Leading to, and Post-UMA Announcement Periods for Matched Stocks
We report the regression results for the following model: Variables i,t = a0 + a1 Dummy1 + a2 Dummy2 + a3 Dummy3 + eit . Variables we are interested in are: Return, market adjusted CAR, risk and market adjusted CAR, Daily Trading Volume, Daily Trading Frequency, Daily Price Range, and Daily Trade Size. The definitions of the variables are as follows:
Daily Trading Volume i,t = Daily Trading Volume i,t / Average of Daily Trading Volume (i) from days -21 to +50; Daily Trading Frequency i,t =Daily Trading Frequency i,t / Average of Daily Trading Frequency (i) from days -21 to + 50; Price Range i,t = (Maximum price i,t – Minimum Price i,t)/ Average of Maximum Price i,t and Minimum Price i,t
Dummy1=1 for days -21 to -6, and zero otherwise; Dummy2=1 for days -5 to -1, and zero otherwise; Dummy3=1 for days 0 to +7, and zero otherwise. p-values are in parentheses
Abnormal Abnormal
Return Return Trading Trading Price Trade
Return (Market (Risk and Volume Frequency Range Size
Adjusted) Market Adj.)
0 -0.0015 -0.00802 -0.0006 0.879 0.8604 0.962 49,725 (0.181) (0.0001) (0.209) (0.0001) (0.0001) (0.0001) (0.0001) 1 -0.0011 0.0028 -0.0008 -0.0256 0.0206 0.112 7,277
(0.571) (0.017) (0.362) (0.826) (0.843) (0.054) (0.376) 2 0.0034 0.0021 -0.00004 0.4096 0.369 0.022 1,734
(0.283) (0.275) (0.976) (0.026) (0.025) (0.813) (0.892) 3 0.00012 0.0023 -0.0006 0.4520 0.501 0.083 -605
(0.962) (0.146) (0.595) (0.263) (0.0002) (0.271) (0.954) R2 0.0006 0.0024 0.0005 0.005 0.0065 0.0022 0.0005
Adj R2 -0.0004 0.0013 -0.0006 0.004 0.0054 0.0006 -0.0011
F-value 2,805 2.25 0.48 4.89 5.86 1.39 0.29
nouncements. Abnormal returns and trading activities on the days leading to UMA announcements are not signifi-cantly different from those in the nor-mal period. Some coefficients are sig-nificant at 5 persent level, but we sus-pect that there is not any economic meaning. Given the large sample size used in the regressions, we should expect to obtain significant coefficients, although the economic meaning may not be relevant. This section concludes that UMA stocks show distinctive trad-ing characteristics from those for non-UMA stocks.
Do Abnormal Returns Drive
Unusual Market
Announcements?
One may argue that the announce-ments are driven more by surveillance variables used by the Exchange rather than by genuine manipulation variables. For instance, the Exchange may use price movement as a variable to scru-tinize a possible market manipulation. 3
If a stock experiences an unusual price movement, the stock will be picked by the Exchange. The Exchange then will issue an Unusual Market Activity an-nouncement for the stock. Our investi-gation may be biased since we base our analysis not on genuine manipulation variables, but more on variables used by the Exchange to choose the stocks. To investigate the possibility of such an endogeneity problem, we
cre-ate a portfolio that consists of stocks that have the highest values for sus-pected surveillance variables. Our in-tuition leads to two surveillance vari-ables used by the Exchange: (1) price movement and (2) trading volume. The Exchange will probably pick stocks that experience unusual price move-ments and/or unusual trading volumes. Specifically, we calculate the cumula-tive eight days of daily abnormal re-turns for stocks listed on the ISX (days -5 to 1), then we sort the stocks based on the cumulative abnormal returns. We exclude stocks already included in the sample. We then pick 50 stocks that experienced the highest five days of cumulative abnormal returns in 2008 (excluding stocks already included in the sample). We call this portfolio the abnormal-return-matched portfolio.
The five-day average of cumula-tive abnormal returns for the sample is around 38 persent (market adjusted). It turns out that such cumulative abnor-mal returns are not unusual on the Indonesian market. We observe that over 70 stocks experience the cumula-tive abnormal returns of higher than 38 persent (market adjusted). This result seems to suggest that the Exchange does not pick stocks for UMAs based solely on the abnormal returns. We then select 50 stocks with the highest market-adjusted cumulative abnormal returns over five days. The average abnormal returns for these stocks is 70 persent, with the minimum value of 48
3 The Exchange mentions specifically the price movements and the trading volumes in the
persent, the maximum value of 176 persent, and the standard deviation of 27 persent.
We directly jump to regression results equivalent to the analyses con-ducted on the sample. Table 12 reports the findings.
By construction, we expect to have significantly positive returns and
posi-tive abnormal returns on the days lead-ing to the “event date.” This is indeed the result observed from the table. Dummy2 shows significantly positive returns and abnormal returns. Dummy3 shows negative coefficients, although the statistical power seems to be low. Variables for trading activities, such as trading volume and trading frequency,
Table 12. Regression Results in the Pre-, Leading to, and Post-UMA
Announcement Periods for Abnormal-Return-Matched
Stocks
We report the regression results for the following model: Variables i,t = a0 + a1 Dummy1 + a2 Dummy2 + a3 Dummy3 + eit. Variables we are interested in are: Return, market adjusted CAR, risk and market adjusted CAR, Daily Trading Volume, Daily Trading Frequency, Daily Price Range, and Daily Trade Size. The definitions of the variables are as follows:
Daily Trading Volume i,t = Daily Trading Volume i,t / Average of Daily Trading Volume (i) from days -21 to +50; Daily Trading Frequency i,t =Daily Trading Frequency i,t / Average of Daily Trading Frequency (i) from days -21 to + 50; Price Range i,t = (Maximum price i,t – Minimum Price i,t)/ Average of Maximum Price i,t and Minimum Price i,t
Dummy1=1 for days -21 to -6, and zero otherwise; Dummy2=1 for days -5 to -1, and zero otherwise; Dummy3=1 for days 0 to +7, and zero otherwise. p-values are in parentheses
Abnormal Abnormal
Return Return Trading Trading Price Trade
Return (Market (Risk and Volume Frequency Range Size
Adjusted) Market Adj.)
0 -0.0016 -0.00044 -0.0029 0.6601 0.6509 0.8578 43,685 (0.284) (0.769) (0.317) (0.0001) (0.0001) (0.0001) (0.0001) 1 0.0139 0.0118 0.011 0.5125 0.5088 0.0855 -7,338
(0.0001) (0.0001) (0.070) (0.003) (0.0001) (0.1919) (0.211) 2 0.0935 0.0938 0.0207 2.6846 3.0387 0.9041 -15,810 (0.0001) (0.0001) (0.033) (0.0001) (0.0001) (0.0001) (0.061) 3 -0.0053 -0.0065 -0.0047 0.8532 0.7724 0.428 -6,330 (0.159) (0.082) (0.528) (0.0001) (0.0001) (0.0001) (0.378) R2 0.102 0.102 0.0024 0.0297 0.0604 0.0568 0.0026
Adj R2 0.101 0.101 0.0015 0.0288 0.0596 0.0552 0.0009
F-value 129.75 129.68 2.74** 34.98 73.57 35.47 1.54
show significant results, consistent with those for sample stocks. The magni-tudes of the coefficients are also com-parable to those of UMA stocks. The findings in this section suggest that UMA stocks and abnormal-return-matched portfolio share similarity in their trading characteristics. In the next section, we investigate the perfor-mances of sample stocks, matched stocks, and abnormal-return-matched stocks, and show that UMA stocks
show a distinctive pattern of price per-formance in the post-event period.
Performance of UMA Stocks in
the Post-Announcement Period
In this section, we examine the stock performance in the post-an-nouncement period. If stocks are ma-nipulated, such as driven up (or down) to a level unjustified by their fundamen-tals, then we expect to have price reversals in the post-announcement
Table 13. Performance in the Post-Announcement Period
This table reports the stock performances in the post-announcement period for stocks in positive UMAs, negative UMAs, matched stocks, and abnormal-return-matched stocks. Post-announcement period is defined as days 0 to +50. We run following regression model:
Excess Return i,t = 0 + 1 Market Excess Return t + 2 SMBt + 3HMLt + eit
Portfolios of small and big stocks are constructed by sorting stocks listed on the Indonesian Stock Exchange. We divide the stocks into three groups based on size: small, middle, and big. We then delete the middle-sized group. Portfolios of high and low book to market value are constructed in a similar way. We use30-day Sertifikat Bank Indonesia (securities issued by the Indonesian Central Bank) as the risk-free asset. Jakarta Composite Index is used as the proxy for market return. P-values are in parentheses.
Positive UM Negative UMA Matched Stocks Abnormal Return
Matched Stocks 0 -0.0009 -0.0016 -0.0051 -0.0052 -0.0026 -0.0029 -0.0049 -0.0051
(0.5011) (0.2892) (0.1973) (0.2068) (0.0095) (0.0049) (0.0001) (0.0001) 1 0.5742 0.5267 1.1409 1.1180 0.6774 0.6438 0.4214 0.4003
(0.0001) (0.0001) (0.0001) (0.0001) (0.0001) (0.0001) (0.0001) (0.0001)
2 -0.1776 -0.1109 -0.0979 -0.0979
(0.2211) (0.7651) (0.3125) (0.4255)
3 0.5379 0.4336 0.1993 0.2402
(0.0001) (0,2432) (0.0277) (0.0532) R2 0.0279 0 .0367 0.1545 0.1584 0.0877 0.0899 0.0219 0.0234
Adj R2 0.0274 0.0352 0.1520 0.1510 0.0872 0.0885 0.0215 0.0222
F-value 55*** 24*** 63*** 21*** 191*** 66*** 57*** 20***
period. If UMA announcements re-flect noisy manipulations, then we will expect to have negative abnormal re-turns for positive UMA stocks and positive abnormal returns for negative UMA stocks in the post-announce-ment period. Alternatively, if UMA announcements reflect relevant infor-mation, then we expect to have no reversal in the post-announcement pe-riod. Table 13 reports the regression results using Fama and French’s three-factor model (1996).
Regression results show that the intercepts of Fama-French’s three-fac-tor model for UMA stocks are nega-tive, but statistically insignificant. There is no price reversal for UMA stocks. Results for matched stocks and abnor-mal-return-matched stocks clearly show a different direction. There is a rever-sal pattern for these stocks in the post-UMA announcement period. These results imply that UMA announce-ments contain relevant information. Unusual Market Activities do not seem to be noisy manipulations. As in Jian et al. (2005), who report the price con-tinuation in the post-stock-pool-forma-tion period, it seems that UMA stocks convey relevant information, which is likely to be the “insider type” of infor-mation. This pattern creates difficul-ties in disentangling costs and benefits associated with price manipulation. On one hand, price manipulation helps im-prove market efficiency, but on the
other hand, price manipulation is unfair to other investors and reduces liquidity.
Conclusion
References
Aggarwal, R. K., and G. Wu. 2006. Stock market manipulations, Journal of Business 79 (4): 1915-1953. The University of Chicago.
Allen, F., and D. Gale. 1992. Stock-price manipulation. The Review of Financial Studies 5 (3): 503-529.
Banz, R. W. 1981. The relationship between return and market value of common stock.
Journal of Financial Economics 9 (1) (March): 3-18.
Barclays, M., and B. W. Jerold. 1993. Stealth trading and volatility: Which trades move prices. Journal of Financial Economics 34 (3) (December): 281-305.
Camerer, C. 1998. Can asset markets be manipulated? A field experiment with racetrack betting. Journal of Political Economy 106 (3) (June): 457-482.
Fama, E. F., and R. F. Kenneth. 1996. Multifactor explanation of asset pricing anomalies.
Journal of Finance 51 (March): 55-84.
Cheuk, M-Y., K. F. Dennis, and W. S. Raymond. 2006. Insider trading in Hong Kong: Some stylized facts. Pacific-Basin Finance Journal 14 (1): 73-90.
Jarrow, R. 1992. Market manipulation, bubbles, corners and short squeezes. Journal of Financial and Quantitative Analysis 27 (3) (September): 311-336.
Jiang, G., P. G. Mahoney, and J. Mei. 2005. Market manipulation: A comprehensive study of stock pools. Journal of Financial Economics 77 (1) (July): 147-170.
Khwaja, A. I., and A. Mian. 2005. Unchecked intermediaries: Price manipulation in an emerging stock market. Journal of Financial Economics 78 (1) (October: 203-241. Mahoney, P. 1999. The stock pools and the securities exchange act. Journal of Financial
Economics 51: 343-369.
Maug, E., 2002. Insider trading legislation and corporate governance. European Economic Review 46 (9) (October): 1569-1597.
May, J., J. Scheinkman, J., and W. Xiong. 2003. Speculative trading and stock prices: an analysis of Chinese A-B share premia. Unpublished working paper. Princeton University.
APPENDIX 1. Trading Volume in the Event Days for the Sample
This figure shows the daily trading volumes for sample stocks (samp) and for matched stocks (cont) around UMA announcements.
-21 -19 -17 -15 -13 -11 -9 -7 -5 -3 -1 1 3 5 7 9 11 13 15 17 19 21 5000000
0 10000000 15000000 20000000 25000000 30000000 35000000
mVOLTUP cont mVOLTUP samp
APPENDIX 2. Trading Frequency in the Event Days for the Sample
This figure shows the daily trading frequency for sample stocks (samp) and for matched stocks (cont) around UMA announcements.
-21 -19 -17 -15 -13 -11 -9 -7 -5 -3 -1 1 3 5 7 9 11 13 15 17 19 21 100
0 200 300 400 500 600 700 800 900
APPENDIX 3. Daily Price Range in the Event Days for the Sample
This figure shows the daily price range for sample stocks (samp) and for matched stocks (cont) around UMA announcements. Price range is calculated as follows: {(Daily Highest Price – Daily Lowest Price) / Average of Daily Highest and Lowest Price} x 100 persent.
0
mrangehgcon mrangehg
-21 -19 -17 -15 -13 -11 -9 -7 -5 -3 -1 1 3 5 7 9 11 13 15 17 19 21 2
4 6 8 10 12 14 16
APPENDIX 4. Daily Trading Size in the Event Days for the Sample
This figure shows the daily trading size for sample stocks (samp) and for matched stocks (cont) around UMA announcements. Daily trading size is calculated as daily trading volume divided by daily trading frequency.
00
-21 -19 -17 -15 -13 -11 -9 -7 -5 -3 -1 1 3 5 7 9 11 13 15 17 19 21 10000
20000 30000 40000 50000 60000 70000 80000 90000