Full Terms & Conditions of access and use can be found at
http://www.tandfonline.com/action/journalInformation?journalCode=cbie20
Download by: [Universitas Maritim Raja Ali Haji] Date: 19 January 2016, At: 19:42
ISSN: 0007-4918 (Print) 1472-7234 (Online) Journal homepage: http://www.tandfonline.com/loi/cbie20
Productivity gains, technology spillovers and trade:
Indonesian manufacturing, 1980-96
Jojo Jacob & Christoph Meister
To cite this article: Jojo Jacob & Christoph Meister (2005) Productivity gains, technology
spillovers and trade: Indonesian manufacturing, 1980-96, Bulletin of Indonesian Economic Studies, 41:1, 37-56, DOI: 10.1080/00074910500072674
To link to this article: http://dx.doi.org/10.1080/00074910500072674
Published online: 19 Oct 2010.
Submit your article to this journal
Article views: 105
View related articles
ISSN 0007-4918 print/ISSN 1472-7234 online/05/010037-20 © 2005 Indonesia Project ANU DOI: 10.1080/00074910500072674
a*We thank Colin Webb, Agnès Cimper (OECD), Marcel Timmer (Groningen Growth and
Development Centre), Haryo Aswicahyono (Centre for Strategic and international Studies, Jakarta), Yahya Jammal (Boston Institute for Developing Economies) and Sadayuki Takii (International Centre for the Study of East Asian Development, Kitakyushu) for provision of and advice on data. We are grateful to Bart Los, Bart Verspagen and Eddy Szirmai for encouragement and discussion, to participants at the conference on ‘The Empirical Impli-cations of Technology-Based Growth Theories’, SOM (Systems, Organisation and Manage-ment Research School), University of Groningen, August 2002, and to two anonymous referees for comments and suggestions. Financial support from the Netherlands Organisa-tion for Scientific Research (NWO) is acknowledged.
1For examples see Hill (1996) and Simatupang (1996).
PRODUCTIVITY GAINS, TECHNOLOGY SPILLOVERS AND
TRADE: INDONESIAN MANUFACTURING, 1980–96
Jojo Jacob and Christoph Meistera*
Eindhoven Centre for Innovation Studies, Eindhoven University of Technology
The importance of R&D spillovers for productivity growth has been well docu-mented in the literature. While studies in the developed country context have focused extensively on sectoral linkages, research on North–South spillovers has largely been confined to the aggregate level. This paper assesses the contribution of international R&D spillovers to manufacturing performance in Indonesia at the sectoral level. Drawing on OECD and Indonesian data sources, we consider two distinct phases: a phase characterised by intense policy regulation (1980–87), fol-lowed by a phase of liberalisation and reform (1988–96). Our results indicate that international technology spillovers made a significant contribution to the perform-ance of Indonesian manufacturing, especially after liberalisation. The contribution of technology spillovers to productivity change is influenced by sectoral character-istics and industrial market structure.
INTRODUCTION AND OVERVIEW
Indonesia is often described as an East Asian success story—a story of trans-formation from a stagnant economy dominated by the primary sector to one where manufacturing plays a leading role, both domestically and in export mar-kets. Real per capita income in 1985 dollars adjusted to purchasing power parity increased more than fourfold between 1960 and 1996, to reach $2,765 (Fane 1999). However, this rapid economic growth came about under policy regimes fluctuat-ing between protection and openness. There is a consensus among Indonesia scholars that the country’s economic policies from the late sixties under the New Order regime of former President Soeharto were dictated mainly by movements in oil prices and the resulting booms and busts in oil revenues.1Beginning in
1966, faced with a substantial pile of foreign debt, the government scaled down
2Technology contracts between domestic and foreign firms are an important channel of North–South technology diffusion. Data on these contracts are not available for Indonesia, however.
3Spillovers are ‘leakages’ of a firm’s or industry’s R&D efforts to one or more other firms or industries. They may result from economic transactions such as trade, from the presence of foreign firms in the local industry (FDI), or from access to technical and trade journals, for example. See the next section for a discussion on the two types of technology spillovers.
4Hill (1996) provides a detailed account of Indonesia’s industrial technology landscape.
tariff and non-tariff barriers (NTBs) and introduced a new investment law to attract foreign investors. The first oil shock of 1972–73 triggered a reversal of these policies. A targeted industrialisation program ensued that envisioned the emergence of a strong domestic manufacturing sector with a dominant segment of medium- and high-technology industries. This phase was characterised by restrictions on the operations of multinational companies and high levels of tar-iffs and NTBs. The steep reduction in revenues from oil during 1983–86 led to a once-and-for-all liberalisation of the economy. From then on, tariffs and NTBs on manufacturing imports began to be steadily removed.
Growth of the manufacturing sector was the key feature of overall growth dur-ing both the regulated and liberalised phases. By 1998, the sector’s share had risen, in current prices, to 27% of GDP from a mere 8% in 1960. This rapid growth was the result not merely of increases in factor utilisation but also of substantial rises in productivity (Aswicahyono 1998; Timmer 2000).
While substantial progress on the productivity front is common knowledge, the factors underlying it are far from clearly understood. Available evidence points to exceedingly low levels of domestic private sector R&D activity, and lim-ited cooperation between public R&D institutions (which account for the bulk of domestic R&D) and the private sector (Lall 1998). R&D expenditure in Indone-sian industries during 1993, for example, was a meagre 0.04% of GDP, compared with 2% in Korea and 0.22% in the non-‘tiger’ India. This underlines the impor-tance of external sources of technology transfer such as foreign direct investment (FDI) and imported (technology-embodied) inputs.2
Empirical evidence shows the not so surprising result that foreign firms have higher productivity than domestically owned firms (Takii and Ramstetter 2003). However, on the question of technology spillovers3from foreign investment,
evi-dence is mixed. While econometric investigations demonstrate their presence, albeit with varying levels of impact at different degrees of foreign ownership (Sjöholm 1999), case studies by Hill (1988) and Thee (1991) fail to find any strong evidence for such spillovers.4A point to note, in this context, is that firm-level
studies of the former kind do not distinguish between policy regimes and sectoral classes (i.e. they use data on a single year or on the beginning year and end year, instead of panel data).
Another important source of foreign technology transfer is the import of technology-embodied inputs from advanced country industries. Their impor-tance derives from one basic feature of Indonesia’s industrialisation: the wide-spread adoption of capital-intensive techniques facilitated by an incentive structure that ‘got prices wrong’, with a mix of high wages and low interest
5For a detailed explanation of the two forms of spillovers, see the following section. 6We do not include the period before 1980 because of the poor quality of the Indonesian data for these years. In order to avoid the distortions that resulted from the crisis of the late 1990s, we also exclude the years after 1996.
7We assume that knowledge spillovers from imported inputs have only limited relevance as a technology transmission mechanism in Indonesia, given the lack of complementary technological and human capabilities (Hill 1995; Lall 1998). Thee (2003) also rules out the possibility of reverse engineering by Indonesian firms.
rates (Hill 1996). Given the absence of a domestic capital goods sector, Indone-sian manufacturing relied heavily on imported capital and intermediate inputs (Thee 2003). Although imports are well recognised as important for technology transfer, their role in manufacturing productivity growth has not been system-atically studied.
It is therefore important to examine all these channels of technology transfer in a single framework, taking into consideration specific features of sectors (e.g. dif-fering technological intensities) and policy regimes.
In considering the contribution of foreign technology, a moot question is whether domestic productivity gains generated by imports are caused by addi-tions to the domestic knowledge stock. If they are, we define the effect on produc-tivity as knowledge spillover; if they are not, we define it as rent spillover (drawing on Griliches 1979). Rent spillovers arise if producers are unable to charge a price that fully accounts for the product innovations embodied in their output. They occur under competitive market conditions that result from the close substitutability of only slightly differentiated goods in the product market or from short product cycles that allow fast incremental innovation as well as fast imitation. Such price–quality disparities cause a partial transfer of innovation rent from the producer to the user that is manifested in an increase in the produc-tivity of the user. Knowledge spillovers, on the other hand, result from the pub-lic good character of technology.5They can emanate from a number of sources,
including trade, imported capital goods (reverse engineering), interactions with foreign firms in the local market, and technical journals. Rent and knowledge spillovers are facilitated to a large extent by market structure in the buyers’ and sellers’ markets, and therefore by policies governing markets. For a firm to bene-fit from knowledge spillovers, some degree of absorptive capacity is a pre-requisite—similar in spirit to the Abramovitzian notion of social capability (Abramovitz 1986).
Using a panel data set for a relatively long period of time, from 1980 to 1996,6
we examine the contribution of rent spillovers from imported inputs and knowl-edge spillovers from FDI to Indonesian manufacturing labour productivity.7The
paper focuses in particular on the impact of the shift in policy regime—from import substituting to export promoting—on the factors contributing to produc-tivity.
While rent spillovers should, in theory, play only a subdued role in a more competitive market environment, our results point to the contrary. Although this appears counter-intuitive on the surface, we relate this result to the export-promoting policies initiated from the late 1980s onwards—in particular to the duty exemptions and duty drawback schemes introduced in 1986. The study also
8A detailed discussion of endogenous technological change in growth theories can be found in Schneider and Ziesemer (1995), for example.
finds that domestic market concentration was important in facilitating rent spillovers. The contribution of FDI spillover, however, is found to be insignificant in both policy regimes. Among the different technology classes, high, medium and low, the latter two benefited the most from rent spillovers.
In the following section we discuss the conceptual and empirical issues con-nected with rent and knowledge spillovers and, drawing mainly on the empiri-cal literature, the relationship between market structure and spillovers. The section ends with a comparison of manufacturing concentration in Indonesia between the pre- and post-liberalisation phases. In the third section we derive the international R&D stock as a means of capturing rent spillovers, and elaborate on the empirical model. The Indonesian and OECD data sets used and adjustments made to them are discussed in the fourth section. In the fifth, we consider the sample and estimation issues. The estimation results are summed up in the fol-lowing section, and we then present our conclusions.
SPILLOVER AS A SOURCE OF GROWTH
Knowledge-induced growth has become one of the focal points of research in eco-nomics with the emergence of what came to be known as the ‘new’ growth theo-ries, which have dominated discussion on growth and convergence across countries in the last two decades.8This period also saw renewed interest in the
issue of catch-up and convergence in developing countries, with empirical evi-dence pointing only to conditional or ‘club’ convergence—convergence of the per capita income of countries with similar initial conditions—in contrast with the predictions of the neoclassical growth model (see, for example, De Long 1988). Given that growth is influenced substantially by technological progress, and given the limited resources at the disposal of developing countries for investment in R&D and human capital, attention has shifted to the ways in which less developed countries can benefit from technologies available elsewhere. The fact that 85% of industrial R&D emanates from OECD countries provides an indication of the huge potential for developing countries to gain technologically from closer interaction with these technology leaders. In this context, the focus has been mainly on treat-ing trade as a conduit of technology flow from advanced to less advanced coun-tries (Grossman and Helpman 1991; Rivera-Batiz and Romer 1991).
The pioneering research of Coe and Helpman (1995) suggested the importance of international R&D spillovers through trade for productivity growth among the OECD countries. This has been followed by a plethora of studies investigating the different facets of international technology spillovers, including those considering intersectoral spillover (Verspagen 1997). However, research has been scanty on the extent of spillovers from advanced to developing countries at the sectoral level.
Definition and Measurement of Spillovers
From a theoretical point of view, a formal notion of spillover can be deduced from the endogenous growth model of Romer (1987). The output of a country is seen
9This can be by such means as reverse engineering, the exploitation of knowledge from academic and trade journals, turnover of researchers, and licensing. Even though licens-ing is an economic activity, it can generate knowledge externalities if the borrower builds on the licensed technology to generate technologies that are new to it.
as a function not only of capital and labour but also of a range of differentiated intermediate inputs. In its simplest form this results in the augmented Cobb–Douglas production function
(1)
with Yi as output in country i, Ai as a country-specific constant, Ki and Li as, respectively, capital and labour services, Nias an index of the range of differenti-ated intermediates employed, and α, β and ζ as elasticities.
Taking equation (1) as the starting point, empirical investigations have either estimated the production function directly (in the manner of Griliches and Mairesse 1984) or tried to establish the contribution of the corresponding factors of production to the growth of total factor productivity (TFP) (for a review of this research see, for example, Cameron 1996). While the latter approach imposes a
priori the usual TFP assumptions of constant returns to scale and perfect
compe-tition, the former allows a higher degree of flexibility in this respect.
A major conceptual issue, common to both approaches, is the construction of the ‘spillover index’ to proxy N, which bears important consequences for any interpretation of corresponding results. While it is common practice to employ a measure of aggregated R&D stock in the emitting country to operationalise the ‘spillover potential’, the modelling of spillover transmission, i.e. the link between emitting and receiving country, and of spillover absorption on the receiving side, needs some a priori clarification. It was in this context that Griliches (1979, 1992) made the distinction between knowledge and rent spillovers.
Knowledge Spillover. Technology exhibits certain public good characteristics,
which enable industries that are technologically close enough to each other to ben-efit from their respective research efforts without the need to engage in economic transactions.9Knowledge spillovers are thus ‘true’ externalities in the sense of
Griliches (1979). In order to capture the degree of technological closeness, attempts have been made to devise measures of technological distance to use as a weight for the construction of the potential spillover stock. Such measures are derived, for example, from the type of R&D performed (Goto and Suzuki 1989), the qualifications of researchers (Adams 1990), the distribution of patents between patent classes (Jaffe 1986), or patent classifications and citations (Verspa-gen 1997).
The notion of knowledge spillovers can be integrated with the arguments of the ‘technology gap’ literature. The latter highlights the immense opportunities for catch-up by developing countries through technology diffusion, owing to their initial backwardness (Abramovitz 1986; Fagerberg 1987). When imported inputs with high technology embodiment are used domestically, this adds to the knowledge base of domestic firms through learning by using, an important form of knowledge spillover (Rosenberg 1982). Indeed it has been pointed out that much of the growth in East Asia, especially in South Korea, lay not so much in the
Yi=A K L Ni iα βi iς
10Fagerberg and Verspagen (2000) illustrate why econometric attempts to measure spillovers, until the work of Coe and Helpman (1995), failed to capture the presence of international spillovers. They show that international spillovers have been found to exist by studies that used panel data estimations with country-specific dummies. The bottom line, as they point out, is that the countries that possess high levels of absorptive capacity benefit technologically from their ‘backwardness’, while those with low levels do not.
intensive application of imported high-technology inputs as in the deliberate, yet arduous, efforts made at plant level in learning from these inputs, through reverse engineering, for example (Hikino and Amsden 1994). Furthermore, inter-national trade creates contacts and learning through interactions with foreign producers and users. Another major source of North–South knowledge spillover is FDI. A standard approach to capturing spillovers from FDI in a sector is to measure the share of foreign-controlled enterprises in the total output of that sec-tor (see, for example, Sjöholm 1999).
Research in this tradition also emphasises the importance of certain pre-requisites, such as the initial levels of human capital, technological capability and technological congruence, for successful catching up in the receiving country. Recent econometric evidence underscores these arguments.10
Rent Spillover. Rent spillovers, on the other hand, are not ‘true’ externalities
but rather a shift of innovation rents from the producer to the user of a certain technology. Such shifts occur if, as a result of competitive market pressures, product prices do not increase in line with quality improvements, as in the case of information and communication technology. Of course, if we take a bird’s eye view of a whole economy, rent spillovers can be seen as equivalent to a measure-ment error in which productivity increases are attributed to the wrong sector. Yet from the viewpoint of an individual firm, industry or country, such productivity increases are real and indeed constitute a spillover effect. Conceptually, the transmission and absorption of rent spillovers is tied to market transactions and, as a consequence, modelling and estimation must rely on some measure of user–producer relationships. Thus, weights for aggregation can be derived from inter-industry sales (Terleckyj 1982), from ‘innovation-using/producing’ matri-ces (Scherer 1982; Putnam and Evenson 1994) or from a standard input–output framework (Papaconstantinou et al. 1996).
Needless to say, rent spillovers render only a one-off improvement in produc-tivity, with no guarantee of continuity. However, knowledge spillovers perma-nently alter the productive potential of the receiving entity, and therefore are far more important from the viewpoint of long-term growth in a developing econ-omy. In this context, the role that government policies play is of vital importance in influencing a nation’s gains from spillovers. Still, government can facilitate not only knowledge spillovers through the creation of absorptive capacity, but also rent spillovers through regulatory policies that influence the openness and the competitive environment of the domestic market.
Market Environment, Policies and Spillovers
In the endogenous growth literature, competitive market conditions are pre-supposed for the creation of technology (knowledge) spillovers. However, this liter-ature, owing to its macro focus, does not distinguish differences in the degrees of
competition in the supplying and receiving sectors, and their implications for the creation of different types of spillovers.
In the empirical literature, the role of market structures has been assessed mainly with respect to spillovers from FDI (knowledge spillovers) and from inter-industry transactions in high-technology inputs (rent spillovers). These two sets of literature differ crucially in whether they focus on the market structure of the source or the receiving entity.
For FDI spillovers, competition in the domestic market (the receivingsectors) has been identified as a key prerequisite (Wang and Blomström 1992; Sjöholm 1999); both studies find that domestic competition facilitates technology spillover from multinational corporations (MNCs) and MNC subsidiaries to local firms.
On the other hand, studies exploring the transfer of rent spillovers from the supplier to the user of an input lay emphasis on the degree of competition in the
supplying industries. Triplett (1996) illustrates how highly competitive market
conditions in the semi-conductor industry led to the transfer of its productivity gains to the computer industry. However, no attempt has been made so far in the rent spillover literature to assess the importance of the purchasingsector’s market structure. Rent spillovers from the purchase or import of inputs are likely to be greater when the market structure of the receiving country or sector is less com-petitive. The reason for this is that higher market power gives firms greater bar-gaining power vis-à-visthose with lower market power.
In our empirical model we use the Herfindahl index as a measure of market structure. Using this index, we briefly explore the pattern of concentration in Indonesian manufacturing during the pre- and post-liberalisation regimes.
The Pattern of Concentration in Indonesian Manufacturing
In Indonesia, despite deregulation of the trade regime and greater import compe-tition, price and non-price regulations continued to stifle domestic competition and trade until the economic crisis of 1997–98 (Thee 2002). Conventional meas-ures of concentration such as the Herfindahl index do not take into account such regulations and therefore might not fully capture the true extent of competition in the market. However, this index remains a useful tool for intertemporal com-parisons of industries, and reveals sectoral differences between the pre- and post-liberalisation phases in Indonesia.
The standard way of deriving the Herfindahl index is by squaring the market share of all firms in the industry. Squaring results in firms with higher market share being given greater weight than those with a lower share. Since the num-ber of firms varies over time and across industries, it is more appropriate to employ the so-called normalised Herfindahl index (H)
where nis the number of plants and , with sibeing the market share of the
ithplant. Clearly, a higher value of Hindicates a more concentrated market
envi-ronment than does a lower value.
To construct our concentration measure for Indonesia, we use ‘backcast’ data from the central statistics agency (BPS) rather than the agency’s annual manu-facturing survey data, Statistik Industri (SI). The backcast data set is based on
S=∑isi
FIGURE 1 Average Levels of Concentration in the Pre- and Post-Liberalisation Phasesa
anec = not elsewhere classified.
11We note that any measure of concentration as calculated from plant level data under-states the true concentration. This is because it ignores the fact that many of Indonesia’s large conglomerates have vast holdings across many industries, so that nominally distinct firms may be owned by the same group (Hill 1996).
re-surveys to account for newly discovered plants not reported in SI, and there-fore offers greater coverage of plants than SI, especially prior to 1985 (for more details, see the subsection on the Indonesian data below). We compare the aver-age levels of concentration in the pre-liberalisation (1980–87) and post-liberali-sation (1988–96) phases. The cut-off year 1987 has been chosen to accommodate the lags with which policies take effect. The annual average Herfindahl indices for 19 manufacturing sectors for the two subperiods are presented in figure 1.11 Sectors have been arranged from left to right in ascending order according to the index values for the post-liberalisation phase.
12We do not report the changes in the number of plants, owing to space constraints. 13We do not consider domestic R&D, because data are not available for all the years cov-ered by the study. This omission does not appear to prejudice the results, because of the small degree of domestic R&D, and because most R&D spending in Indonesia is under-taken by public research laboratories, mainly for product certification, training and testing (Thee 1998).
14We are aware of the critique by Keller (1998) of the usefulness of trade weights. How-ever, the results of Coe and Hoffmaister (1999) suggest that technological spillovers are greater when a country trades with another that is technologically more advanced.
The chart shows a mixed pattern of increases and decreases in the level of con-centration in the post-liberalisation phase—the former in spite of a rapid rise in the number of firms during this phase. In the immediate aftermath of reforms, domestic firms, which were better positioned than foreign firms to exploit the new opportunities created by liberalisation in the late 1980s, made their entry in a big way. During the 1990s, however, foreign firms, especially those from the newly industrialising economies, dominated entry.12
It is well known that government policies differed across industries. This may explain why inter-industry variation in the degree of concentration showed an increase after the reforms (as evidenced by a higher standard deviation in the sec-toral concentration levels in the post-liberalisation phase).
THE MODEL
Again, we start from an augmented Cobb–Douglas production function as in equation (1):
(2)
where Yirepresents the output of sector i, Kand L represent capital and labour inputs, respectively, and IRDirepresents the international R&D stock available in sector i.13 The theoretical model assumes that the production function exhibits
constant returns to scale in capital and labour and increasing returns when inter-national R&D is introduced into the model. However, we let the econometric esti-mation decide whether the returns to scale are constant or otherwise. Dividing all terms by Land taking logarithms, equation (2) becomes
(3)
where ηrepresents the returns-to-scale parameter equal to α+ β − 1. It measures the departure from constant returns to scale (α+ β= 1) in capital and labour.
The international R&D stock is derived in two steps. First, we weight sectoral R&D intensity in the exporting advanced country by its exports to Indonesia.14
Second, this figure is weighted by the share of the receiving Indonesian sector in the total imports from each of the supplying sectors (using transaction flow matrices of imported intermediate inputs for Indonesia). The international R&D stock in sector jis defined as follows:
yi−li=ai+α(ki−li)+ηli+ςirdi Yi=A K L IRDi iα βi iς
15We define foreign-controlled plants as those with a foreign ownership of 10% or more. This is based on the International Monetary Fund (IMF) view that ownership of at least 10% implies that the direct investor is able to influence, or participate in, the management of an enterprise. Absolute control by the foreign investor is not required.
(4)
where RDciis the ratio of the R&D stock to the output of sector iin partner coun-try c, Eciare exports to Indonesia of country c, and Wijis an inter-industry distri-bution weight.
The sectoral R&D stocks for each partner country are derived by the perpetual inventory method (with the benchmark year taken as 1973). We follow the approach used by Lichtenberg and Van Pottelsberghe de la Potterie (1998) to derive the export-weighted R&D intensity (RDciEci in the above equation). By doing this we capture the total R&D embodied in imports from sector iof each partner country.
To capture inter-industry flows within the Indonesian economy we calculate a weighting matrix by dividing each cell of the imported intermediate input trans-action matrix for Indonesia by its row sum
where mijis total imports to Indonesian sector jfrom foreign sector i. Since this measure captures inter-industry relations in the ‘user–producer’ sense noted ear-lier, the R&D stock derived using it is expected to reflect rentspillovers. At the same time, an economic transaction such as importing can generate knowledge spillovers as well, emanating from contacts with foreign markets, reverse engi-neering and so on. Given that we use intermediate inputs alone (as opposed to capital goods) to capture the inter-industry flow of international spillovers, the scope for reverse engineering is evidently less significant.
We now expand equation (3) to include other key variables that influence labour productivity:
(5)
where the term ird.h represents an interaction term between the rent spillover variable and the normalised Herfindahl index defined above. This variable cap-tures the conditioning effect of concentration on rent spillovers. The conditional causal effect of rent spillovers on labour productivity can now be written as
ς + ρ(h). We expect a positive relationship between concentration and rent spillovers.
The variable fin the equation is the average output share of foreign-controlled plants in industry i.15This variable acts as a proxy to capture the contribution of
knowledge spillovers from MNCs to their subsidiaries and local firms. We have discussed the empirical finding that domestic competition contributes to the gen-eration of spillovers from foreign investment. We do not incorporate the
condi-yi−li=ai+α(ki−li)+ηli+ςirdi+ρ(ird h. )i+δfi+γT+ωd
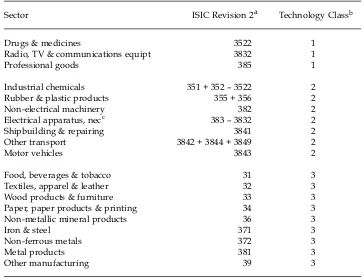
TABLE 1 Sectoral Classification
Sector ISIC Revision 2a Technology Classb
Drugs & medicines 3522 1
Radio, TV & communications equipt 3832 1
Professional goods 385 1
Industrial chemicals 351 + 352 – 3522 2
Rubber & plastic products 355 + 356 2
Non-electrical machinery 382 2
Electrical apparatus, necc 383 – 3832 2
Shipbuilding & repairing 3841 2
Other transport 3842 + 3844 + 3849 2
Motor vehicles 3843 2
Food, beverages & tobacco 31 3
Textiles, apparel & leather 32 3
Wood products & furniture 33 3
Paper, paper products & printing 34 3
Non-metallic mineral products 36 3
Iron & steel 371 3
Non-ferrous metals 372 3
Metal products 381 3
Other manufacturing 39 3
aInternational Standard Industrial Classification, revision 2 (1968).
b1 = high-technology sector; 2 = medium-technology sector; 3 = low-technology sector.
cnec = not elsewhere classified.
16These countries are Australia, Canada, Denmark, France, Germany, the UK, Italy, Japan, the Netherlands and the USA.
tioning effect of market structure on FDI spillover, however, because of the very high collinearity between the spillover variable and its interaction with the mar-ket structure.
The variable Tis a time trend that captures the effect of exogenous factors on productivity change. Finally, dis a dummy variable that reflects the effect of lib-eralisation measures on the intercept term of the regression equation.
DATA AND VARIABLES
Our study combines Indonesian data sets on production and input–output trans-actions with the R&D, export-to-Indonesia and output data of 10 major OECD countries that trade with Indonesia.16Table 1 shows the 19 sectors used in the study. The final column shows the technology class to which each sector belongs. The following paragraphs explain some key aspects of the Indonesian and OECD data sets.
17We followed this two-step merging procedure rather than stage two alone because the plant identification codes are not completely accurate.
18The two plant-level data sets are beset with flaws such as duplicate observations, and even duplicate plant-identification codes. Most of these result from the BPS practice of accounting for the missing data of plants that do not report data for some years by using the data of plants with similar characteristics. We removed observations with the same variable values for output, value added and labour.
19Aswicahyono (1998) and Timmer (2000) follow the same approach. The Indonesian Data
We use the BPS plant-level data sets, SI and backcast data to build all variables other than the spillover stock. While the backcast data cover a larger sample of plants, especially before 1985, they provide information on only a few variables such as gross value added, employment and output (see Jammal 1993 for details on the backcast data). We therefore combined the backcast data with the SI data in order to make use of the variables reported in the latter but not in the former. This allowed us to include data on investment and foreign ownership. First we merged plants for which the two data sets show equal output, value added and labour. Second, observations that did not match in the first stage were merged using plant-identification codes.17 Finally, the non-matched backcast
observa-tions, which represented newly discovered plants, were added to the matched data set. In this way we eliminated erroneous observations from the SI data.18
The Capital Stock Series
One of the serious problems with the data, and especially with the investment series, is the large number of missing values. To generate investment series for all plants, we compared, for each year, the average value added–investment ratio at the five-digit industry level in the International Standard Industrial Classification (ISIC) with the value added data of the plants for which investment data are miss-ing. This exercise was undertaken for four types of investment series—building, machinery, transport equipment and ‘other assets’. For 1996, no investment data are available (although the database contains estimated total gross capital stock data, they were not used owing to comparability problems). We generated invest-ment series for this year by comparing the increinvest-mental capital–value added ratio (ICVAR) for 1995 with the change in gross value added between 1995 and 1996.
We converted the investment series into constant 1990 prices using three types of price indices contained in the Indikator Ekonomiseries published by BPS: a price index of non-residential and residential building to deflate investment in build-ing; a price index of imported machinery for machinery and equipment; and a price index of imported transport equipment for vehicles and for other invest-ment.19The deflated series were divided by the purchasing power parity for 1990
(for comparability with the OECD data used). We then constructed a new capital stock series for the Indonesian manufacturing sectors (classified according to ISIC revision 2) from 1975 to 1999. To derive benchmark capital stock data we used the ratio of the average investment–value added change (ICVAR) for 1976–80 (Das-gupta et al.1995; Osada 1994; Timmer 2000). This ratio was then multiplied by the gross value added for 1975 to derive the benchmark capital stock for 1975. Based
20The calculated F-statistic is highest when the cut-off year is 1987 rather than 1985, 1986 or 1988.
on this benchmark, we constructed capital stocks for the remaining years using the Perpetual Inventory Method (PIM). Following the survey findings of Goel-tom (1995), we allowed depreciation rates of 0.033 for buildings, 0.10 for machin-ery and equipment and 0.20 for vehicles and other fixed capital.
Input–Output (IO) Data
We used the imported intermediate inputs matrix for Indonesia for the years 1985, 1990 and 1995, available for approximately 170 sectors—with minor varia-tions in the number of sectors over time. We re-aggregated the IO tables into 19 sectors using a 19 ×nsummation matrix, where nrefers to the number of sectors in the original table.
The OECD Data
In constructing the rent spillover measure we used the OECD’s STAN (Structural Analysis), ANBERD (Analytical Business Enterprise Research and Development) and BTD (Bilateral Trade) data sets respectively for output, R&D and exports-to-Indonesia of the 10 OECD partner countries. The R&D expenditure for each of the 10 OECD countries was converted to 1990 prices, and further into 1990 purchas-ing power parity dollars. R&D stock was then derived uspurchas-ing PIM (with the benchmark year taken as 1973). Following common practice we assume an initial growth of 5% and a depreciation rate of 0.15%.
SAMPLE AND ESTIMATION
Our combined data set covers the period 1980–96 for 19 manufacturing sectors. We make separate estimations for the pre-liberalisation (1980–87) and post-liberalisation (1988–96) phases. A Chow test (on equation 5) showed that the esti-mated slope coefficients between the two subperiods are significantly different.20
This is so even after including a period dummy (to account for changes in the intercepts) in the regression equation for the full sample. In addition to the divi-sion of the sample between the pre- and post-liberalisation phases, we distin-guish between low-, medium- and high-technology sectors.
To estimate equation (5), we employ the panel corrected standard error estima-tion method to account for heteroscedastic errors. We estimate a fixed-effects model with sector dummies that control for the effect of sector-specific influ-ences. This is in line with the results of earlier studies that found that unit (e.g. country, industry) specific factors play an important role in influencing those fac-tors that contribute to productivity, especially technology spillovers (Fagerberg and Verspagen 2000).
However, one weakness of the Ordinary Least Square (OLS) estimation is that the results can be affected by spurious correlation among the variables if the vari-ables are non-stationary. We use the test for heterogeneous panels developed by
Im et al. (2003) to investigate this possibility; the null hypothesis of
non-stationarity is not rejected for all variables. We then perform a cointegration test
21These results are not reported, but are available on request from the authors.
22We excluded the time trend in the EY estimation to avoid any bias resulting from a fixed effect in the second stage. Note that, during this stage, explanatory variables are presented in their first differences, and therefore the time trend takes a constant value.
23The OLS results can be found in our working paper (Jacob and Meister 2004).
24The four subsamples for which OLS estimation yielded negative values for the returns-to-scale parameter are the medium technology samples for the full period, the pre-liberalisation and post-pre-liberalisation phases, and the low technology sample for the pre-liberalisation phase.
25Griliches and Mairesse (1984) report negative returns to scale and put forward a num-ber of explanations. Los and Verspagen (2000), in line with our own findings, have demon-strated that non-stationarity of the variables is a possible cause for negative returns to scale under OLS estimation.
(Johansen 1988) on the non-stationary variables, and conclude that a cointegra-tion relacointegra-tionship exists among them.21
We then re-estimate equation (5) using the three-step estimation procedure for a long-run cointegrating vector suggested by Engle and Yoo (1991) (EY). In the first step we estimate a fixed-effects regression of equation (5) (excluding the time trend and the period dummy). The second step is to estimate an error correction model (ECM). This involves estimating equation (5) in first differences, with the lagged value of the residual from the first step as an additional regressor (exclud-ing the intercept term). A significantly negative coefficient for the lagged residual is another indication of a cointegrating relationship, which we find in all our sam-ples. The final step is to estimate the following equation:22
(6)
in which εis the residual from the second step and is the estimated coefficient of the lagged residual in the second step. The lagged values of the right-hand-side variables have been used in the above equation under the assumption of weak exogeneity. The long-run coefficients are calculated as the sum of the coefficients in the first and third steps, and the unbiased standard errors are those from the third step.
RESULTS
We performed both the OLS and EY estimations, but report only the results of the latter.23Although the signs and levels of significance of most coefficients are
sim-ilar, we note some important differences between the results of the two estima-tions. The crucial difference is in respect of the returns-to-scale variable (l). Its coefficient value turned from negative values under OLS to positive values under EY in three out of four subsamples24(the medium-technology sample for the
pre-liberalisation phase being the only exception). This suggests that non-stationarity of the variables could have generated the rather implausible result of decreasing returns to scale under the OLS estimations.25The other important difference is
ˆ
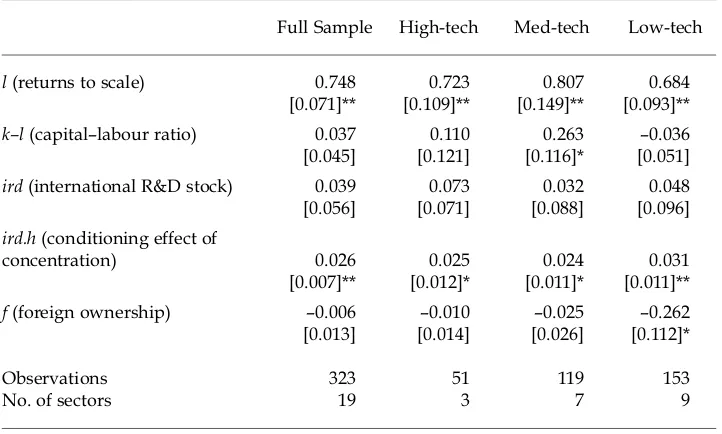
TABLE 2 Engle–Yoo Estimates, Full Period, 1980–96a
Full Sample High-tech Med-tech Low-tech
l (returns to scale) 0.748 0.723 0.807 0.684
[0.071]** [0.109]** [0.149]** [0.093]**
k–l (capital–labour ratio) 0.037 0.110 0.263 –0.036
[0.045] [0.121] [0.116]* [0.051]
ird (international R&D stock) 0.039 0.073 0.032 0.048
[0.056] [0.071] [0.088] [0.096]
ird.h (conditioning effect of
concentration) 0.026 0.025 0.024 0.031
[0.007]** [0.012]* [0.011]* [0.011]**
f (foreign ownership) –0.006 –0.010 –0.025 –0.262
[0.013] [0.014] [0.026] [0.112]*
Observations 323 51 119 153
No. of sectors 19 3 7 9
aStandard errors in parentheses.
* significant at 5%; ** significant at 1%.
that the rent spillover coefficient for the post-liberalisation phase was higher in the EY than in the OLS results across all subsamples.
During the full period from 1980 to 1996, the two spillover variables— the rent spillover, ird, and the interaction term, ird.h, showing the conditional spillover effect—are positive across all technology classes (table 2). However, only the lat-ter variable shows statistical significance. Among the other variables, scale effects (l) provide substantial contributions to productivity changes in all three technol-ogy classes.
Turning to the comparison of results in the pre- and post-liberalisation phases, we note that the rent spillover and the conditional spillover effects have been important mainly in the post-liberalisation phase. In the pre-liberalisation phase, the only positive contribution of rent spillovers was their conditional effect in the low-technology sector (table 3). As in the full period, the spillover effect from for-eign investment (variable f) does not show any significant positive contribution in either phase. Indeed, in the pre-liberalisation phase it made a significant nega-tive contribution in the medium-technology sector. These results may be explained by the observation of Aswicahyono et al. (2000) that foreign firms have been inefficient in industries where protection has been predominant. Also, Poot
et al. (1990) show that foreign investment until the 1990s was mainly of the
import-substituting type in consumer durables (automobiles, TV sets, refrigera-tors), chemicals and drugs, textiles and garments (e.g. integrated textile mills) and food industries (e.g. beer).
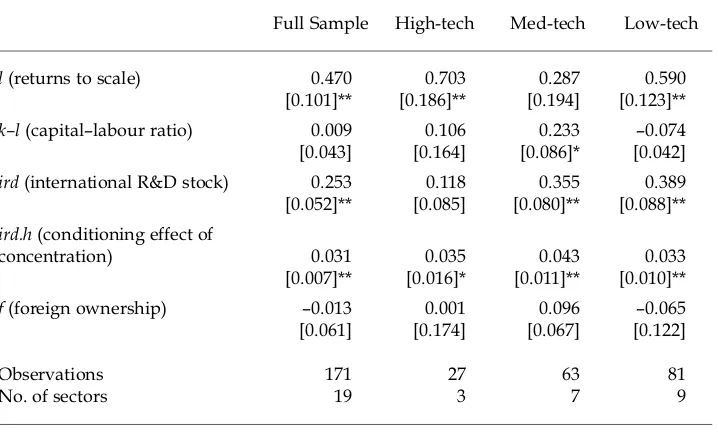
In the post-liberalisation phase, rent spillover emerged as a significant contrib-utor to productivity change in the medium- and low-technology sectors (table 4).
TABLE 3 Engle–Yoo Estimates, Pre-liberalisation Phase, 1980–87a
Full Sample High-tech Med-tech Low-tech
l (returns to scale) 0.519 0.344 –0.203 0.596
[0.109]** [0.366] [0.181] [0.126]**
k–l (capital–labour ratio) 0.281 0.270 0.528 0.179
[0.048]** [0.102]* [0.117]** [0.051]** ird (international R&D stock) –0.160 –0.084 –0.151 –0.475 [0.088] [0.125] [0.089] [0.160]** ird.h (conditioning effect of
concentration) 0.017 0.028 0.000 0.022
[0.007]* [0.017] [0.010] [0.009]*
f (foreign ownership) –0.018 0.002 –0.026 –0.143
[0.009]* [0.015] [0.009]* [0.091]
Observations 152 24 56 72
No. of sectors 19 3 7 9
aStandard errors in parentheses.
* significant at 5%; ** significant at 1%.
An important explanation for these results is that the liberalised import regime gave easier and cheaper access to intermediate inputs and capital goods. In this respect, two important policy initiatives that the Indonesian economy witnessed during the initial stages of the post-liberalisation phase deserve special mention. These are the duty exemptions and drawback schemes. Introduced in 1986 to attract export-oriented investment, they enabled exporters to buy inputs and cap-ital equipment at international prices (Pangestu 1997).
The influence of conditional spillover was also widespread during this phase: its effect was positive and significant across all three technology classes. This sug-gests that the liberalised import regime led to industries with higher product market concentration benefiting more from rent spillovers than those with lower levels of concentration.
The foreign technology variable remains insignificant, although the direction of influence changes from negative to positive in the medium-technology sector. Another interesting result when we compare the pre- and post-liberalisation phases pertains to capital (capital–labour ratio,k–l). This was a significant contrib-utor to labour productivity in the pre-liberalisation phase in all technology classes, reflecting the investment drive of the 1980s. However, in the post-reform phase it failed to generate any significant positive impact on productivity, except in the medium-technology sectors. But even here the value of the coefficient almost halved. The scale coefficient, while remaining a significant contributor in the low-technology class, also made a significantly positive impact in the high-low-technology sectors. The latter result may be related to the early stage of growth of the high-technology industries, together with the export orientation of the economy.
TABLE 4 Engle–Yoo Estimates, Post-liberalisation Phase, 1988–96a
Full Sample High-tech Med-tech Low-tech
l (returns to scale) 0.470 0.703 0.287 0.590
[0.101]** [0.186]** [0.194] [0.123]**
k–l (capital–labour ratio) 0.009 0.106 0.233 –0.074
[0.043] [0.164] [0.086]* [0.042]
ird (international R&D stock) 0.253 0.118 0.355 0.389 [0.052]** [0.085] [0.080]** [0.088]** ird.h (conditioning effect of
concentration) 0.031 0.035 0.043 0.033
[0.007]** [0.016]* [0.011]** [0.010]**
f (foreign ownership) –0.013 0.001 0.096 –0.065
[0.061] [0.174] [0.067] [0.122]
Observations 171 27 63 81
No. of sectors 19 3 7 9
aStandard errors in parentheses.
* significant at 5%; ** significant at 1%.
CONCLUDING REMARKS
Our analysis covers the period from 1980 to 1996, encompassing the import-substituting and export-promoting phases of Indonesia’s industrialisation. The
a priori distinction between pre- and post-liberalisation phases was confirmed
using a Chow test. A comparison of the market structures under the two policy regimes revealed a mixed pattern of change in the levels of concentration in most manufacturing sectors.
We undertook two panel estimations: the OLS fixed-effect estimation and the EY three-step estimation of a long-run cointegrating vector. The EY estimation was called for in view of the finding that all our variables violated the crucial assumption of stationarity of the variables underlying the OLS estimation. The estimation results from the EY model are generally in line with the OLS estima-tion results, with the crucial difference that the EY estimaestima-tion led to an increase in the value of the returns-to-scale variable, thus suggesting non-stationarity as a possible cause for decreasing returns to scale under OLS estimation. We therefore rely on the results from EY for drawing our conclusions.
We found important shifts in the sources of labour productivity after liberali-sation. Whereas non-technology factors, especially capital, contributed most to the productivity gains in the pre-liberalisation phase, they lost their relative importance to technology factors in the post-liberalisation phase.
The removal of the anti-export bias of industrialisation and the adoption of a more liberal import regime have had the effect of augmenting the contribution of rent spillovers to labour productivity. Rent spillovers per sehave been a signifi-cant factor in the medium- and low-technology classes, and their effect,
tional on market concentration, has been significant across all three technology classes. This seems to have offset the effect on labour productivity of the shifts in manufacturing to more labour-intensive activities (to improve competitiveness in export markets).
The result that market concentration has been a significant facilitator of spillovers in the liberalised phase implies that although liberalisation allowed easier access to imported inputs, firms with greater market power were able to access these inputs at lower prices than others. One interpretation for this would be that firms with larger resources were able to choose from a wider array of sup-pliers (and countries), and therefore possessed greater bargaining power, than smaller firms with limited resources.
Our results suggest the absence in both phases of any significant knowledge spillovers from FDI; this can be attributed to inadequacies in domestic absorptive capacity (for example, in terms of complementary R&D and human capital).
Although from a theoretical perspective we interpret technology spillovers generated by imports as a productivity rent from advanced country industries, the user–producer relationships within international trade could also generate some degree of knowledge spillover. However, to capture knowledge spillovers one needs to employ a measure of technological closeness between foreign and domestic industries. This is an important subject for future research.
REFERENCES
Abramovitz, M. (1986), ‘Catching Up, Forging Ahead and Falling Behind’, Journal of Eco-nomic History46: 385–406.
Adams, J.D. (1990), ‘Fundamental Stocks of Knowledge and Productivity Growth’, Journal of Political Economy98 (4): 673–703.
Aghion, P., and P. Howitt (1992), ‘A Model of Growth through Creative Destruction’, Econometrica60 (2): 323–51.
Aswicahyono, H.H. (1998), Total Factor Productivity in Indonesian Manufacturing, 1975–1993, Unpublished PhD dissertation, Australian National University, Canberra. Aswicahyono, H.H., M.C. Basri and H. Hill (2000), ‘How Not to Industrialise?
Indonesia’s Automotive Industry’, Bulletin of Indonesian Economic Studies36 (1): 209–41. Cameron, G. (1996), ‘Innovation and Economic Growth’, CEP Discussion Papers 0277,
Centre for Economic Performance, London School of Economics, London.
Coe, D.T., and E. Helpman (1995), ‘International R&D Spillovers’, European Economic Review 39 (5): 859–87.
Coe, D.T., and A.W. Hoffmaister (1999), ‘Are There International R&D Spillovers among Randomly Matched Trading Partners? A Response to Keller’, IMF Working Paper 99/18, Washington DC.
Dasgupta, D., J. Hanson and E. Hulu (1995), The Rise in TFP during Deregulation: Indo-nesia 1985–1992, Paper presented to the Conference on ‘Building on Success: Maximis-ing the Gains from Deregulation’, Jakarta.
De Long, B.J. (1988), ‘Productivity Growth, Convergence and Welfare: Comment’, Ameri-can Economic Review78 (5): 1,138–54.
Engle, R.F., and B.S.Yoo (1991), ‘Cointegrated Economic Time Series: A Survey With New Results’, in R.F. Engle and C.W.J. Granger (eds), Long Run Economic Relationships, Oxford University Press, Oxford.
Fagerberg, J. (1987), ‘A Technology Gap Approach to Why Growth Rates Differ’, Research Policy16 (2–4): 87–99.
Fagerberg, J., and B. Verspagen (2000), ‘Productivity, R&D Spillovers and Trade’, in B. van Ark, S.K. Kuipers and G. Kuper (eds), Productivity, Technology and Economic Growth, Kluwer Academic Publishers, Dordrecht: 345–60.
Fane, G. (1999), ‘Indonesian Economic Policies and Performance, 1960–98’, World Economy 22 (5): 651–68.
Goeltom, M. (1995), Indonesia’s Financial Liberalization: An Empirical Analysis of 1981–1988 Panel Data, Institute of South East Asian Studies, Singapore.
Goto, A., and K. Suzuki (1989), ‘R&D Capital, Rate of Return on R&D Investment and Spillover of R&D in Japanese Manufacturing Industries’, Review of Economics and Statis-tics 71: 555–64.
Griliches, Z. (1979), ‘Issues in Assessing the Contribution of R&D to Productivity Growth’, The Bell Journal of Economics 10: 92–116.
Griliches, Z. (1992), ‘The Search for R&D Spillovers’, Scandinavian Journal of Economics 94: S29–S47.
Griliches, Z., and J. Mairesse (1984), ‘Productivity and R&D at the Firm Level’, in Z. Griliches (ed.), R&D, Patents and Productivity, University of Chicago Press, Chicago: 339–74.
Grossman, G., and E. Helpman (1991), ‘Quality Ladders in the Theory of Economic Growth’, Review of Economic Studies 58: 43–61.
Hikino, T., and A.H. Amsden (1994), ‘Staying Behind, Stumbling Back, Sneaking Up, Soar-ing Ahead: Late Industrialization in Historical Perspective’, in W.J. Baumol, R.R. Nel-son and E.N. Wolff (eds), Convergence of Productivity: Cross-National Studies and Historical Evidence, Oxford University Press, Oxford and New York: 285–315.
Hill, H. (1988), Foreign Investment and Industrialization in Indonesia, Oxford University Press, Singapore.
Hill, H. (1995), ‘Indonesia’s Great Leap Forward? Technology Development and Policy Issues’, Bulletin of Indonesian Economic Studies 31 (2): 83–123.
Hill, H. (1996), The Indonesian Economy since 1966: Southeast Asia’s Emerging Giant, Cambridge University Press, Cambridge.
Im, K.S., M.H. Pesaran and Y. Shin (2003), ‘Testing for Unit Roots in Heterogeneous Pan-els’, Journal of Econometrics 115: 53–74.
Jacob, J., and C. Meister (2004), ‘Productivity Gains, Intersectoral Linkages, and Trade: Indonesian Manufacturing, 1980–1996’, Working Paper 04.14, Eindhoven Centre for Innovation Studies, Technische Universiteit Eindhoven, Eindhoven.
Jaffe, A.B. (1986), ‘Technological Opportunity and Spillovers of R&D: Evidence from Firms’ Patents, Profits, and Market Value’, American Economic Review 76: 984–1,001. Jammal, Y. (1993), ‘Backcasting Manufacturing Growth: 1975–1990’, DSP (Development
Studies Project) Statistical Paper, BPS/DSP, Jakarta.
Johansen, S. (1988), ‘Statistical Analysis of Cointegration Vectors’, Journal of Economic Dynamics and Control 12: 231–54.
Keller, W. (1998), ‘Are International R&D Spillovers Trade Related? Analyzing Spillovers among Randomly Matched Trade Partners’, European Economic Review 42: 1,469–81. Lall, S. (1998), ‘Technology Polices in Indonesia’, in H. Hill and Thee Kian Wie (eds),
Indo-nesia’s Technological Challenge, RSPAS, Australian National University, Canberra, and Institute of Southeast Asian Studies, Singapore: 136–70.
Lichtenberg, F.R., and B. van Pottelsberghe de la Potterie (1998), ‘International R&D Spillovers: A Comment’, European Economic Review 42 (8): 1,483–91.
Los, B., and B. Verspagen (2000), ‘R&D Spillovers and Productivity: Evidence from U.S. Manufacturing Microdata’, Empirical Economics 25: 127–48.
Osada, H. (1994), ‘Trade Liberalisation and FDI Incentives in Indonesia: The Impact on Industrial Productivity’, The Developing Economies 32 (4): 479–91.
Pangestu, M. (1997), ‘The Indonesian Textile and Garment Industry: Structural Change and Competitive Challenges’, in M. Pangestu and Y. Sato (eds), Waves of Change in Indo-nesia’s Manufacturing Industry, Institute of Developing Economies, Tokyo.
Papaconstantinou, G., N. Sakurai and A. Wyckoff (1996), ‘Embodied Technology Diffu-sion: An Empirical Analysis for 10 OECD Countries’, STI Working Paper 1996/1, OECD, Paris.
Poot, H., A. Kuyvenhoven and J.C. Jansen (1990), Industrialisation and Trade in Indonesia, Gadjah Mada University Press, Yogyakarta.
Putnam, J., and R.E. Evenson (1994), Inter-sectoral Technology Flows: Estimates from a Patent Concordance with an Application to Italy, Yale University, New Haven CT, mimeo.
Rivera-Batiz, A. Luis, and P.M. Romer (1991), ‘Economic Integration and Endogenous Growth’, Quarterly Journal of Economics 106 (2): 531–55.
Romer, P.M. (1987), ‘Growth Based on Increasing Returns Due to Specialization’, American Economic Review 77 (2): 56–62.
Rosenberg, N. (1982), Inside the Black Box: Technology and Economics, Cambridge University Press, New York.
Scherer, F.M. (1982), ‘Inter-industry Technology Flows and Productivity Growth’, Review of Economics and Statistics 64: 627–34.
Schneider, J., and T. Ziesemer, (1995), ‘What’s New and What’s Old in New Growth The-ory: Endogenous Technology, Microfoundation and Growth Rate Predictions: A Critical Overview’, Zeitschrift für Wirtschafts- und Sozialwissenschaften 115 (3): 429–72.
Simatupang, B. (1996), ‘Economic Transformation and Liberalization in Indonesia’, in A.J.E. Fernandez and A. Mommen (eds), Liberalization in the Developing World: Institu-tional and Economic Changes in Latin America, Africa and Asia, Routledge, London and New York.
Sjöholm, F. (1999), ‘Technology Gap, Competition and Spillovers from Direct Foreign Investment: Evidence from Establishment Data’, Journal of Development Studies 36 (1): 53–73.
Takii, S., and E. Ramstetter (2003), ‘Employment, Production, Labour Productivity and Foreign Multinationals in Indonesian Manufacturing, 1975–2000’, ICSEAD Working Paper Series 2003-25, Kitakyushu.
Terleckyj, N.E. (1982), ‘R&D and US Industrial Productivity in the 1970s’, in D. Sahal (ed.), The Transfer and Utilization of Technical Knowledge, Heath, Lexington MA.
Thee K.W. (1991), ‘The Surge of Asian NIC Investment to Indonesia’, Bulletin of Indonesian Economic Studies27 (3): 55–88.
Thee K.W. (1998), ‘Determinants of Indonesia’s Industrial Technology Development’, in H. Hill and Thee K.W. (eds), Indonesia’s Technological Challenge, Australian National Uni-versity, Canberra, and Institute of Southeast Asian Studies, Singapore: 136–70.
Thee K.W. (2002), ‘Competition Policy in Indonesia and the New Anti-monopoly and Fair Competition Law’, Bulletin of Indonesian Economic Studies38 (3): 331–42.
Thee K.W. (2003), The Major Channels of International Technology Transfer to Indonesia: An Assessment, Paper presented at the Conference on ‘Catch-Up Growth and Technol-ogy Transfer’, Groningen Centre for Growth and Development, University of Gronin-gen, 17–18 October.
Timmer, M. (2000), The Dynamics of Asian Manufacturing: A Comparison in the Late Twentieth Century, Edward Elgar, Cheltenham.
Triplett, J.E. (1996), ‘High-Tech Industry Productivity and Hedonic Price Indexes’, Bureau of Economic Analysis, Washington DC.
Verspagen, B. (1997), ‘Estimating International Technology Spillovers Using Technology Flow Matrices’, Weltwirtschaftliches Archiv 133 (2): 226–48.
Wang, J.Y., and M. Blomström (1992), ‘Foreign Investment and Technology Transfer: A Simple Model’, European Economic Review36 (1): 137–55.