COMMUNITY
MONITORING,
REPORTING AND
VERIFICATION
Authors:
Lead Authors*: Mary Menton, Luis Meneses, Claudia Comberti, Helen Bellield and David Sabogal Contributing authors: Jon Parsons, Ben Palmer-Fry, Han Overman and Niki Mardas
Contributing editors: Christina MacFarquhar, Rachel Howard
Contact: [email protected] Citation
Please cite this publication as: Global Canopy Programme, 2014. Community monitoring, reporting and veriication for REDD+: Lessons and experiences from a pilot project in Guyana, Global Canopy Programme: Oxford.
© The Global Canopy Programme Acknowledgements:
The authors would like to acknowledge the inancial support from the Norwegian Agency for Development Cooperation (NORAD) towards the implementation of this project, as well as the Waterloo Foundation and the Rufford Foundation for their initial support during the development phase of this project. We are also grateful for the guidance and support of our partners in Guyana; the involvement and leadership of the North Rupununi District Development Board (NRDDB), its pre-vious chairman Sydney Allicock and current chairman Michael Williams, and the staff of the NRDDB’s Makushi
Research Unit were instrumental in the development and implementation of the project, as were the partner-ship and guidance of the Iwokrama International Centre for Rainforest Conservation and Development (IIC). The Guyana Forestry Commission and Ofice of Climate Change also provided important guidance and support throughout the project.
The authors would like to thank all sixteen communities of North Rupununi (Annai, Apoteri, Aranaputa,
Crash-water, Fairview, Katoka, Kwaimatta, Kwatamang, Massara, Rewa, Rupertee, Surama, Toka, Wowetta, Yakarinta and Yupu-kari), including the toshaos and village councillors of each community, and all who have contributed to the CMRV Project. We would like to thank those involved in data collection for the project:
The CREW (Community Resource and Environment Workers): Allan Roberts, Arnold Bartholomew, Bernard Eusebio, Campbell James, Caroline Jacobs, Colin Simons Courtney Peters, Delon Abraham, Deona Joseph, Edghil Bowen, Francis Roberts, Garner Edwards, Glenda Joseph, Griley Mack, Handley Thomas, Harvey Jacobus, John Benjamin, Julian Brasche, Kenrick Benjamin, Kenrick Campbell, Kurt Singh, Leonie Ewell, Lincoln Francis, Marcus Moses, Nadia Norman, Norbert Salty, Nyola Edwards, Rebecca Francis, Rosita Roberts, Samantha Andries, Susan George, Tom Henry;
And the Makushi Research Unit (MRU) of the Annai District: Paulette Allicock, Ascenia Xavier, Lucillia Singh, Benita Rob-erts, Jordan Joseph, Cindy Lawrence, Deroy Augustine, Ernest Merriman, James RobRob-erts, Keith Sutherland, Mallory Moses, Neil Ignacio, Travis Franklin, and Verley Jacobus.
Special thanks go to the Project Management Team: Bryan Allicock, Vitus Antone, Vivian ‘Ricky’ Moses, Althea Hamilton, Shurland Davis, Verley Jacobus, Livingstone Hamilton; and to project partners and associates: NRDDB (Ivor Marslow, Mi-chael Williams, Sydney Alicock, Rosie Alam, Gylan Alvin), IIC (Dane Gobin, Raquel Thomas, Vanda Radzik, Roxroy Bollers, Derick Lowe); project coordinators: Mandar Trivedi, Han Overman, Luis Meneses, Mary Menton; and consultants: Tjeerd Wits, Ben Palmer-Fry.
The views and interpretations are those of the authors and do not necessarily represent those of the Norwegian Agency for Development Cooperation
4
EXECUTIVE SUMMARY
This report provides a comprehensive overview of the Community Monitoring, Reporting and Veriication (CMRV) project in the North Rupununi, Guyana, funded by the Norwegian Agency for Development Cooperation (NORAD).
It presents the approach and steps taken in setting up and managing the irst phase of this pilot project (2011-2013), as well as some of the key lessons learned, recommendations, and challenges.
The aim of the irst phase of the project was to pioneer an approach through which communities could monitor their forests, and also possibly receive payments or other beneits through a REDD+ opt-in mechanism being developed by the Government of Guyana. At the time of publication of this report, the project was in its second phase, under the wider Forest COMPASS: Community-powered Assessment of Ecosystem Services and Safeguards project. In this phase, in addition to continuing the work in Guyana, we are we are working with local partners in Acre, Brazil, to replicate the project in the Chico Mendes Reserve. We are also seeking to build a network of practitioners of community-based monitoring to share knowledge and best-practice and to further advocate for community-based monitoring as a viable approach for maximising REDD+2 effectiveness, eficacy and equity. This phase of the project operates at the local, national and international levels. This initiative has involved collaboration between a team of 32 dedicated community monitors from 16 indigenous Makushi villages, ive local project management staff, and partner representatives from the Global Canopy Programme (GCP), the North Rupununi District Development Board (NRDDB) and the Iwokrama International Centre for Rainforest Conservation and Development (IIC), with wider cooperation with the Government of Guyana through the Guyana Forestry Commission (GFC).
Data has been gathered on wellbeing, natural resource use, land-use change and carbon stocks, in order to generate information that can inform local resource management, and inform the development of national forest monitoring and safeguard information systems as part of Guyana’s Low Carbon Development Strategy (LCDS). Beyond this, it is hoped that the results of this project move discussions on REDD+ and indigenous participation forward at the national and international levels.
The experiences gained and lessons learned during phase 1, documented in this report, will be fundamental to further testing, improving and advocating for community participation in REDD+, as well as other national and international initiatives on forests, such as FLEGT VPAs3 and NBSAPs4. The authors ultimately hope that this report can serve as a valuable case study of community-based monitoring.
Key lessons and recommendations
Community-based monitoring has an important role to play in improving local resource management and informing the implementation of REDD+ regimes with local participation, as well as the potential to provide employment and income for local communities. Yet there are important considerations that stem from adopting such a model:
1. Monitoring activities must take into account multi-stakeholder interests and balance out external and local priorities and data needs in order to achieve relevance and integration of data at different scales;
2. Local institutions must be embedded in the governance and decision-making of the monitoring project to guarantee community participation and ownership, and to improve engagement with external entities;
1 The project was originally called Community empowerment for forest measuring , reporting and veriication (CMRV) in the proposal to
Norad. ‘Measuring’ later became ‘monitoring’ due to the latter being used more widely in Guyana.
2Reducing Emissions from Deforestation and Forest Degradation plus the role of conservation, sustainable management of forests and the
enhancement of forest carbon stocks.
3 Voluntary Partnership Agreements under the EU’s Forest Law Enforcement, Governance and Trade (FLEGT) Action Plan – see www.
eulegt.ei.int/home.
3. Local participation is fundamental in data management in order to guarantee transparency when establishing a data sharing protocol; such a protocol takes time and should be reviewed regularly following the principles of Free, Prior and Informed Consent (FPIC) and respecting data ownership;
4. Monitoring systems should feed directly into existing management plans and development strategies in order to establish appropriate interventions; therefore the design of effective methodologies must consider how the outputs will be processed, reported and applied so that the resulting information is relevant and useful;
5. Regular outreach and communication activities are essential to establish support and understanding among the wider community, who may not be participating in and beneiting directly from the project;
6. When community members are adequately trained and informed, they can produce data of national relevance; 7. Communities are best placed to gather socio-environmental baseline data for national safeguard information systems; 8. Monitoring systems relying on technology must consider the trade-offs involved and prioritise technical training;
9. Community participation in monitoring must be considered as a service, in order to guarantee permanence and continuity of the work, and therefore the sustainability of monitoring systems is strongly linked to long-term funding streams;
10. Some standardisation of methodologies and protocols on data collection and reporting is needed in order to achieve scale, keeping in mind, at the same time, the different aims of different projects.
In addition, an unexpected inding was that mobile phones encouraged intergenerational exchange, with the younger generation teaching the older generation to use the phones, while the older generation shared the necessary knowledge on farming and biodiversity needed for the surveys.
Main outputs of the project
Through the efforts described in this report, the CMRV project in Guyana delivered the following key outputs: 1. Sixteen community resource maps and reports were produced.
2. The main drivers of deforestation in the monitoring region were identiied. 3. Government satellite data was ground-truthed.
4. A report on above-ground biomass in the monitoring region was produced.
5. A set of indicators for assessing natural resources and community wellbeing were agreed upon among and monitored by key project stakeholders.
6. Capacity was built among local project team members to collect, process and analyse forest monitoring data. 7. A brieing note for the Government on Free, Prior and Informed Consent, in the context of CMRV, was produced. 8. A CMRV data sharing protocol was initiated.
6
CHAPTER 1. INTRODUCTION
CHAPTER 2. PROJECT IMPLEMENTATION
CHAPTER 3. MONITORING SYSTEM
CHAPTER 4. MONITORING METHODOLOGIES AND ACTIVITIES
CHAPTER 5. EVALUATION
CHAPTER 6. CONCLUSIONS
CONTENTS
LIST OF FIGURES, TABLES AND BOXES:
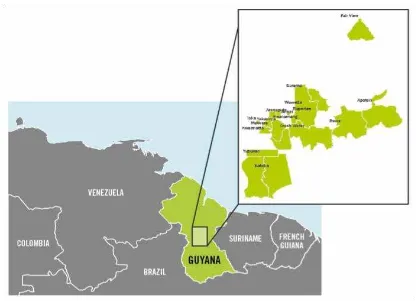
Figure 1. Map of the participating communities in the North Rupununi, Guyana Figure 2. Technology use and data lows within the monitoring system
Figure 2. Steps and processes in a monitoring cycle Figure 4. Data classiication system
Figure 5. Data sharing process and roles
Box 1: Community-based monitoring and REDD+ Box 2: Free, prior and informed consent
Table 1. Building partnerships and initial project planning Table 2: Developing the monitoring framework
Table 3. Outline of monitoring framework
Table 4. Using digital technology for community-based monitoring Table 5. Participatory mapping of community resources
Table 6. Understanding forest change Table 7. Ground-truthing activities Table 8. Biomass assessments Table 9. Natural resource monitoring Table 10. Monitoring wellbeing
ACRONYMS AND ABBREVIATIONS
REPORT STRUCTURE
CREW Community Resource Environment Worker CBFM Community-based forest management CBM Community-based monitoring CDS Community Demonstration Site
CMRV Community Monitoring, Reporting and Veriication FPIC Free, prior and informed consent
GCP Global Canopy Programme GFC Guyana Forestry Commission GIS Geographic information systems GPS Global Positioning System HFLD High forest low deforestation
ICC Iwokrama International Centre for Rainforest Conservation and Development LCDS Low Carbon Development Strategy
MAA Ministry of Amerindian Affairs
MoU Memorandum of Understanding
MoC Memorandum of Cooperation
MRV Measuring, reporting and veriication
MRVS Monitoring, Reporting and Veriication System MRU Makushi Research Unit
NRDDB North Rupununi District Development Board NORAD Norwegian Agency for Development Cooperation NTC National Toshaos Council
NTFP Non-timber forest product OCC Ofice of Climate Change ODK Open Data Kit
PMT Project management team
REDD+ Reducing Emission from Deforestation and forest Degradation plus the role of conservation, sustainable management of forests and the enhancement of forest carbon stocks
RPP Readiness Preparation Proposal SIS Safeguard information systems
UNFCCC United Nations Framework Convention on Climate Change
8
1. INTRODUCTION
1.1 REDD+ AND INDIGENOUS PARTICIPATION IN GUYANA
Guyana is country with high forest cover and low deforestation rates. Its forest area covers approximately 85% of its total territoryi, totalling about 18.5 million hectares. This is distributed across State Forest Area, State Lands, Protected Areas and
titled Amerindian villages, and a deforestation rate of between 0.02% and 0.079% per annumii.
However, there is an increasing risk facing Guyana’s forests, due to large- and small-scale mining activities, which cause 93% of deforestation in the countryiii, as well as the extraction of timber, and infrastructure developments associated
with these industries: the majority of forest change has occurred around existing roads and navigable rivers. Meanwhile, due to market integration and increasing trade with Brazil, the agricultural sector is a source of growing pressure. While deforestation rates are lower in Amerindian titled lands (0.04% in 2012), mining is again the primary driver of deforestation, accounting for 95% of forest changeiv.
To avoid further deforestation, Guyana has, since 2006, actively pursued REDD+, the international policy mechanism to ‘reduce emissions from deforestation and forest degradation, plus the role of conservation, sustainable management of forests and the enhancement of forest carbon stocks’. In 2009, Guyana and Norway signed a Memorandum of Understanding (MoU) on implementing Guyana’s plan to shift towards more sustainable extractive industries and forest management, known as the Low Carbon Development Strategy (LCDS). Through this MoU, the two countries established a framework for implementation, with up to USD 250 million in performance-related inance over ive years, ending in 2015. The three main pillars of this strategy are: (1) avoiding deforestation, (2) promoting low carbon development, and (3) adapting to climate change.
There are two components in the LCDS that are critical in order to achieve effectiveness and equity:
1. The development of a system for monitoring, reporting and veriication, in order to measure and track changes in Guyana’s forest carbon stocks and determine performance-related payments under the MoU; and
2. The recognition of the importance of multi-stakeholder participation – in particular the participation of indigenous communities dependent on forests - in designing and implementing the LCDS.
Amerindians currently hold legal title to 13.9% of the land in Guyana, and therefore the engagement of forest-dependent communities is particularly relevantv. Although Amerindian and private land are initially excluded from the LCDS (which only covers State Forest Land), the Government of Guyana intends to give titled Amerindian communities the option to participate in the LCDS and opt into an agreement on REDD+. This would be in return for a pro-rata share, in future, of compensation payments received by Guyana. Guyana’s Ofice of Climate Change (OCC) is currently leading a process, along with the Ministry of Amerindian Affairs (MAA) and the National Toshaos Council (NTC), of public participation and consultation for the development of the opt-in mechanism. A beneit-sharing structure is not yet in place, but payments could be made to communities directly or via an Amerindian Development Fund.
1.2 THE NORTH RUPUNUNI COMMUNITY-MRV PROJECT
The rich and diverse landscape of North Rupununi, located in south-western Guyana, includes old growth tropical forest, savannah and wetland ecosystems. Amerindian Makushi people make up the majority of the population of the region. While many continue to practice traditional subsistence activities, such as farming, hunting, ishing, logging and crafts, the sustainability of local livelihoods in the region is increasingly under threat due to development of the country’s interior - especially external threats from mining and road building (e.g. the Georgetown-Lethem Transport Corridor5) and the
social and environmental pressures that accompany them. As a result of such developments, access to forest resources, and to markets that were previously remote, has increased. This has resulted in growing community awareness that forest resources need to be managed in more sustainable and systematic ways. Participation in forest monitoring under a REDD+6 regime is seen as a way to better understand and address these growing pressures, while also supporting communities wanting to diversify and develop their livelihoods.
5 This project is part of the Integration of the Regional Infrastructure of South America Initiative (IIRSA), a joint development plan of the 12
countries in the Union of South American Nations (UNASUR). The initiative aims to promote regional economic growth through enhanced transport, energy and telecommunications networks.
6 Reducing Emission from Deforestation and Forest Degradation plus the role of conservation, sustainable management of forests and the
Figure 1. Map of the participating communities in the North Rupununi, Guyana
The Community MRV project was established in 2010 in collaboration with North Rupununi District Development Board (NRDDB) - representing sixteen Amerindian communities, the Guyana Forestry Commission (GFC), the Iwokrama International Centre for Rainforest Conservation and Development (IIC) and the Global Canopy Programme (GCP). The overarching aim for the irst phase of the project was to pioneer a mechanism through which communities in Guyana could monitor their forests, and also possibly receive payments or other beneits through a REDD+ opt-in mechanism being developed by the Government of Guyana, by providing information needed under Guyana’s national monitoring, reporting and veriication (MRV) system. It would do this by bringing together local and national institutions to test and demonstrate the eficacy and value of a community-based monitoring model for the national MRV system and wider REDD+ policy frameworks.
Under a Memorandum of Cooperation signed between NRDDB and GFC in 2011, it was agreed that Annai District,
comprising a collective land title for ive villages (Annai Central, Kwatamang, Rupertee, Surama and Wowetta), would serve as part of the REDD+ Community Demonstration Site (CDS) under the framework of the national Monitoring, Reporting and Veriication (MRVS) Roadmap7. Data on local drivers of forest change and carbon stocks, and results of ground truthing
activities on satellite data for past deforestation events, were to be collected and shared with the GFC and the National MRVS Steering Committee.
Beyond this, sixteen communities in the region (see Figure 1) would beneit from forest monitoring in their territories, through direct employment and learning opportunities, institutional strengthening, and improved resource and territory management.
7 The National MRVS Roadmap which outlines the requirements, capacity gaps and key capacity development priorities for establishing
an MRV system; it highlights the need for sub-national MRV systems to enable the monitoring of local REDD+ activities. An important component of the MRVS Roadmap is that of REDD+ demonstration activities to address drivers of forest change in mining, forestry and
10
BOX 1: COMMUNITY-BASED
MONITORING AND REDD+
Globally, more than 20% of tropical forests are under community management.vi This igure is rising as governments
recognise both the rights and role of communities in sustainable forest management. It is widely argued that community-based monitoring can foster forest stewardship, increase awareness and participation, and contribute to more effective community resource management and development plans, while also improving intervention programmes.
More eficient, effective and equitable REDD+
A fundamental component of REDD+ implementation will be the development of a robust and cost-effective national MRV system to measure changes in forest areas, track carbon stocks/lows, and report on the effectiveness of different activities and policies in reducing emissions. Community-based monitoring could play an important role in these systems by providing: valuable insights into local drivers of deforestation and forest degradation; regular data on carbon stock measurements; real-time updates on forest changes; calibration of satellite data systems; and validation of remote-sensing estimates through ground truthing. Studies have also demonstrated that community-based monitoring can be advantageous in terms of lowering the cost of data collection, while delivering accurate and reliable data that is comparable to that
collected by trained scientists.
More importantly, community-based monitoring can be a valuable model for meeting REDD+ requirements under the United Nations Framework Convention on Climate Change (UNFCCC) mandate that speciies that the REDD+ mechanism must ensure the full and effective participation of relevant stakeholders.
Beyond this, community-based monitoring can provide valuable information on the impacts of REDD+ activities on wellbeing, livelihoods, biodiversity, ecosystem services and other indicators. This data can be used by governments to provide information and report on how safeguards for avoiding negative social and environmental outcomes are being addressed and respected, through a Safeguard Information System8 for national REDD+ and related forest policies. As
such, community-based monitoring is increasingly being recognised as an important approach in achieving a more eficient, effective and equitable REDD+ implementation.
Further reading
There is a long history of community-based monitoring in tropical forests and much work has been done to explore and explain how this can link to national monitoring for REDD+. The following studies provide more in depth analysis:
Austin, K. & Stolle, F. Community-based monitoring in Hewson, J., Steininger, M. and Pesmajoglou, S., eds., 2013. REDD+ Measurement, Reporting and Veriication (MRV) Manual. USAID-supported Forest Carbon, Markets and Communities Program: Washington, DC, USA.
Danielsen, F., Adrian, T., Brofeldt, S., van Noordwijk, M., Poulsen, M. K., Rahayu, S. & Thoumtone, V., 2013., Community Monitoring for REDD+: International Promises and Field Realities. Ecology & Society 18(3).
Palmer Fry, B. 2011., Community forest monitoring in REDD+: the ‘M’in MRV? Environmental Science & Policy 14(2), 181-187.
Pratihast, A. K., Herold, M., De Sy, V., Murdiyarso, D., & Skutsch, M., 2013. Linking community-based and national REDD+ monitoring: a review of the potential. Carbon Management 4(1), 91-104.
Skutsch, M (ed), 2010. Community forest monitoring for the carbon market. Earthscan, London.
8 The United Nations Framework Convention on Climate Change (UNFCCC) Decision 12/CP.17 states that a Safeguard Information System
2. PROJECT IMPLEMENTATION
2.1 KEY PROJECT STAKEHOLDERS
Communities
Sixteen predominantly indigenous Makushi communities of the North Rupununi region of Guyana are actively involved in the project. Politically, these communities are represented by their own Village Council and the North Rupununi District Development Board (NRDDB), the two high level decision-making bodies in the communities. The NRDDB consists of all Toshaos9 plus a second representative from each of the 16 Village Councils. The Board acts as the de facto governance
body for the development of North Rupununi. At the national level, each village Toshao is represented at National Toshaos Council (NTC).
The NRDDB acts as the implementing organisation for this project. It employs the local project management team and community monitors, is responsible for activities on the ground, and acts as the interface between the project team and the village leaders. The NRDDB also represents the project in the Memorandum of Cooperation (MoC) with the Guyana Forestry Commission (GFC).
At the village level, the decision-making authority on village land-use regulations, management and development issues is the Village Council, which comprises the Toshao, elected community representatives, and a few permanent ‘elders’ - or Village Councillors.
Government
The key government body involved in the project is the Guyana Forestry Commission (GFC), which is responsible for the implementation of key technical aspects of the national REDD+ programme including the development of the national MRV System. Other important government stakeholders include the Ofice of Climate Change (OCC), the MRVS Steering Committee, which is responsible for designing the MRV System under the LCDS, and the Ministry of Amerindian Affairs (MAA).
Project Facilitators
The Global Canopy Programme (GCP), a tropical forest think-tank based in the UK, raised funds for and initiated this project together with the Iwokrama International Centre (IIC). The ICC is the institution responsible for managing the Iwokrama Forest, and has been implementing sustainable development and research programmes with indigenous people living in and around the forest. GCP coordinates the distribution of funds to partners, ensures that project deliverables and objectives are being met, and provides advice, training, and technical support to NRDBB. The IIC facilitates
communications between the project team and national stakeholders, including the Government of Guyana, and provides local technical advice and training to the community monitors.
A facilitator, in the context of this project, is an external organisation that supports and enables the implementation the project. This may include, inter alia, training, technical support, and facilitation with stakeholders and donors.
9 Toshaos are the democratically elected leaders of their communities. Elections occur every three years and a single person may be in ofice
12
BOX 2: FREE, PRIOR
AND INFORMED CONSENT
10 Both the Guyana Constitution (2003) and the Amerindian Act (2006) state that Amerindian Village Councils and Villages can give or
withhold consent to activities affecting their protected lands.
11 A Free, Prior and Informed Consent (FPIC) Brieing Note, based in this CMRV project, was accepted by the GFC as a point of reference
for the LCDS “opt-in” mechanism for indigenous communities. The brieing note was delivered in April 2013 and in August the project was informed that GFC has recommended it as the FPIC process under the MRV system.
Free, prior and informed consent (FPIC) refers to the collective right of indigenous peoples to participate in decision-making and to give or withhold their consent to, or withhold it from, activities affecting their lands, territories, resources and rights. FPIC is enshrined in Guyana’s national law10. In the context of REDD+, FPIC principles have been adopted to
ensure that the rights of indigenous communities are protected.
The FPIC principles have guided all aspects of this project, in particular its design and implementation, and the adoption of appropriate approaches for data ownership and sharing, and for decision-making.11,vii In addition, training on FPIC theory
and processes was provided to the NRDDB Board to help build understanding and guide on-going and future engagements and decisions related to REDD+ and the proposed ‘opt-in’ mechanism, and any other matters affecting Amerindian communities of the North Rupununi.
Further reading:
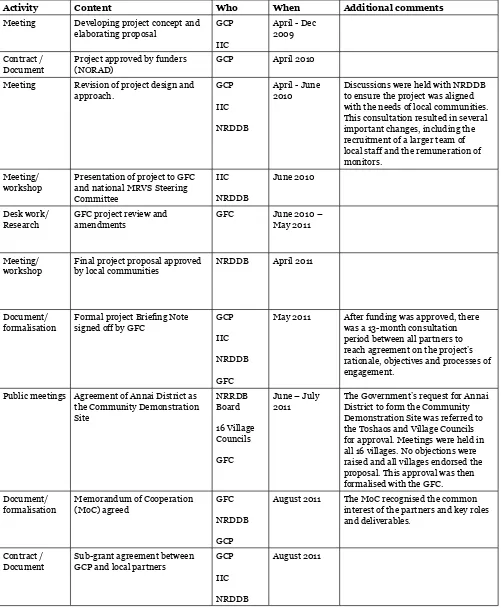
Table 1: Building partnerships and initial project planning
Activity Content Who When Additional comments
Meeting Developing project concept and elaborating proposal
GCP IIC
April - Dec 2009
Contract / Document
Project approved by funders (NORAD)
GCP April 2010
Meeting Revision of project design and approach.
GCP IIC NRDDB
April - June 2010
Discussions were held with NRDDB to ensure the project was aligned with the needs of local communities. This consultation resulted in several important changes, including the recruitment of a larger team of local staff and the remuneration of monitors.
Meeting/ workshop
Presentation of project to GFC and national MRVS Steering Committee IIC NRDDB June 2010 Desk work/ Research
GFC project review and amendments
GFC June 2010 – May 2011
Meeting/ workshop
Final project proposal approved by local communities
NRDDB April 2011
Document/ formalisation
Formal project Brieing Note signed off by GFC
GCP IIC NRDDB GFC
May 2011 After funding was approved, there was a 13-month consultation period between all partners to reach agreement on the project’s rationale, objectives and processes of engagement.
Public meetings Agreement of Annai District as the Community Demonstration Site NRRDB Board 16 Village Councils GFC
June – July 2011
The Government’s request for Annai District to form the Community Demonstration Site was referred to the Toshaos and Village Councils for approval. Meetings were held in all 16 villages. No objections were raised and all villages endorsed the proposal. This approval was then formalised with the GFC. Document/
formalisation
Memorandum of Cooperation (MoC) agreed
GFC NRDDB GCP
August 2011 The MoC recognised the common interest of the partners and key roles and deliverables.
Contract / Document
Sub-grant agreement between GCP and local partners
GCP IIC NRDDB
14
Workshop Kick-off and planning workshop GCP IIC NRDDB CREW
Toshaos
Nov 2011
Reporting/ feedback
Community outreach PMT
CREW
Nov 2011-Jan 2012
The project was reintroduced to and discussed with all villages through a series of presentations by local staff. Meeting/
workshop
Oficial project launch in Annai Partners GFC
Jan 2012
Meeting/ workshop
Stakeholder Advisory Committee established
GCP IIC NRDDB
Jan 2012 NRDDB, IIC, GCP, GFC, Guyana’s Ofice of Climate Change, the Ministry of Amerindian Affairs and the National Toshaos’ Council became part of the Stakeholder Advisory Committee to ensure synergy between the project and the national MRVS framework.
Reporting/ feedback
Progress Report to MRVS Steering Committee
NRDDB March 12 / Sept 12 /Aug 13
Submission of progress reports to the GFC and the national MRVS Committee by project team.
2.2 PARTNERSHIPS AND GOVERNANCE
2.3 LOCAL PROJECT TEAM PARTICIPATION
Once all partnerships were formalised, a local project management team (PMT) and community resource and
environmental workers (CREW) were recruited. Working with a local team was essential for strengthening community ownership, building local capacity and ensuring a fully participatory project. Involving the local team and community leaders in various stages of project planning and implementation was also instrumental in building trust.
The project management team was hired in October 2011 under the NRDDB and supported by IIC. It consists of a Project Manager, responsible for overall project management; a Field Coordinator, responsible for coordinating monitoring activities; a geographic information system (GIS) Oficer, responsible for data management, storage and visualisation; and two support staff to assist with data input and processing, and general project administration.
Between October and December 2011, two CREW were selected for each of the 16 communities. Job advertisements were posted in public spaces and broadcast on the regional radio station. Female monitors were encouraged to ensure a gender balance. Candidates applied to their Village Council, and their suitability and commitment was assessed through an informal interview.
In June 2012, a GCP Field Director was hired to facilitate better communication between GCP and local partners, and to support project implementation on the ground.
Recruiting a local Project Management Team with regional knowledge and the respect of community leaders was crucial to successful implementation. Yet some important challenges arose nevertheless, in connection with the hiring of the CREW:
Recruitment
Although the recruitment process was considered thorough and inclusive by the Toshaos and Village Councils, there were reports that a few CREW members had been recruited through favouritism.
Staff turnover
Over an 18-month period, nine monitors from six communities left the project - a turnover of 28%. High staff turnover puts the community’s ongoing capacity to run the project at risk due to the level of training needed to collect the data. Although new CREW were hired to replace those who left, it was dificult to ensure they had consistent training.
Remuneration
16
3.1 THE MONITORING FRAMEWORK
A key step for implementing a monitoring system was deining and understanding monitoring indicators, and identifying and prioritising the information most relevant to all stakeholders. Balancing external data requirements with community needs is a fundamental component to ensure support and relevance of community-based monitoring schemes. In order to do this, a series of participatory workshops were held to identify and prioritise the information most relevant at the local level. The key activities in developing the monitoring system are shown in Table 2.
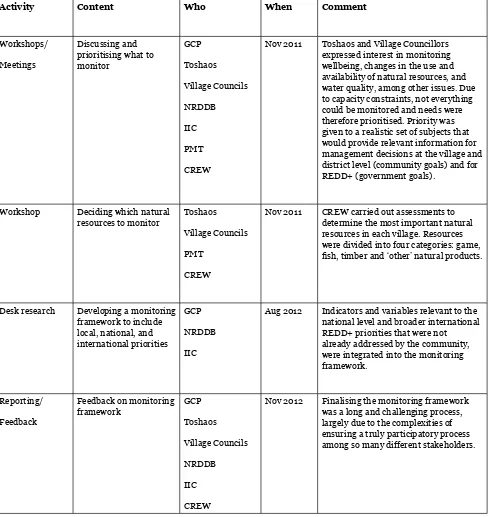
Table 2: Developing the monitoring framework
Activity Content Who When Comment
Workshops/ Meetings
Discussing and prioritising what to monitor GCP Toshaos Village Councils NRDDB IIC PMT CREW
Nov 2011 Toshaos and Village Councillors expressed interest in monitoring wellbeing, changes in the use and availability of natural resources, and water quality, among other issues. Due to capacity constraints, not everything could be monitored and needs were therefore prioritised. Priority was given to a realistic set of subjects that would provide relevant information for management decisions at the village and district level (community goals) and for REDD+ (government goals).
Workshop Deciding which natural resources to monitor
Toshaos
Village Councils PMT
CREW
Nov 2011 CREW carried out assessments to determine the most important natural resources in each village. Resources were divided into four categories: game, ish, timber and ‘other’ natural products.
Desk research Developing a monitoring framework to include local, national, and international priorities
GCP NRDDB IIC
Aug 2012 Indicators and variables relevant to the national level and broader international REDD+ priorities that were not already addressed by the community, were integrated into the monitoring framework.
Reporting/ Feedback
Feedback on monitoring framework GCP Toshaos Village Councils NRDDB IIC CREW
18
In order to contribute towards village and district level development plans on natural resource management, indicators on community wellbeing and changes in the use and availability of natural resources were highlighted as priorities and included in the monitoring framework (Table 3).
Given the agreements with Guyana Forestry Commission on developing activities for the Community Demonstration Site (CDS) that could inform a national MRV strategy, the project was tasked with the collection and provision of three principal data sets: (1) delivering regular reports on local drivers of deforestation and forest degradation at the community level; (2) performing ground truthing exercises as part of veriication activities to validate remote sensing data; and (3) providing carbon stock measurements on community-owned land for further validation purposes.
In addition to data (shown in Table 3 under ‘Forest Change’) required by the Guyana Forestry Commission as part of the Community Demonstration Site, the communities also decided to monitor other themes of interest such as natural resources and wellbeing.
Therefore, taking into account multi-stakeholder interests, the resulting monitoring framework focused on four key themes: natural resources, forest change, wellbeing, and project impacts. For each theme, indicators and methods for data collection were clearly deined. A monitoring plan, outlining what, how and when to monitor, was consequently agreed by all parties.
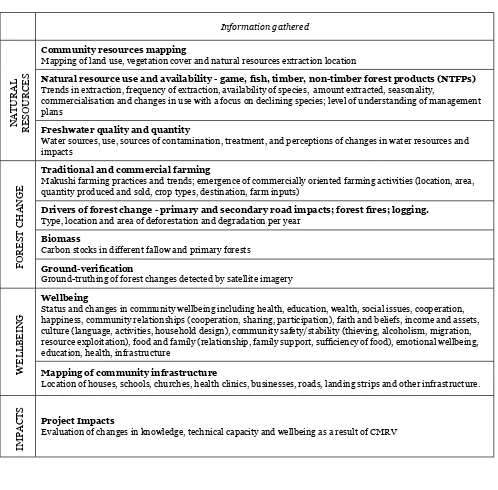
Table 3. Outline of monitoring framework
Information gathered
NATURAL
RESOURCES
Community resources mapping
Mapping of land use, vegetation cover and natural resources extraction location
Natural resource use and availability - game, ish, timber, non-timber forest products (NTFPs) Trends in extraction, frequency of extraction, availability of species, amount extracted, seasonality,
commercialisation and changes in use with a focus on declining species; level of understanding of management plans
Freshwater quality and quantity
Water sources, use, sources of contamination, treatment, and perceptions of changes in water resources and impacts
FOREST CHANGE
Traditional and commercial farming
Makushi farming practices and trends; emergence of commercially oriented farming activities (location, area, quantity produced and sold, crop types, destination, farm inputs)
Drivers of forest change - primary and secondary road impacts; forest ires; logging. Type, location and area of deforestation and degradation per year
Biomass
Carbon stocks in different fallow and primary forests Ground-veriication
Ground-truthing of forest changes detected by satellite imagery
WELLBEING
Wellbeing
Status and changes in community wellbeing including health, education, wealth, social issues, cooperation, happiness, community relationships (cooperation, sharing, participation), faith and beliefs, income and assets, culture (language, activities, household design), community safety/stability (thieving, alcoholism, migration, resource exploitation), food and family (relationship, family support, suficiency of food), emotional wellbeing, education, health, infrastructure
Mapping of community infrastructure
Location of houses, schools, churches, health clinics, businesses, roads, landing strips and other infrastructure.
IMPACTS
Project Impacts
3.2 HARNESSING TECHNOLOGY
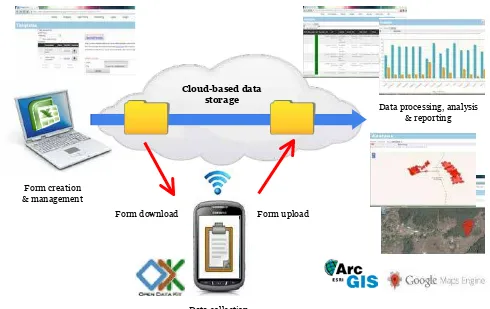
A key element of the project was the adoption of mobile phone technology for data collection, processing and reporting. After the community had tested of a number of different mobile phones, they selected to work with ruggedised Android (Samsung Galaxy X Cover) smartphones and Google’s Open Data Kit (ODK) software to collect and manage their data (igure 2). The Samsung phones were selected for their relatively low costs and high functionality (GPS12, screen size and battery life). ODK is open-sourced software that has a proven track record in other monitoring initiatives. The whole system relied on cloud storage (storage of digital data across multiple servers via the internet, managed by a hosting company) to enable quicker data sharing, unlimited storage and remote access from multiple locations.
The local project management team used Microsoft Excel to customise data collection forms for each of the different monitoring themes. The data collection forms were then converted to XML format and uploaded to the internet, from where they were downloaded by the community monitors onto the smartphones. These ODK forms enabled a variety of data to be collected, including point data and images, exploiting the integrated functionality of the smartphones, which included a GPS and camera. Data were then gathered ofline by the CREW and later uploaded to an online server where the data were processed and audited. Data were analysed by the PMT with differing levels of support from Iwokrama and GCP using a wide range of tools including Microsoft Excel, Arc GIS and Google Maps Engine. Separate reports were produced for the communities, the village councils and the GFC.
The technology used and the low of data within the monitoring system are illustrated in Figure 2.
Process, analyse and
report data
Create and
manage forms
Download
forms
Upload forms
Collect data
Cloud-based data storage
Figure 2. Technology use and data flows within the monitoring system
12 Global Positioning System.
Data processing, analysis & reporting
Form creation & management
Form upload Form download
20
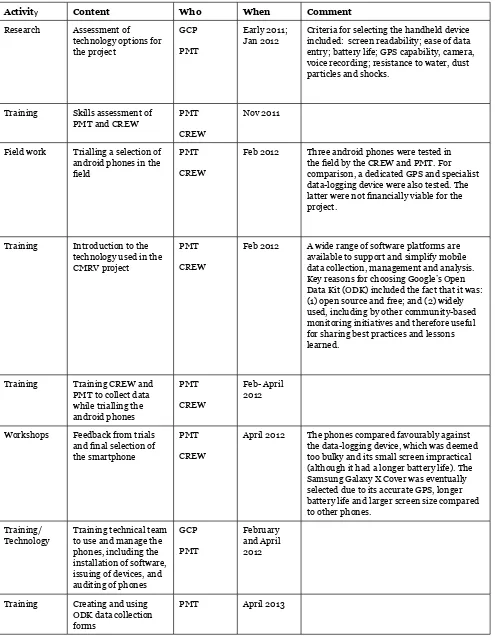
Table 4: Using digital technology for community-based monitoring
Activity Content Who When Comment
Research Assessment of technology options for the project
GCP PMT
Early 2011; Jan 2012
Criteria for selecting the handheld device included: screen readability; ease of data entry; battery life; GPS capability, camera, voice recording; resistance to water, dust particles and shocks.
Training Skills assessment of PMT and CREW
PMT CREW
Nov 2011
Field work Trialling a selection of android phones in the ield
PMT CREW
Feb 2012 Three android phones were tested in the ield by the CREW and PMT. For comparison, a dedicated GPS and specialist data-logging device were also tested. The latter were not inancially viable for the project.
Training Introduction to the technology used in the CMRV project
PMT CREW
Feb 2012 A wide range of software platforms are available to support and simplify mobile data collection, management and analysis. Key reasons for choosing Google’s Open Data Kit (ODK) included the fact that it was: (1) open source and free; and (2) widely used, including by other community-based monitoring initiatives and therefore useful for sharing best practices and lessons learned.
Training Training CREW and PMT to collect data while trialling the android phones
PMT CREW
Feb- April 2012
Workshops Feedback from trials and inal selection of the smartphone
PMT CREW
April 2012 The phones compared favourably against the data-logging device, which was deemed too bulky and its small screen impractical (although it had a longer battery life). The Samsung Galaxy X Cover was eventually selected due to its accurate GPS, longer battery life and larger screen size compared to other phones.
Training/ Technology
Training technical team to use and manage the phones, including the installation of software, issuing of devices, and auditing of phones
GCP PMT
February and April 2012
Training Creating and using ODK data collection forms
Training GIS training as part of the participatory community resource mapping
PMT IIC
Ongoing
Training Ongoing technical mentoring and remote support
GCP PMT CREW
Ongoing
Technology Internet set-up and management
GCP
IIC
Feb 2012 Providing internet access in remote areas at the speed required was expensive. As connectivity becomes more widespread it is hoped this cost will decrease, otherwise a move away from a cloud-based system is imminent.
Technology Set-up of cloud storage service
GCP Feb 2012 All data collected was to be stored in the cloud or in hard drives (e.g. computer discs). An audit log of all data sets exists and is continuously updated to keep track of information has been stored and that is arriving.
22
3.3. LOCAL CAPACITY BUILDING
Training and skills development
As part of efforts to build local capacity to independently run a monitoring system, the local project management team was given technical training in managing and using monitoring software and smartphone technology, in delivering workshops, training and outreach, and in processing and analysing data – a part of monitoring projects which is often carried out by external experts and facilitators.
Community monitors (CREW) were thoroughly trained in data collection methodologies for forest biomass assessments, ground truthing of forest change on community lands, and in techniques for conducting group discussions and household interviews for wellbeing and resource-use monitoring. Training also centred on building CREW capacity to communicate about the project and monitoring results in their villages.
This training curriculum followed a participatory approach that was adapted to the local situation and cultural context. Short and intensive training workshops (normally 3-5 days), with an emphasis on practical exercises, were delivered by a training team consisting of experts from GCP and IIC and other external consultants (in phase 2, this has been taken over by the project management team). Training activities were designed to help the PMT and CREW understand, test and familiarise themselves with the processes and provide feedback for improvements. These were followed up with regular remote support sessions to share know-how and address technical problems. The effectiveness of these training and skills development were later maximised through assessments of local staff capacity, which helped provide comprehensive training tailored to each team member. In addition to this, all project participants learned about relevant issues such as climate change, ecosystem services, MRV, the LCDS and FPIC.
Monitoring steps
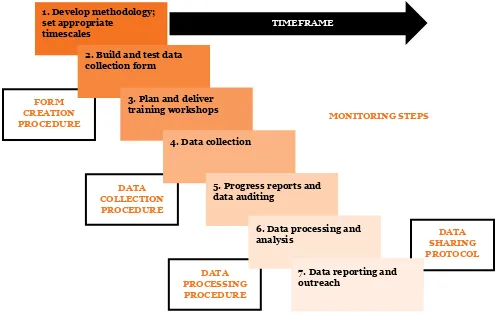
Within a monitoring cycle there were a series of steps and management roles for each of the project team members. To support training, a project monitoring worklow was developed which clariied the different steps, and the roles and tasks of each team member (Figure 3). The development of protocols and procedures for each of the main stages helped to improve the eficiency and management of the monitoring system and ield coordination.
Step 1, ‘developing the methodology and timeframe for each monitoring theme’, meant understanding data collection needs, logistical barriers, and deining the questions and architecture of the questionnaire form (step 2). Through a process of consultations and testing with local team members, more contextualised and easier to use ODK survey questionnaires were produced. While the process of building ODK forms was initially externally led, over time the local team acquired the skills and knowledge to lead on this.
Challenges
The technical skills required to audit, synthesise and analyse complex data were wide-ranging. Thanks to an easy-to-use ODK package for data management, the PMT was able to access and control this process with relatively little training. However, additional training and support from external GIS experts was still necessary.
While there are clearly advantages in using this technology, the management of android phones, unreliable internet connectivity and complications in adapting ODK software for forest monitoring purposes brought challenges and set-backs. Using a cloud-based system proved to be the biggest bottle-neck for data analysis and reporting back to communities. It should be noted that this problem has been overcome during Phase 2: data is being transferred to a laptop, which is moved from community to community, and which contains all of the software needed for data collection and management, without any need for internet. This has added beneits due to the fact that it gives project team more immediate access to the data, with project managers having the ability to analyse the data more quickly and give more frequent feedback to the monitors during the data collection process, improving the quality of the data.
Drawing a distinction between professional and personal use of the phones was sometimes challenging, as was the theft or damage of phones. Due to frequent software and hardware malfunctions, a member of the PMT was tasked with diagnosing problems, ixing damaged phones and ordering replacement parts.
Despite limited prior experience of technical tools or data analysis, the PMT and CREW embraced the opportunity to learn new technologies. They were inspired by the idea that they were breaking new ground and could share their know-how with other communities. The use of mobile phones also brought older members of the community, experienced in hunting or forests and farming, together with younger people more familiar with phones and information technology, with people of different age groups educating each other.
1. Develop methodology; set appropriate
timescales
FORM CREATION PROCEDURE
TIMEFRAME
DATA COLLECTION
PROCEDURE
DATA PROCESSING PROCEDURE
DATA SHARING PROTOCOL
2. Build and test data collection form
3. Plan and deliver training workshops
4. Data collection
5. Progress reports and data auditing
6. Data processing and analysis
7. Data reporting and outreach
MONITORING STEPS
24
4. MONITORING METHODOLOGIES AND ACTIVITIES
4.1 DATA COLLECTION
Tailored ODK questionnaires were created to collect data on following broad key themes: forest change, natural resources, wellbeing, and project impacts (see Tables 3 and 4 for details).
Community mapping
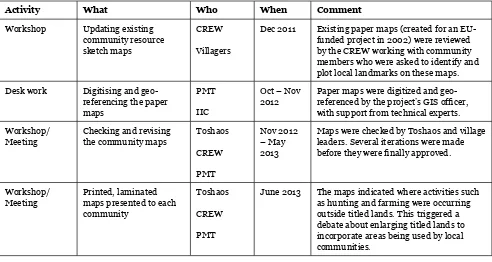
One of the irst activities as part of the monitoring framework was to map community lands in terms of land use, identifying burial sites, tourism zones, community infrastructure (e.g. roads, schools, and health posts), hunting grounds, ishing areas, farms, forest conservation areas, and titled lands. This was initially done using participatory mapping methodologies, working in groups with large paper maps to trace and identify these resources and landmarks. Drawn maps were then transferred to GIS. As the project progressed new data was collected and this was added to these maps.
The community mapping process is shown in Table 5. As described in the table, the laminated maps that were inally presented back to the individual communities indicated where activities such as hunting and farming were occurring outside titled lands, which triggered a debate about enlarging titled lands to incorporate areas being used by local communities – an example of the potential of community monitoring to inluence decision making.
Table 5. Participatory mapping of community resources
Activity What Who When Comment
Workshop Updating existing community resource sketch maps
CREW Villagers
Dec 2011 Existing paper maps (created for an EU-funded project in 2002) were reviewed by the CREW working with community members who were asked to identify and plot local landmarks on these maps. Desk work Digitising and
geo-referencing the paper maps
PMT IIC
Oct – Nov 2012
Paper maps were digitized and geo-referenced by the project’s GIS oficer, with support from technical experts. Workshop/
Meeting
Checking and revising the community maps
Toshaos CREW PMT Nov 2012 – May 2013
Maps were checked by Toshaos and village leaders. Several iterations were made before they were inally approved.
Workshop/ Meeting
Printed, laminated maps presented to each community
Toshaos
CREW PMT
June 2013 The maps indicated where activities such as hunting and farming were occurring outside titled lands. This triggered a debate about enlarging titled lands to incorporate areas being used by local communities.
Drivers of Forest Change
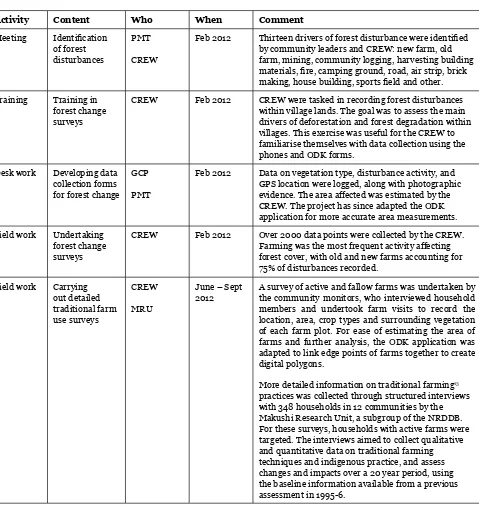
Table 6. Understanding forest change
Activity Content Who When Comment
Meeting Identiication of forest disturbances
PMT CREW
Feb 2012 Thirteen drivers of forest disturbance were identiied by community leaders and CREW: new farm, old farm, mining, community logging, harvesting building materials, ire, camping ground, road, air strip, brick making, house building, sports ield and other. Training Training in
forest change surveys
CREW Feb 2012 CREW were tasked in recording forest disturbances within village lands. The goal was to assess the main drivers of deforestation and forest degradation within villages. This exercise was useful for the CREW to familiarise themselves with data collection using the phones and ODK forms.
Desk work Developing data collection forms for forest change
GCP PMT
Feb 2012 Data on vegetation type, disturbance activity, and GPS location were logged, along with photographic evidence. The area affected was estimated by the CREW. The project has since adapted the ODK application for more accurate area measurements.
Field work Undertaking forest change surveys
CREW Feb 2012 Over 2000 data points were collected by the CREW. Farming was the most frequent activity affecting forest cover, with old and new farms accounting for 75% of disturbances recorded.
Field work Carrying out detailed traditional farm use surveys
CREW MRU
June – Sept 2012
A survey of active and fallow farms was undertaken by the community monitors, who interviewed household members and undertook farm visits to record the location, area, crop types and surrounding vegetation of each farm plot. For ease of estimating the area of farms and further analysis, the ODK application was adapted to link edge points of farms together to create digital polygons.
More detailed information on traditional farming13 practices was collected through structured interviews with 348 households in 12 communities by the Makushi Research Unit, a subgroup of the NRDDB. For these surveys, households with active farms were targeted. The interviews aimed to collect qualitative and quantitative data on traditional farming techniques and indigenous practice, and assess changes and impacts over a 20 year period, using the baseline information available from a previous assessment in 1995-6.
26
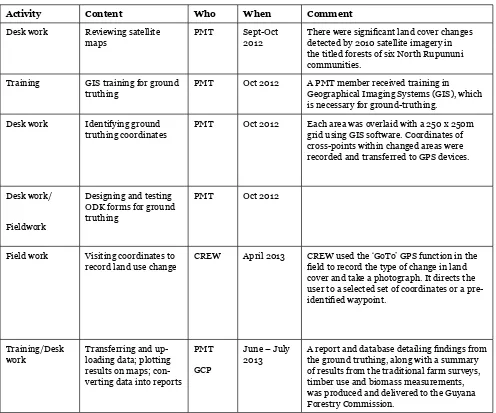
Ground truthing
In developing its national MRV system a key government focus is on improving the use of satellite data to increase the accuracy of forest change measurements. In this context, the project has the potential to play an important role in validating satellite data on forest change.
Community monitors ground-truthed government maps of forest change based on Landsat14 images from 1990 - 2010 in the Community Demonstration Site. A systematic sampling approach was used over a 250m grid within the areas of deforestation. Ground-truthing was carried out at each grid point by recording the land-use type, land-use activity and geo-location, and taking a photograph. Grid points that fell in mountainous areas were omitted as they were impractical to ground-truth. Monitors had to walk long distances to cover remote locations across a large area, making the survey time consuming and labour intensive. In the ield, each point was classiied as an active farm, a minab (fallow farm), ire, or no disturbance. The results were analysed by the local project management team using Arc GIS. A large disconnect was found between the indings of the survey and the Landsat dataset. Further investigation is needed to verify and understand these results.
14 Landsat is a major satellite imagery program. Table 7. Ground-truthing activities
Activity Content Who When Comment
Desk work Reviewing satellite maps
PMT Sept-Oct 2012
There were signiicant land cover changes detected by 2010 satellite imagery in the titled forests of six North Rupununi communities.
Training GIS training for ground truthing
PMT Oct 2012 A PMT member received training in Geographical Imaging Systems (GIS), which is necessary for ground-truthing.
Desk work Identifying ground truthing coordinates
PMT Oct 2012 Each area was overlaid with a 250 x 250m grid using GIS software. Coordinates of cross-points within changed areas were recorded and transferred to GPS devices.
Desk work/
Fieldwork
Designing and testing ODK forms for ground truthing
PMT Oct 2012
Field work Visiting coordinates to record land use change
CREW April 2013 CREW used the ‘GoTo’ GPS function in the ield to record the type of change in land cover and take a photograph. It directs the user to a selected set of coordinates or a pre-identiied waypoint.
Training/Desk work
Transferring and up-loading data; plotting results on maps; con-verting data into reports
PMT GCP
June – July 2013
Biomass measurements
Above-ground biomass measurements are important inputs for national forest inventories and in monitoring changes in forest carbon stocks. A biomass inventory was therefore undertaken to provide further biomass data for the national MRV system, as well as to provide communities with a better understanding of their forests under future REDD+ regimes. As part of efforts to test the eficacy of community MRV, and given that Guyana is already in the process of assessing biomass of different forest types at IPCC Tier 3 levels15, the project followed the methodology used by Winrock International16.
The activities carried out in order to conduct biomass measurements are described in Table 8.
Table 8. Biomass assessments
Activity Content Who When Comment
Desk work Reviewing satellite maps to identify forest type distribution
GCP PMT
Feb 2013 No detailed map of vegetation types exists for the region and therefore locally classiied vegetation types – high bush (primary forest), mixed bush (mixed forest) and low bush (secondary forest) – were identiied from satellite imagery. Training Introduction to biomass
assessments
PMT CREW
18 Feb 2013 The CREW and PMT were introduced to the concept of biomass, carbon cycles and the importance of
understanding carbon stocks and lows in the community under future REDD+ initiatives.
Training Biomass assessments - ield methods
PMT CREW
18-19 Feb 201 Random circular nested plots (0.125 ha each) in three types of forests (117 primary and secondary plots, and 128 biomass plots in fallow plots of four different age-classes) were identiied from satellite imagery and selected across the region.
Data on geo-location, tree species, diameter at breast height, and soil type were recorded in a specially designed smartphone ODK form, to inform future forest inventories.
Training/ Field work
Field work trials CREW 19-20 Feb 2013 As part of training, the CREW carried out sixteen biomass plot measurements in mature forest and fallow forests. Field work Plots made in each forest
type and fallow farms of different ages
CREW PMT
21-22 Feb 2013 The CREW assessed 117 plots in three mature forest types (high, mixed and low), and 128 plots in fallow forests of the four age classes chosen (5-10 years, 10-20, 20-30 and 20-30+ years since abandonment). Training Analysis of plot data PMT March 2013 Above ground biomass was then
calculated using the following allometric equation for moist forest stands.17
15 The IPCC Good Practice Guidance (Penman et al 2003) and Greenhouse Gas Inventory Guidelines (IPCC 2006) provide recommendations
on methods and default values for assessing carbon stocks and emissions at three levels of detail, ranging from Tier 1 (simplest to use) to Tier 3 (high resolution country-speciic methods, repeated through time).16 The Guyana Forestry Commission has recently adopted a methodology
and provided training on this to the North Rupununi project teams. 17 Chave, J.; Andalo, C.; Brown, S.; Cairns, M. A.; Chambers, J.Q.; Eamus,
28
Natural resources monitoring
Understanding natural resource availability and trends in extraction are of interest to Amerindian communities who rely on these resources for their livelihoods. The main activities carried out are shown in Table 9. Information was gathered on seasonality for hunting, ishing and harvesting, the importance of certain resources, preferred species, extraction methods and illegal activities. Among these themes, hunting, ishing, non-timber forest products and timber were identiied as priorities for monitoring.
Table 9. Natural resource monitoring
Format Content Who When Comment
Workshop Development of a participatory natural resource monitoring approach
PMT CREW
Aug 2012 The PMT were trained in a range of methodologies for natural resource monitoring, which included combining local knowledge with scientiic methods. The data collection strategy that was developed involved a combination of group and individual interviews with ‘top extractors’ – the households known to extract the most of each resource type in each village (these were identiied by the Village Councils). These ‘top extractors’ ranged in number from 1 to 24, averaging around 15 for each category and community.
Research Developing and testing ODK interview forms
GCP Aug-Sept 2012
ODK questionnaire forms were developed through initial discussions on indicators, questions and logistic with support from partners, PMT and CREW monitors.
Training Preliminary training in natural resource questionnaires using ODK
CREW Sept 2012
Field work CREW trial questionnaires CREW Oct 2012 Feedback/
Reporting
CREW feedback from ield trials
CREW Oct 2012
Training CREW trained in group interview techniques
CREW Nov 2012 This covered issues such as understanding interview questions and their relevance, different scenarios, and how best to explain the approach and methods.
Field work CREW undertaking group interviews
CREW Dec 2012 Group interviews (5-6 people) were conducted with village leaders, and top and average users of each resource. Information about seasonality for hunting, ishing and harvesting, the importance of certain resources, preferred species, extraction methods and illegal activities was recorded. This general background provided useful context for the more detailed information gleaned from individual interviews.
Training CREW trained in ODK questionnaires and individual interview techniques
CREW Jan 2013
Field work CREW conducting interviews with top extractors
CREW Jan-Feb 2013
30
Wellbeing monitoring
Understanding current socio-cultural issues in the communities, the negative and positive impacts from current infrastructure developments as well as wider environmental policies such as REDD+ requires baseline data. Beyond informing local development plans and development programmes, this information is valuable for safeguards. The main activities carried out to monitor wellbeing are described in Table 10.
Table 10. Monitoring wellbeing
Activity Content Participants When Comment
Workshop Deining the concept of wellbeing
CREW Oct 2012 From a local perspective, the concept of ‘wellbeing’ was deined as ‘being well’ or ‘having health or enough in all important aspects of life’.
Training Training in interview techniques
CREW MRU
Oct 2012 CREW were trained in sensitive interview techniques by the MRU and GCP support team. This included using dramatised role play, and sessions on how to explain the project and build trust, on body language.
Training Training in random sampling techniques
CREW Oct 2012 This workshop explored the importance of random sampling techniques, and the need to add constraints to sampling, such as ensuring that equal numbers of men and women in a set age range are interviewed.
Field work Trialling the pilot questionnaire, collecting feedback and inalising the survey
GCP MRU CREW
Oct 2012
Fieldwork Conducting the household wellbeing survey and Village Council consultation
CREW Nov 2012 – Jan 2013
4.1.1 CHALLENGES WITH DATA COLLECTION
Understanding natural resource availability and trends in extraction are of interest to Amerindian communities who rely on these resources for their livelihoods. The main activities carried out are shown in Table 9. Information was gathered on seasonality for hunting, ishing and harvesting, the importance of certain resources, preferred species, extraction methods and illegal activities. Among these themes, hunting, ishing, non-timber forest products and timber were identiied as priorities for monitoring.
Risks
Getting to isolated forest locations - often far from roads or tracks - was a major challenge. Safety concerns were raised by both the CREW and project management team, particularly regarding exposure to dangerous wildlife and transport breakdown.
Interview fatigue
Interview fatigue is a recurring problem in the villages that agreed to participate in the project. Some villagers refused to participate in more than one questionnaire; others expressed dissatisfaction with the process. This has been addressed by reducing the length and number of questionnaires, and distributing the interviews more evenly among villagers in each community. Where possible, interviews were kept to a maximum of one hour.
Further training was delivered to ensure every CREW member could explain the project’s objectives, the beneits for local communities, and the rationale behind the questionnaires. More frequent visits to the villages by the project management team, helped to assuage concerns about the project and encourage local participation.
Data compatibility and veriication
Integration of community-sourced data with any national system requires aligned data formatting and reporting, yet such compatibility is dificult to achieve. For example, there is no detailed vegetation map for the North Rupununi region and so locally classiied vegetation types of high bush (primary forest), mixed bush (mixed forest) and low bush (secondary forest) were adopted. However, for this data to be useful at the national level the biomass nomenclature must be harmonised with the forest types used by the government. Divergence between community and national deinitions – in particular on deforestation and vegetation types – reveals the greater challenge of linking indigenous knowledge systems of forests to national and scientiic classiications.
In addition, data collected on above-ground biomass still needs to be veriied by the government but falls within the expected range of previous estimations, and demonstrates that community monitors can successfully undertake these surveys. Furthermore, the data from the biomass plots, whilst this is just indicative, shows that these fallows hold valuable biomass which appears to increase over time.
4.2 DATA MANAGEMENT
Data processing and analysis
In many community-based monitoring projects data collection is often carried out by the local team, whereas data
32
Table 11. Data processing and management
Activit
y
Content
Who
When
Comment
Desk work/
Research
Data
processing
methodology
GCP
PMT
Sept
2010-
June
2013
Methods used to analyse and process the data
included:
- Downloading data from cloud storage
- Basic synthesis, iltering and initial
auditing of data using MS Excel,
- Top-level data assessment, with options
for feedback to CREW
- CREW assessment of the visual data
outputs using Google Earth Builder and
ArcGIS, to feed back for community
interest
- Data presented to NRDDB for analysis,
discussion, and decisions on sharing, in
accordance with the data sharing protocol.
Desk work/
Research/
Training
Automatic
templates for
initial data
visualisation
GCP
Oct
2012
Automatic templates for instant conversion
of data into graphs and maps were created for
some datasets, using MS Excel. The synthesis
of raw data into a more accessible visual
format prior to analysis helped to identify
incorrect data, anomalies and outliers (such as
duplication when CREW occasionally surveyed
the same area).
Training
Reviewing
process
for data
collection,
auditing,
synthesis,
reporting,
feedback and
sign-off
PMT
Feb –
April
2012
4.3 DATA SHARING AND REPORTING
Reporting and sharing monitoring results are the inal key steps in the monitoring system. Key activities are shown in Table 12.
Table 12. Reporting to stakeholders
Activity Content Who When Comment
Meeting/ workshop Reporting results with Toshaos, village leaders and project partners PMT Toshaos Jan, Apr, May, July 2013
Preliminary monitoring results for
wellbeing, forest change, farming practices, natural resources, and biomass/carbon were presented.
Reporting/ feedback
Progress report to MRVS Steering Committee
NRDBB March 2012, Sept 2012, Aug 2013
The local Project Manager sent regular progress reports to the MRVS Steering Committee. Project partners also gave a series of formal presentations to the MRVS Steering Committee.
Reporting/ feedback
Sharing interim results at public meetings in each community PMT CREW Nov 2012 March, April, May 2013
Sharing results with the participating communities is an ongoing process. The CREW and PMT provided regular updates and preliminary results at village meetings, creating opportunities to clarify project objectives and discuss current activities. This increased visibility and understanding of the project within local communities, and provided opportunities to address local concerns and communicate aims, outcomes and beneits with communities.
Reporting/ feedback Multi-media reports to communities PMT CREW Feb, March, April, May 2013
These included posters, newsletters, radio announcements, paper reports, and laminated community resource maps for each village.
Reporting/ feedback
Progress report to Guyana Forestry Commission NRDBB GCP IIC March 2013, Aug 2013
34
Data sharing protocol
In projects where many parties are involved - in this case local community members, government institutions and external NGOs - a clear process for sharing data is essential to ensure that the local community (the data owners) maintain control over how data is used and who can access it.
Given the vast amounts of sensitive data (e.g. on wellbeing) collected in this project, a data sharing protocol was necessary in order for all stakeholders to have an agreed common understanding, and a process to manage and share data collected. It would be important for making sure that data was stored and used in the most careful and considerate way, taking into account the concerns and decisions of the communities, and to effectively address any data sharing requests which might arise throughout the course of the project and thereafter. It would provide guidelines and rules for the use and sharing of data collected as part of project, covering data storage, classiication, ownership, and access to data.
The use of traditional decision-making structures helped ensure the respect of local property rights in sharing data. The NRDDB plays an important role in vetting publications related to North Rupununi and therefore all information and reports generated by the project needed to be approved by this body prior to dissemination. Ultimately, it is up