Sutarno1,2,4, A.J. Lymbery1,3, J.M. Cummins1,4 and RCA Thompson1,4
! "# $ % & "
' #( () ' $ '
* + %
Two regions of mitochondrial DNA, D-loop and ND-5 were characterized using polymerase chain reaction – restriction fragment length polymorphism (PCR-RFLP) involving 422 beef cattle of Hereford and composite breeds from Wokalup’s research station. ANOVA models (model I, II) were used to estimate associations between molecular haplotypes and quantitative traits. The phenotypic data used were records on calving rate, defined as the mean number of live calves born over four years, while the genotypic data used were the result of PCR-RFLP analysis in both regions of mitochondrial DNA using 7 restriction enzymes. The results of the present study have provided evidence that mitochondrial polymorphisms in the D-loop and ND-5 regions are associated significantly with fertility. This is the first report of a correlation between mitochondrial polymorphism in D-loop and ND-5 on fertility in beef cattle.
Key words: PCR-RFLP, bovine mitochondrial DNA, D-loop, ND-5.
There have been many recent attempts to evaluate cytoplasmic genetic effects as a source of variation in quantitative traits related to animal production. In dairy cattle, extensive mtDNA diversity has been found (Freeman, 1990; Hauswirth & Laipis, 1982; Koehler et al., 1991; Ron et al., 1990), and significant cytoplasmic effects have been reported for milk yield traits (Faust, Robison & McDaniel, 1990; Ron et al., 1992; Schutz et al., 1992; 1993; 1994). In beef cattle, however, mitochondrial DNA diversity has been less commonly reported and no significant effects on growth traits have been found (Tess & Macneil, 1994; Tess & Robison, 1990). Hiendleder et al. (1995a), however, suggested that the lack of evidence for cytoplasmic genetic effects on growth traits in beef cattle could be due to lack of mtDNA variation among the animal studied.
Mitochondrial DNA appears to evolve more rapidly than nuclear DNA in most species (Brown, 1980; Hutchison et al., 1974). Even though thousands of copies of the mitochondrial genome are present in each cell (Michaels, Hauswirth & Laipis, 1982), nucleotide substitutions accumulate approximately five to ten times faster than similar mutations in nuclear DNA (Brown, George & Wilson,
1979; Brown et al., 1982). Modification in mitochondrial DNA can have
Morgan-Hughes, 1988; Wallace et al., 1988). The first pathogenic mtDNA mutations identified were associated with Leber’s hereditary optic neuropathy
(LHON) disease (Wallace et al., 1988), myoclonic epilepsy and ragged-red fiber
(MERRF) disease (Shoffner & Wallace, 1990) and the Kearns-Sayre syndrome (Holt et al., 1988).
Many studies have suggested that cytoplasmic genetic effects influence growth, reproduction and production traits of livestock (Bell, McDaniel & Robison, 1985; Huizinga et al., 1986; Schutz et al., 1992; 1994; Tess, Reodecha & Robison, 1987). Maternal inheritance studies have indicated that 2-10% of the variation in milk and fat production in dairy cattle can be explained by maternal effects (Bell et al., 1985; Freeman, 1990; Huizinga et al., 1986; Ron et al., 1990). More direct associations between milk production traits and sequence variation in mitochondrial DNA have also been reported in dairy cattle (Ron et al., 1992; Schutz et al., 1993; 1994). Schutz et al. (1993) found a significant effect on fat percentage of milk of a substitution at base pair (bp) 169 of the D-loop sequence region. More recently, Schutz et al. (1994) found that nucleotide substitutions, especially at bp 169 and 16074 of the D-loop, have significant effects on milk, fat and solids-non-fat (SNF) yield, while substitution at bp 16085 of the D-loop has the largest impact on reproduction traits.
Brown (1985) indicated that the D-loop is the most variable region of mtDNA. The sequence variability is observed within species (Aquadro & Greenberg, 1983) and between species (Saccone, Attimonelli & Sbisa, 1987). Furthermore, D-loop variability is also observed within maternal lineages of cattle (Laipis, Van de Walle & Hauswirth, 1988; Olivo et al., 1983). Lindberg (1989) found 51 sequence differences, generally due to a single bp substitution, in 36 distinct registered maternal lineages.
The ND-5 region of mtDNA is one of the 7 subunits of the NADH-dehydrogenase complex (Anderson et al., 1982; Cantatore & Saccone, 1987; Smith & Alcivar, 1993) involved in oxidative phosphorylation. PCR-RFLP analyses in the ND-5 region have shown variability (Suzuki, Kemp & Teale, 1993). Recent studies indicate that mitochondrial genes which contribute subunits to the enzymes involved in respiratory-chain activities could influence growth in lambs via mitochondrial respiratory metabolism (Hiendleder et al., 1995a; Hiendleder, Herrmann & Wassmuth, 1995b).
The aim of this study was to evaluate the effects of mitochondrial D-loop and ND-5 polymorphisms on fertility trait in beef cattle.
!" !
!"#
$
%
&
! !
The trait used in association analyses was a calving rate (defined as the mean number of live calves born over four years).
!
'
%
!"
Mitochondrial DNA was extracted from white blood cells using the Wizard Minipreps DNA Purification System (Promega, Madison, USA). Mitochondrial pellets were prepared according to published methods (Welter et al., l989). 250µl white blood cells were homogenized in a clean microcentrifuge tube containing 1ml cold homogenization buffer (100mM Tris-HCl, pH 7.4; 250mM sucrose; 10mM EDTA). Nuclei and cellular debris were removed by centrifugation at 1500g for 10 minutes at 4oC. The supernatant was transferred to a clean microcentrifuge tube and a crude mitochondrial pellet was prepared by centrifugation in a microcentrifuge at 11,000g for 20 minutes at 4oC. The mitochondrial pellet was resuspended in 1ml TE buffer (10mM Tris HCl pH 7.5, 1mM EDTA), placed on ice for 10 minutes and repelleted at 11,000g for 20 minutes at 4oC. MtDNA was then purified from the pellet using the Wizard Miniprep protocol.
All PCR amplification reactions were performed in an Omnigene
thermocycler machine. The reactions were performed in a 50 ml reaction mix consisting of 200 ng of template DNA, 0.15 µM each of the oligonucleotide
primers, 200 µM each dNTPs, 2 mM MgCl2, 10x buffer and 1.5 units Taq DNA
polymerase (Biotech, Australia) in 0.6µl PCR reaction tube.
PCR products were used directly in the restriction endonuclease digestion. A master mix of each restriction enzyme, its buffer and water was made, and then aliquoted into each tube containing 7 µl of PCR products of the GH gene or 5 µl of amplified mtDNA fragments, and incubated as directed by the manufacturer.
BSA at a final concentration of 100µg/ml was used for many enzymes as directed
by the manufacturer.
Agarose gel electrophoresis was carried out using 1-2% of agarose (Promega) in TAE buffer (40mM Tris-HCl; 20mM Acetate; 2mM EDTA, pH adjusted to 7.9). Electrophoresis was performed using horizontal gels, in electrophoretic cells (Bio-Rad, Richmond, U.S.A). Ethidium bromide was included in the gel at a final concentration of 0.5µg/ml (Sambrook et al., 1989). After electrophoresis, DNA was visualized under UV-illumination and photographed using Polaroid type 57 film with a red filter.
! #
#
(
"
!
"
#
Genetic diversity, estimated by Nei’s gene diversity or expected
)
lines of each breed, using the method of Archie (Archie, 1985). Allelic frequencies for each locus were compared using X2.
##
!
!"&# #
Associations between molecular haplotypes and quantitative traits were estimated from 2 ANOVA models:
Model I: Yijklmn = µ + Bi + Sj + Lk + Dl + Ym + Gn + eijklmn
Where µ is the least square mean value, Bi is the effect of breed, Sj is the effect of sex, Lk is the effect of line (selected or control), Dl is the effect of the age of the individuals dam, Ym is the effect of year of birth, Gn is the effect of haplotype and eijklmn is the residual error.
Model II: Yijklmno = µ + Bi + Sj + Lk + Dl + Ym + Gn + Aijklmno + eijklmno Where µ is the least square mean value, Bi is the effect of breed, Sj is the effect of sex, Lk is the effect of line (selected or control), Dl is the effect of the age of the individuals dam, Ym is the effect of year of birth, Gn is the effect of haplotype, Aijklmno is a random animal effect, determined from the additive relationship matrix, and eijklmno is the residual error.
Differences in least square means between haplotype classes were determined by the F-test, with a comparison error rate of 0.05. Model I was implemented using the program JMP (SAS, 1989) and model II using PEST (Groeneveld, 1990; Groeneveld & Kovac, 1990). The major differences between the models was the addition of the relationship matrix in model II, which eliminates confounding between the effects of marker and non-marker genes among relatives. Preliminary analyses using the models identified no significant interaction effects between haplotype and other factors, and interactions were therefore not included in final analyses.
# " #
* V 0 1 1 V 0 1 2 V 0 1 3 V 0 1 5 V 5 1 9 V 5 2 0 1 0 0 b p m ar k er 600bp 100bp 1142bp
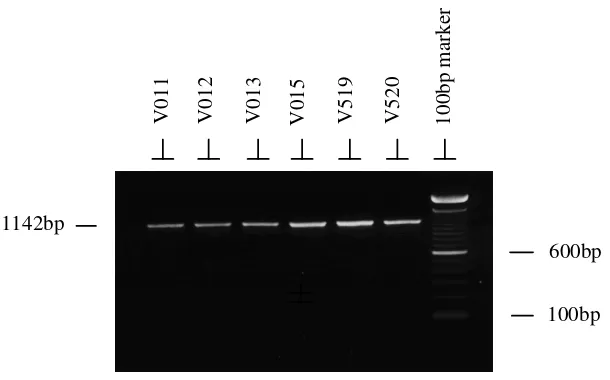
Figure 1. Photograph of an ethidium bromide stained agarose gel showing the specificity of the PCR products (1142 bp) representing the whole mitochondrial D-loop and flanking sequence at both ends amplified using primers D-L and D-R.
V 0 1 1 V 0 1 2 V 0 1 3 V 0 1 5 V 5 1 9 V 5 2 0 1 0 0 b p m ar k er 600bp 100bp 453bp
+ V 0 2 6 V 0 2 9 V 0 3 1 V 0 3 2 V 0 3 7 V 6 7 2 V 0 3 4 V 0 3 5 V 0 3 6 V 0 3 9 V 1 1 1 V 1 1 2 V 6 8 1 V 6 9 9 1 0 0 b p m ar k er 600bp 100bp 453bp 116bp 337bp
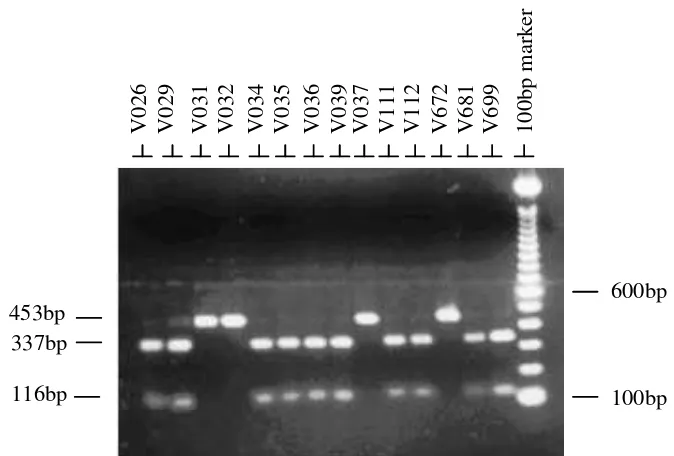
Figure 3. Gel photographs of an ethidium bromide stained agarose gel showing mitochondrial ND-5 polymorphism detected by PCR-RFLP using HindIII.
! #
'
"
!
" "
#
Comparisons of the genetic diversity between selected and control groups of composite and Hereford cattle are shown in Table 1. Table 2 shows the comparison of the allelic frequencies of selected and control groups between composite and Hereford cattle. There were no significant differences between groups at any locus.
Table 1. Comparisons of the genetic diversity of selected and control groups of composite and Hereford breeds. d is nucleotide diversity (average number of nucleotide substitutions per site within breeds).
Breeds Groups N d (Nei and Li)
Composite Selected 177 0.038908 + 0.015761
Control 58 0.049068 + 0.020182
Hereford Selected 138 0.055031 + 0.028593
Control 56 0.054549 + 0.028048
,
Breeds
Groups
D-loop
ND-5
TaqI PstI SspI ApaI AvaII HindIII SpeI
A B A B A B A B A B A B A B
Composite selected , ' , ' , ' ,, , ' , '
control - * - * - * - * - *
Hereford selected , * , * , * -, , * , *
control ' '& ' '& ' '& , - ' '& ' '&
''
'
-"
"&
% # #
Table 3 shows the least square mean values of each haplotype in the two D-loop polymorphisms for 4-year calving rate. Table 4 shows the probability of observing the differences in means between haplotypes under each ANOVA model. Differences in calving rate are significant under model I for the TaqI / PstI/ SspI polymorphism and almost significant under model II for both polymorphisms.
Table 3. Least square mean + S.E. of each haplotype in the two D-loop polymorphisms for calving rate (CR) in Hereford and composite cattle with different haplotypes.
Traits
TaqI / PstI / SspI
AvaII
A B A B
Calving rate (CR) 0.70 + 0.04 0.61 + 0.05 0.66 + 0.04 0.89 + 0.16
Table 4. Probability of observing the differences in means between haplotypes under each ANOVA model for calving rate (CR).
Trait
TaqI/PstI/SspI
AvaII
Model I Model II Model I Model II
Calving Rate (CR) 0.04 0.06 0.16 0.08
''
'
-*
"&
% # #
.
polymorphisms for 4-year calving rate. Table 6 shows the probability of observing the differences in means between haplotypes under each ANOVA model. Differences in calving rate are significant under model I and almost significant under model II.
Table 5. Least square mean + S.E. of each haplotype in ND-5 polymorphism for calving rate (CR) in Hereford and composite cattle with different haplotypes.
Traits
HindIII/ SpeI
A
B
Calving Rate (CR) 0.70 + 0.04 0.61 + 0.05
Table 6 Probability of observing the differences in means between genotypes under each ANOVA model. CR = calving rate.
Trait HindIII/ SpeI
Model I Model II
Calving Rate (CR) 0.04 0.06
#
##
!
" #
The analyses of the total data from both breeds of beef cattle in this study indicate that the female fertility is only trait (other traits nor shown) affected by variation in mitochondrial DNA, as measured by the mean number of calves born over a four year period. This trait is significantly affected by the TaqI/ PstI/ SspI polymorphisms in the D-loop region and the HindIII/ SpeI polymorphism in ND-5. The effect was present in both breeds and in both selected and control lines, although the strongest effect was found in Hereford selected animals (Table 7 & 8). This study failed to show any effect of mitochondrial polymorphism on any growth or milk production traits. Selection for increased daily gain in each breed had no influence on mtDNA diversity or on allelic frequencies at any of the polymorphic restriction sites.
Table 7. Least square mean + S.E. of calving rate in each haplotype of selected and control lines of Hereford and composite cattle.
Breed Group Least Square Mean
TaqI/ PstI/ SspI HindIII/SpeI
A B A B
/
Control 0.83 + 0.08 0.81 + 0.09 0.83 + 0.08 0.81 + 0.09
Hereford Selected 0.73 + 0.07 0.48 + 0.07 0.73 + 0.07 0.48 + 0.07
Control 0.76 + 0.05 0.68 + 0.07 0.76 + 0.05 0.68 + 0.07
Table 8. Probability of observing the differences in mean calving rate between genotypes under each ANOVA model.
Probability
Breed Group
TaqI/ PstI/ SspI HindIII/ SpeI
Composite Selected 0.09 0.09
Control 0.85 0.85
Hereford Selected 0.01 0.01
Control 0.24 0.24
In dairy cattle, the effect of cytoplasmic inheritance on measures of production and reproduction have been demonstrated (Bell et al., 1985; Huizinga
et al., 1986; Schutz et al., 1992). Recent studies conducted by Schutz et al. (1994) found that nucleotide substitutions in D-loop region have significant effects on milk, fat and solids-non-fat (SNF) yield and reproduction traits in dairy cattle. However, studies using simulated data (Kennedy, 1986; Southwood et al., 1989), and other studies using the same database but different approaches, have given contradictory results (Kirkpatrick & Dentine, 1989; Reed & Van Vleck, 1987).
In beef cattle, very view studies have evaluated the effects of cytoplasmic inheritance on production traits. Tess et al. (1987) reported cytoplasmic genetic effects on preweaning growth in two herds of Hereford cattle, and suggested that cytoplasmic effects were mediated through milk production. The results were further evaluated by Tess and Robison (1990) and Tess and MacNeil (1994) using a more statistically valid mixed model analysis, and the results failed to show that cytoplasmic genetic effects were important sources of variation for growth traits in beef cattle. Northcutt et al. (1991) also reported that preweaning performance was not affected by cytoplasmic variance.
01
since the amount of mtDNA per cell increases from about 0.1 pg in primordial cells to 4.5 pg in the preovulatory oocyte (Hauswirth & Laipis, 1985), and this distribution of mitochondria in the bovine oocyte has been suggested to be correlated with the hormonal patterns of both gonadotrophins and steroids (Hyttel, Callensen & Greve, 1986; Kruip et al., 1983). The D-loop is the site of transcriptional and replicational control (Anderson et al., 1982). Schutz et al. (1994) suggested that differences in production associated with sequence polymorphism in the D-loop region of mtDNA may relate to the control of mtDNA function. Recent studies have also suggested that D-loop polymorphisms may serve as indirect markers for differences elsewhere on the mtDNA genome in coding regions of genes directly affecting phenotypic expression of traits (Schutz et al., 1993; 1994).
In conclusion, the results of the present study have provided evidence that mitochondrial polymorphisms in the D-loop and ND-5 regions are associated significantly with fertility. This is the first report of a correlation between mitochondrial polymorphism in D-loop and ND-5 on fertility in beef cattle. Fertility is a lowly heritable trait and therefore difficult to improve through traditional phenotypic selection. The presence of a DNA marker may enable the rate of genetic improvement in fertility to be greatly increased.
Bibliography
Anderson, S., De Bruijn, M. H. L., Coulson, A. R., Eperon, I. C., Sanger, F. & Young, I. G. (1982). Complete sequence on bovine mitochondrial DNA: conserved features of the mammalian mitochondrial Genome. Journal of Molecular Biology156, 683-717.
Aquadro, C. F. & Greenberg, B. D. (1983). Human mitochondrial DNA variation and evolution: Analysis of nucleotide sequences from seven individuals.
Genetics103, 287-312.
Archie, J. W. (1985). Statistical analysis of heterozygosity data: independent sample comparisons. Evolution39, 623-637.
Bell, B. R., McDaniel, B. T. & Robison, O. W. (1985). Effects of cytoplasmic inheritance on production traits of dairy cattle. Journal of Dairy Science 68, 2038-2051.
Brown, W. M. (1980). Polymorphisms in mitochondrial DNA of humans as revealed by restriction endonuclease analysis. Proceeding of The National Academy of Science USA77, 3605-3609.
Brown, W. M. (1985). The mitochondrial genomes of animals. In Molecular Evolutionary genetics (ed. R. J. MacIntyre), pp. 95-130. Plenum Press, New York.
Brown, W. M., George, M. & Wilson, A. C. (1979). Rapid evolution of animal
mitochondrial DNA. Proceeding of The National Academy of Science
USA76, 1967-1971.
00 Molecular Evolution18, 225-239.
Cantatore, P. & Saccone, C. (1987). Organization, structure, and evolution of
mammalian mitochondrial genes. International Review of Cytology 108,
149-208.
Faust, M. A., Robison, O. W. & McDaniel, B. T. (1990). Animal model estimates cytoplasmic line constants for yields in Holsteins. Journal of Animal Breeding and Genetics107, 401-410.
Freeman, A. E. (1990). Cytoplasmic inheritance associated with economic traits-phenotypic and molecular differences. 4th World Congress on Genetics Applied to Livestock Production. Edinburgh, Scotland.14, 140-143. Groeneveld, E. (1990). PEST User Manuals. Institute of Animal Husbandary &
Animal Behaviour, Federal Agricultural Research Centre., Newstad - Germany.
Groeneveld, E. & Kovac, M. (1990). A generalized computing procedure for
setting up and solving mixed linear models. Journal of Dairy Science73,
513-531.
Hauswirth, W. W. & Laipis, P. J. (1982). Mitochondrial DNA polymorphism in
maternal lineage of Holstein cows. Proceedings of The National Academy
of Science, USA.79, 4686-4690.
Hauswirth, W. W. & Laipis, P. J. (1985). Transmission genetics of mammalian mitochondria: a molecular model and experimental evidence. In
Achievements and Perspectives of Mitochondrial Research (ed. E. Quagliriero, E. C. Slater, F. Palmieri, C. Saccone and A. Kroon), pp. 49-59. Elsevier Science Publisher, Italy.
Hiendleder, S., Herrmann, M., Dzapo, V. & Wassmuth, R. (1995a). Mitochondrial Respiratory Metabolism and Growth Performance Of
Lambs .1. Respiratory-Chain Enzyme Activities. Journal of Animal
Breeding & Genetics Zeitschrift fur Tierzuchtung und Zuchtungsbiologie 112, 373-380.
Hiendleder, S., Herrmann, M. & Wassmuth, R. (1995b). Mitochondrial Respiratory Metabolism and Growth Performance Of Lambs .2. Oxygen
Consumption and Oxidative Phosphorylation. Journal of Animal Breeding
& Genetics Zeitschrift fur Tierzuchtung und Zuchtungsbiologie112, 381-390.
Holt, I. J., Harding, A. E. & Morgan-Hughes, J. A. (1988). Deletions of muscle
mitochondrial DNA in patients with mitochondrial myopathies. Nature
331, 717-719.
Huizinga, H. A., Korver, S., McDaniel, B. T. & Politiek, R. D. (1986). Maternal effects due to cytoplasmic inheritance in dairy cattle, influence on milk production and reproduction traits. Livestock Production Science 15, 11-26.
Hutchison, C. A., Newbold, J. E., Potter, S. S. & Edgell, M. H. (1974). Maternal
inheritance of mammalian mitochondrial DNA. Nature251, 536-538.
Hyttel, P., Callensen, H. & Greve, T. (1986). Ultrastructure features of
preovulatory oocyte maturation in superovulated cattle. Journal of
Reproduction and Fertility76, 645-656.
0
production traits in dairy cattle. Journal of Dairy Science69, 3100-3105. Kirkpatrick, B. W. & Dentine, M. R. (1989). An alternative model for additive and cytoplasmic genetic and maternal effects of lactation. Journal of Dairy Science71, 2502-2507.
Koehler, C. M., Lindberg, G. L., Brown, D. R., Beitz, D. C., Freeman, A. E., Mayfield, J. E. & Myers, A. M. (1991). Replacement of bovine mitochondrial DNA by a sequence variant within one generation.
Genetics129, 247-255.
Kruip, T. A., Cran, D. G., Van Beneden, T. H. & Dieleman, S. J. (1983). Structural changes in bovine oocytes during final maturation in vivo.
Gamete Research8, 29-48.
Laipis, P. J., Van de Walle, M. J. & Hauswirth, W. W. (1988). Unequal partitioning of bovine mitochondrial genotypes among siblings.
Proceeding of the National Academy of Science, USA85, 8107-8110. Lindberg, G. L. (1989). Sequence heterogeneity of bovine mitochondrial DNA.,
Iowa State University.
Michaels, G. S., Hauswirth, W. W. & Laipis, P. J. (1982). Mitochondrial DNA
copy number in bovine oocytes and somatic cells. Developmental Biology
99, 246-251.
Nei, M. (1978). Estimation of average heterozygosity and genetic distance from a small number of individuals. Genetics89, 583-590.
Northcutt, S. L., Willham, R. L. & Wilson, D. E. (1991). Genetic parameters for nuclear and nonnuclear inheritance in three synthetic lines of beef cattle differing in mature size. Journal of Animal Science69, 4745-4753.
Olivo, P. D., Van de Walle, M. H., Laipis, P. J. & Hauswirth, W. W. (1983). Nucleotide sequence evidence for rapid genotype shifts in the bovine
mitochondrial DNA D-loop. Nature306, 400-402.
Reed, P. D. & Van Vleck, L. D. (1987). Lack of evidence of cytoplasmic inheritance in milk production traits of dairy cattle. Journal of Dairy Science70, 837-843.
Ron, M., Genis, I., Ezra, E. & Shani, M. (1990). Polymorphism of mitochondrial DNA in Israeli-Holstein cattle. 4th World Congress on Genetics Applied to Livestock Production. Edinburgh, Scotland14, 255-258.
Ron, M., Genis, I., Ezra, E., Yoffe, O., Weller, J. I. & Shani, M. (1992). Mitochondrial DNA polymorphism and determination of effects on economic traits in dairy cattle. Animal Biotechnology3, 201-219.
Saccone, C., Attimonelli, M. & Sbisa, E. (1987). Structural elements highly preserved during the evolution of the D-loop-containing region in vertebrate mitochondrial DNA. Journal of Molecular Evolution 26, 205-211.
SAS. (1989). JMP User's Guide, Version 2 of JMP. SAS Institute Inc., Cary, NC,
USA.
Schutz, M. M., Freeman, A. E., Beitz, D. C. & Mayfield, J. E. (1992). The importance of maternal lineage on milk production of dairy cattle. Journal of Dairy Science75, 1331-1341.
0$
maternal lineages grouped by mitochondrial genotypes on milk yield and composition. Journal of Dairy Science76, 621-629.
Schutz, M. M., Freeman, A. E., Lindberg, G. L., Koehler, C. M., Beitz, D. C., Bradley, D. G., Machugh, D. E., Cunningham, P. & Loftus, R. T. (1994). The Effect Of Mitochondrial Dna On Milk Production and Health Of Dairy Cattle Mitochondrial Diversity and the Origins Of African and European Cattle. Livestock Production Science37, 283-295.
Shoffner, J. M. & Wallace, D. C. (1990). Oxidative phosphorylation diseases:
disorders of two genomes. Advances in Human Genetics19, 267-380.
Smith, L. C. & Alcivar, A. A. (1993). Cytoplasmic Inheritance and Its Effects On Development and Performance. Journal of Reproduction & Fertility 48, 31-43.
Southwood, O. I., Kennedy, B. W., Meyer, K. & Gibson, J. P. (1989). Estimation of additive maternal and cytoplasmic genetic variances in animal models.
Journal of Dairy Science72, 3006-3012.
Suzuki, R., Kemp, S. J. & Teale, A. J. (1993). Polymerase Chain Reaction Analysis of Mitochondrial Dna Polymorphism in Ndama and Zebu Cattle.
Animal Genetics24, 339-343.
Tess, M. W. & Macneil, M. D. (1994). Evaluation of Cytoplasmic Genetic Effects in Miles City Line-1 Hereford Cattle. Journal of Animal Science 72, 851-856.
Tess, M. W., Reodecha, C. & Robison, O. W. (1987). Cytoplasmic genetic effects on preweaning growth and milk yield in Hereford cattle. Journal of Animal Science65, 675-684.
Tess, M. W. & Robison, O. W. (1990). Evaluation of cytoplasmic genetic effects in beef cattle using an animal model. Journal of Animal Science68, 1899-1909.
Van Blerkom, J. & Runner, M. N. (1984). Mitochondrial reorganization during
resumption of arrested meiosis in the mouse oocyte. American Journal of
Anatomy171, 335-355.
Wallace, D. C., Gurparkash, S., Lott, M. T., Hodge, J. A., Schurr, T. G., Lezza, A. M. S., Elsas II, L. J. & Nikoskelainen, E. K. (1988). Mitochondrial DNA mutation associated with Leber's hereditary optic neuropathy.