© 2012 Mili Publications
Keywords: plug flow, differential pressure, probability density function, autocorrelation, power spectral density.
DIFFERENTIAL PRESSURE FLUCTUATION OF PLUG
FLOW PATTERN GAS-LIQUID OF CO-CURRENT TWO
PHASE FLOW IN A HORIZONTAL PIPE
BUDI SANTOSOa,b, INDARTOc, DEENDARLIANTOc
and THOMAS S. WIDODOd
aDoctoral Student of The Department of Mechanical and Industrial Engineering
Faculty of Engineering Gadjah Mada University
Jl. Grafika No. 2 Yogyakarta, Indonesia E-mail: [email protected]
bDepartment of Mechanical Engineering Faculty of Engineering
Sebelas Maret University
Jl. Sutarmi 36A Surakarta 57126, Indonesia
cDepartment of Mechanical and Industrial Engineering Faculty of Engineering
Gadjah Mada University
Jl. Grafika No. 2, Yogyakarta 55281, Indonesia
dDepartment of Electrical Engineering and Information Technology Faculty of Engineering
Gadjah Mada University
Jl. Grafika No. 2, Yogyakarta 55281, Indonesia
Abstract
The study of two-phase flows has a great significance for several technological applications. In particular, gas-liquid two-phase flows are often encountered in a wide range of industrial applications, such as condensers, evaporators, distillation towers, nuclear power plants, boilers, crude oil transportation, and chemical plants. Gas-liquid flow is not only the most common of the two-phase flows but also the most complex since it combines the characteristics of a deformable interface with those of a compressible phase. The transportation of gas and liquid in conducts can lead to several topological configurations called flow patterns or flow regimes [8].
The intermittent gas-liquid flow pattern observed in horizontal pipes is commonly subdivided into two sub regimes-slug flow and plug flow. Most of the studies in this field have dealt with slug flow so the characteristics of the plug flow are not well-defined. Plug flow (or also called elongated bubble flow) occurs at very low gas velocities and consists of elongated gas bubbles that move along the top of the pipe. In plug flow, the gas phase is present in the form of elongated bubbles transported in an aerated continuous liquid phase in the upper half of the tube (It is also referred as elongated bubble flow by Mandhane et al. [4]). Plug Flow has a special feature of the gas phase to form pockets of gas to the boundary between gas and liquid.
The effort to identify the two-phase flow patterns have been made in the past by using the objective sensor response-based methods. The patterns of the variations and fluctuations of local absolute and differential pressures [3, 6, 9, 13], for example, have been found to be strongly regime-dependent. They found that the statistical characteristics (power spectral density, probability density function, auto and cross-correlation functions) of the pressure fluctuations are particularly attractive for the flow pattern classification. It is due to the required sensors which are robust, inexpensive, and relatively well-developed, and are thus more likely to be applied in the industrial systems.
The characteristics of pressure and differential pressure signal have been used also as the criterion for the flow pattern recognition of multiphase flow [1, 3, 6, 9, 10, 15, 16, 17] focused on the fluctuation characteristics of these parameters.
This work shows how the statistical analysis of a local quantity provides reliable tools for plug flow identification, which can be given an immediate physical interpretation. In this paper, the signals are acquired with differential pressure sensor in plug flow of horizontal pipe.
2. Experiments Apparatus and Procedure
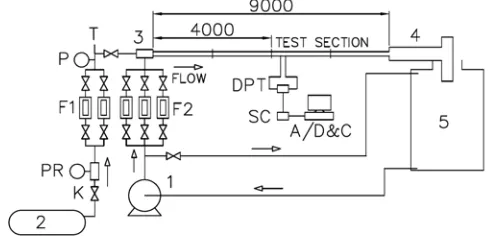
Figure 1. Experimental apparatus.
As shown in the figure, the differential pressure was detected at axially different two locations. It was measured by using a Validyne DP15-32 variable reluctance differential pressure transducer with interchangeable. The transducer has ±0.25% full scale accuracy. Output signals from transducer were sent through amplifier into a computer via A/D converter. Sampling rate was 400 Hz and the measuring time of experimental run was 50 s. The working fluids were air and water. The experiment conditions are as follows: the range of superficial air and water velocities; JG = 0.085-3.204m s, and those JL = 0.016-1.255m s.
3. Results and Discussions
3.1. Flow patterns
increased gas velocity, the magnitude of the waves increases. This condition is called slug flow. Ultimately, the waves build up and reach the upper wall of the tube to form some liquid packets, also liquid slugs. These liquid slugs are then transported at the higher velocity of the gas (Figure 2(c)). Unlike plug flow, in which the elongated bubbles of gas are transported by the liquid phase, in slug flow the liquid slugs are carried by the faster moving gas flow. The slug flow regime is highly undesirable in practical applications. The faster moving liquid slugs are usually associated with sudden pressure pulses and severe pressure oscillations that can cause damage to downstream equipment.
(a) Stratified flow
(c) Slug Flow
Figure 2. Typical results of the observed flow patterns.
Finally, the obtained flow pattern data are compared with the horizontal flow regime map of Mandhane et al. [4] as shown in Figure 3. Figure 3 indicates that the obtained flow pattern data are in agreement with those of Mandhane et al. [4].
Figure 3. Flow patterns map
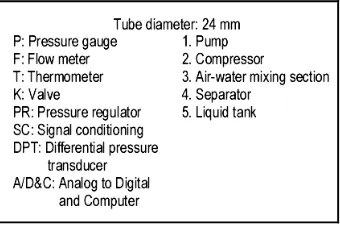
(a) The effect of gas velocity (b) The effect of liquid velocity
Figure 4. Time variations of the differential pressure.
3.2. Statistical analysis
3.2.1. Mean and standard deviation
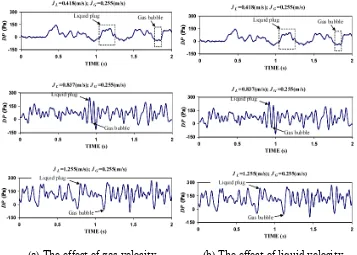
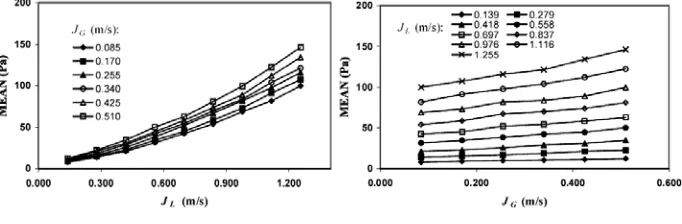
(a) The effect of the liquid velocity (b) The effect of the gas velocity
Figure 5. Mean of the differential pressure data.
(a) The effect of the liquid velocity (b) The effect of the gas velocity
Figure 6. Standard deviation of the differential pressure data.
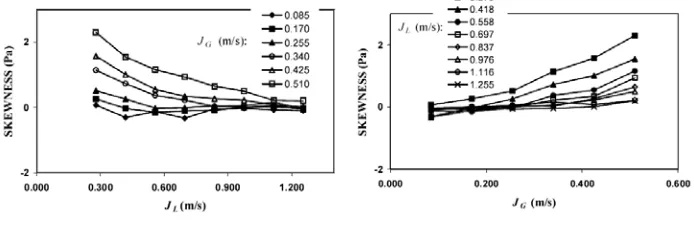
3.2.2. Skewness and Kurtosis
(a) The effect of the liquid velocity (b) The effect of the gas velocity
Figure 7. Skewness of the differential pressure data.
(a) The effect of the liquid velocity (b) The effect of the gas velocity
Figure 8. Kurtosis of the differential pressure data.
3.2.3. Probability density function (PDF)
Figure 9. Probability density function.
3.3. Chaos analysis
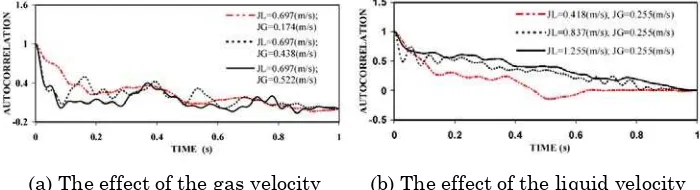
3.3.1. Autocorrelation analysis
Autocorrelation function is another signal processing tool used to identify chaotic motions. When a signal is chaotic, information about its past origins is lost. This means that the signal is only correlated with its recent past. The autocorrelation functions of the plug flows are shown in Figure 10. The autocorrelation functions for plug flows have a peak at origin delay time
( )
t = 0, and drop off rapidly with time, reflecting chaotic behavior. It can be observed from Figure 10 that the plug flows have different periodic oscillations along the time delay axis with the amplitude values of autocorrelation functions around zero.(a) The effect of the gas velocity (b) The effect of the liquid velocity
Figure 10. Autocorrelation of the differential pressure data.
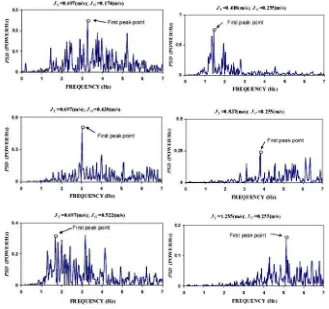
3.3.2 Power spectrum density (PSD) analysis
the gas and liquid velocities on the PSD. Close observation of the figure reveals that the distinct peaks appear between 0 and 7 Hz. These peaks indicate the existence of the elongated bubbles frequencies because the Fourier transform yields the energy density in an individual frequency. As can be seen in the figure, the major peaks move to high frequency with the increased of velocity.
(a) The effect of the gas velocity (b) The effect of the liquid velocity
Figure 11. Power spectral density of differential pressure.
4. Conclusion
linearly to the superficial velocity. The dispersity of probability density distribution is enhanced with increase of superficial gas velocity and increase of superficial liquid velocity. The application of the power spectral density (PSD) and autocorrelation functions indeed indicates the existence of chaotic behavior in the two-phase differential pressure measurement.
Acknowledgments
This work was supported by DP2M DIKTI (Directorate of Research and Public Service of Directorate General of Higher Education) Ministry of Education and Culture Indonesia through the Competitive Grant Research (Hibah Bersaing). DP : differential pressure (kPa); PDF : probability density function; PSD : power spectral density.
References
[1] F. Franca, M. Acikgoz, R. T. Lahey and A. Clausse, The use of fractal techniques for flow
regime identification, Int. J. Multi. Flow 17 (1991), 545-552.
[2] Jr. Jones and N. Zuber, The interrelation between void fraction fluctuations and flow
patterns in two-phase flow, Int. J. Multi. Flow 2 (1975), 273-306.
[4] J. M. Mandhane, G. A. Gregory and K. Aziz, A flow pattern map for gas-liquid flow in horizontal pipes, Int. J. Multi. Flow 1 (1974), 537-553.
[5] G. Matsui, Identification of flow regimes in vertical gas-liquid two-phase flow using differential pressure fluctuations, Int. J. Multi. Flow 10 (1984), 711-720.
[6] G. Matsui, Automatic identification of flow regimes in vertical two-phase flow using differential pressure fluctuations, Nucl. Eng. Des. 95 (1986), 221-231.
[7] O. J. Nydal, S. Pintus and P. Andreussi, Statistical characterizations of slug flow in horizontal pipes, Int. J. Multi. Flow 18 (1992), 439-453.
[8] E. C. Rogero, Experimental Investigation of Developing Plug and Slug Flows, 2010.
[9] Speeding and Spence, Flow regimes in two-phase gas-liquid flow, Int. J. Multi. Flow 19 (1993), 245-280.
[10] B. Sun and Y. Zheng, Hilbert-Huang Transform Analysis of Dynamic Differential Pressure Signal of Gas-liquid Two-phase Flow, Congress on Image and Signal Processing, IEEE, 2008.
[11] Tutu, Pressure fluctuations and flow pattern recognition in vertical two phase gas-liquid flows, Int. J. Multi. Flow 8 (1982), 443-447.
[12] G. B. Wallis, One Dimensional Two Phase Flow, Mc Graw-Hill Book Company, New York, 1969.
[13] J. Weisman, D. Duncan and J. Gibson, Effects of fluid properties and pipe diameter on two-phase flow patterns in horizontal lines, Int. J. Multi. Flow 5(6) (1979), 437-462.
[14] R. J. Wilkens and D. K. Thomas, A simple technique for determining slug frequency using differential pressure, J. Ener. Res. Tech. 130 (2008), 014501:1-6.
[15] H. Wu, F. Zhou and Y. Wu, Intelligent identification system of flow regime of oil-gas-water multiphase flow, Int. J. Multi. Flow 27 (2001), 459-475.
[16] T. Xie, Hydrodynamic Characteristics of Gas/Liquid/Fiber Three-Phase Flows Based on Objective and Minimally-Intrusive Pressure Fluctuation Measurements, Dissertation, Georgia Institute of Technology, 2004.