Team Based Learning as an Instructional Strategy:
A Comparative Study
DOI: 10.15804/tner.2017.50.4.11
Abstract
The use of Team Based Learning (TBL) as an instructional strategy in under-graduate health science curricula has been identified as a way to improve student learning outcomes� However, comparative studies of the use of TBL in business subjects in different countries are rare� This research is a first step to provide comparative quantitative empirical evidence for the usefulness of TBL, leading to continuous improvement in the learning process� It compares the results of Indonesian and Australian students in two different business classes� The finding reveals that TBL has some usefulness in enhancing student learning outcomes in business subjects�
Keywords: team based learning, instructional strategy, learning outcome, read-iness assurance
Introduction
Indonesian higher education faces issues in its teaching and learning process in order to improve its education standards and student proficiency outcomes� Thus, most universities in Indonesia are trying to improve the quality of their graduates� Specifically, simply passing a course is no longer sufficient; students need to play more active roles during the learning process� This problem also takes place in Australia� From the literature reviewed on the learning issues in the higher education in Australia (Tobias, 1990; Gibbs, 1992; Biggs, 1999; Graham,
Bens Pardamean, Harjanto Prabowo,
Hery Muljo, Teddy Suparyanto
Indonesia
Eryadi Masli, Jerome Donovan
Australia
2006; Blackwell, 2011; Sharma, 2011), it can be said that currently one of three emerging trends is the need to engage students in the learning process�
Currently, most of the teaching and learning activities are based on the tradi-tional didactic method, which is a combination of lecture, case study seminar and/ or tutorial� The lecturer imparts his/her knowledge to students by standing up at the front of the classroom, and teaches, explains concepts, facts and other learning contents� As lecture time is limited, students will listen, absorb and memorize what the lecturer has said� Some activities, such as homework, review of questions and concepts and other activities, will complement the teaching activities during a tutorial� Students are more or less passive participants in the learning process, except for a presentation session during a case study seminar� Like other physical sciences, business-related courses require students to master technical as well as non-technical competences� Tobias (1990) showed that many capable students in introductory physical science courses are dissatisfied with the passive role that the lecture method imposes on them� When teaching business-related courses, it is a tradition to rely on the text as a primary information source� Students are urged to read the text, but many do not do so� As a result, the lecturer spends more time in organizing and clarifying the text information to students� In this approach, students are less engaged in the learning process� The learning and teaching activities are more inclined to the teacher-controlled category (Biggs, 1999)� This traditional didactic method of teaching business-related courses does not maximize the potential of students in learning and understanding the teaching materials� The focus of this type of didactic instruction is learning about concepts and ideas� However, we are of the opinion that an effective teaching method should make students active participants in the learning process� The focus of instruction here is learning how to use concepts and ideas in meaningful ways� Gibbs (1992) has defined a deep approach to learning: “the student attempts to make sense of what is to be learnt, which consists of ideas and concept [and] involves [the student in] thinking, seeking integration between components and between tasks, and ‘playing’ with ideas”� This is not only to motivate capable students to be higher performers, but also to bring out ‘the potential’ of the ‘not-so-capable’ students to master the basic technical as well non-technical competency in business-related courses�
time is spent working in teams on an application of their knowledge to a problem relevant to their learning�
The research presented in this paper is a first step to provide comparative quantitative empirical evidence for the usefulness of TBL, leading to continuous improvement in the learning process. The research is based on the analysis of RAP (Readiness Assurance Process) test results, which is part of the TBL process, and final exam� This research used data from the undergraduate-level of International Business Strategy (INB30020) unit at Faculty of Business and Law, Swinburne Uni-versity, Hawthorn campus (SUT), Australia, and Basic Accounting (ACCT6087) at Bina Nusantara University (BINUS), Jakarta, Indonesia�
Structure of Team-Based Learning (TBL)
The primary learning objective in TBL is to achieve beyond simply covering content, and shift the focus towards ensuring that students have the opportunity to practice course concepts via problem solving� Thus, TBL is designed to provide students with both conceptual and procedural knowledge (Michaelsen & Sweet, 2008)� Although a portion of the classroom time is still spent ensuring that students master the course content, the vast majority of class time is devoted to team assignments that focus on problem-based learning by simulating complex questions that student will face as the course develops�
In a TBL course, students are strategically divided into permanent groups for the term, and the course content is typically divided into five to seven major units� Before any in-class content work, students must study assigned materials since each unit begins with the readiness assurance process (RAP), which consists of a short test on key ideas from the readings that students complete individually� Subsequently, students work on the test as a team, coming to consensus on team answers� Immediate feedback is given on the team test, allowing for the opportu-nity to write evidence-based appeals and valid arguments for incorrect responses� The final step in the RAP is short and lecture-specific to clarify any common misunderstandings found within the team test and appeals� Upon completion of the RAP, the remainder of a learning unit is mainly devoted to in-class activities and assignments that require students to practice using the course content�
Shifting from simply familiarizing students with course concepts to requiring that students use those concepts to solve problems is no small task (Michaelsen & Sweet, 2008)� The realization of this shift requires changes in the roles of both the instructor and the students� The instructor’s primary role shifts from dispensing
information to designing and managing the overall instructional process� On the other hand, the students’ role shifts from being passive recipients of information to active responding to initial exposure to the course content during the process of preparing for in-class teamwork� Changes of this magnitude do not happen automatically and may even seem improbable� They are, however, achievable when the four essential elements of TBL are implemented successfully (Michaelsen & Sweet, 2008):
• Teams: groups of students must be properly formed and managed
• Accountability: students must be accountable for the quality of their indi-vidual and group work
• Feedback: instructors must provide frequent and timely feedback to stu-dents
• Assignment design: group questions must promote learning and team developments
When these four elements are implemented in a course, the stage is set for student groups to evolve into cohesive learning teams (Michaelsen & Sweet, 2008)�
Methodology
The research only considered two variables to measure learning effects: Individ-ual Reading Assurance Test (IRAT) and EXAM, final exam performance (Figure 1)�This research used data from International Business Strategy (INB30020) unit at Swinburne University of Technology (SUT), Faculty of Business and Enterprise at Hawthorn campus, Australia; and Basic Accounting (ACCT6087) at Bina Nusantara University (BINUS), Jakarta, Indonesia�
Interna-tional Financial Reporting Standards (IFRS) conceptual framework� Through the research period, both classes employed Team Based Learning (TBL) as a learning and teaching method� The TBL method requires students to prepare before the lecture starts� TBL always starts with a test corresponding chapter to be discussed, and it is a highly significant difference compared to traditional methods� The TBL method also resulted in the formation of the mindset of the students more active in learning�
During the semester, under the TBL method, all students were required to take a Readiness Assurance Test (RAT), which was part of the Readiness Assurance Process (RAP)� Before the students came to the class for RAP, they had to get prepared, either read the prescribed chapters from textbooks or listen to basic lectures via Camptasia� The aim of RAP is to make sure students understand the basic concepts of the learning materials before they learn advanced concepts in class� Initially, the students took the tests individually (which is called IRAT), and then as a group of 4 or 5 students they worked on the same questions to find the correct solutions (GRAT)� The tests were multiple choice ones� After the IRAT and GRAT, students receive feedback from the instructor for the basic concepts that they have not mastered fully� The benefit of this process is that the students get
instant feedback, which helps them to acquire knowledge and skill more quickly and “most probably at a higher level” (Gregory, Uys & Gregory, 2014)� Also, effec-tive and timely feedback can improve learning outcomes (Fyfe, 2010)�
As seen in Figure 1, this study investigated whether IRAT (as part of TBL) has any impact on Final Exam� The Final Exam is one of the formal methods to evaluate student learning outcomes (Office of Planning and Assessment, 2017), and it represents demonstration of the integration of learning outcomes for the unit (Williams & Wong, 2009)�
Results
As part of TBL, the Readiness Assurance Process (RAP) was conducted three times a semester (12 weeks)� The students performed the Readiness Assurance Test individually in 15 minutes prior to formal learning and teaching activity in the classroom (in Weeks 3, 7, and 11), called Individual Readiness Assurance Test (IRAT)� In each IRAT, there were 15 MCQs (Multiple Choice Questions), of which 20% were in the “easy” category, 30% at the “medium” level, and 50% at the “hard” level� The materials for the MCQs were taken from the textbook and each IRAT covered 4 chapters� After the completion of the IRAT process, the students worked in teams to answer the problems in RAT� They were the same MCQs as in IRAT� It was called a Group Readiness Assurance Test (GRAT)� Each question in RAT was worth 4 points; the maximum scores of IRAT and GRAT were 60, and then they were converted into 100 for comparison purposes� Data for INB30020 were taken from the 2nd semester of 2013 (INB30020 – 2/2013) and the 1st semester of 2014 (INB30020 – 1/2014)� Table 1 shows the Mean and Standard Deviation of each IRAT result, whereas Table 2 shows the mean and standard deviation of each GRAT result�
Table 1. Mean and Standard Deviation (SD) of IRAT for INB30020
Course N IRAT
1 2 3
INB30020 – 2/2013 52 56�57 (17�30) 67�83 (15�46) 55�39 (16�74)
INB30020 – 1/2014 44 56�39 (17�36) 70�98 (10�80) 57�19 (15�09)
In Table 1, the highest mean was in IRAT 2 of INB30020 – 1/2014, i�e�, 70�98 (10�80), and the lowest in IRAT 3 of INB30020 – 2/2013, i�e�, 55�39 (16�74)� For IRAT 1, the results were almost identical for both classes (56�57 vs 56�39)� However, the means of IRAT 2 and IRAT 3 in INB30020 – 1/2014 were higher than INB30020 – 2/2013� The highest mean was in IRAT 2, both in classes of
INB30020 – 2/2013 and INB30020 – 1/2014 (67�83 and 70�98, respectively)� Mean-while, the mean of IRAT 1 and 3 in both classes were in the range of 55�39 – 57�19�
Table 2. Mean and Standard Deviation (SD) of GRAT for INB30020
Course N GRAT
1 2 3
INB30020 – 2/2013 52 83�38 (8�78) 92�36 (6�89) 90�44 (6�37)
INB30020 – 1/2014 44 78�88 (12�80) 90�20 (5�11) 78�47 (10�99)
According to Table 2, the highest mean was in INB30020 – 2/2013, i�e�, 92�36 (6�89), and the lowest mean was in GRAT 3 in INB30020 – 1/2014, i�e�, 78�47 (10�99)� According to Tables 1 and 2, the mean of each GRAT from both classes was always higher than IRAT�
The data for ACCT6087 was taken from LD21 and LF21 classes in Semester 2, 2015� The LD21 class consisted of 23 students and LF21 of 43 students� The Readiness Assurance Test (RAT) was conducted five times a 15-week semester� The RATs were conducted in the first 6 weeks (i�e�, weeks 2, 3, 4, 5, and 6), before the mid-term exam� In each IRAT, there were 10 MCQs (Multiple Choice Ques-tions), of which 20% were in the “easy” category, 30% at the “medium” level, and 50% at the “hard” level� Each question was worth 4 points; the maximum scores of IRAT and GRAT were 40, and then they were converted into 100 for comparison purposes� The materials for MCQs were taken from the textbook, which was in English, and each IRAT covered 1 chapter� Table 3 shows the mean and standard deviation of the overall IRAT, whereas Table 4 shows the mean and standard deviation of the overall GRAT�
Table 3. Mean and Standard Deviation (SD) of IRAT for ACCT6087
Course N IRAT
As presented in Table 3, the highest mean was in IRAT 1 of LD21, i�e�, 96�27 (6�91), while the lowest in IRAT 2 of LF21, i�e�, 15�94 (9�37)� The mean of IRAT 1 to 4 of LD21 was always higher than LF21� However, the mean in IRAT 5 of
LF21, i�e�, 70�38 (16�77), was higher than LD21 (65�34)� The highest mean of LF21 occurred in IRAT 5, i�e�, 70�38 (16�77), while in LD21 it was in IRAT 1 (96�27)� The lowest mean in the IRAT for both classes was in IRAT 2 (15�94 and 29�17)� Interestingly, for LF21, the mean IRAT 5 increased significantly from 26�63 in IRAT 4 to 70�38� Yet, in LD21, the mean of IRAT 4 and 5 did not change very much (65�55 and 65�34)�
Table 4. Mean and Standard Deviation (SD) of GRAT for ACCT6087
Course N GRAT
In Table 4, the highest mean in LD21 was 100, meaning that all the groups received the maximum score� On the other hand, the lowest mean was in GRAT 2 of LD21, i�e�, 59�79� Generally, except for GRAT 2 of LD21, the mean of GRAT for both classes was over 60�
Discussion
Table 5. Mean and Standard Deviation (SD) of IRAT and GRAT for the class combination of INB300200 at SUT
Class Combination of INB30020 – SUT Mean (%) SD (%)
N = 96 IRAT 1 56�33 17�53
IRAT 2 69�43 13�49
IRAT 3 56�11 16�00
GRAT 1 81�13 11�23
GRAT 2 91�50 5�68
GRAT 3 84�60 10�53
Mean of Final Exam 66�12 13�21
Mean-IRAT 60�62
In INB30020, each IRAT was worth 5% (totaling 15%), and the final exam was 40% of total mark� On the other hand, for ACCT6097, each IRAT was worth 3% (totaling 15%), and the final exam was 50% of total mark� As stated above, in INB30020, RAT was conducted three times in a 12-week semester� There was no mid-term exam� The final exam was conducted 2 weeks after the end of the semester� However, for ACCT6067, in a 15-week semester, RAT was conducted five times in the first 6 weeks, prior to the mid-term exam, which was conducted in week 8� As this study was to investigate the impact of IRAT on the final exam, the paper will not report on the relationship between IRAT and the mid-term exam�
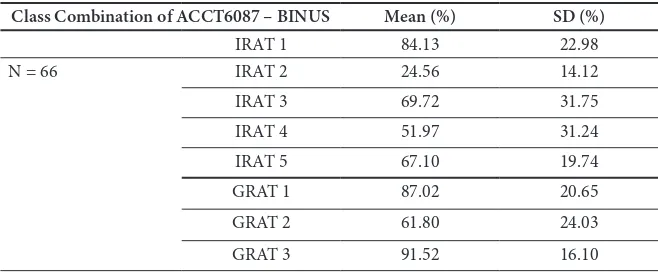
Table 6. Mean and Standard Deviation (SD) of IRAT and GRAT for the class combination of ACCT6087 at BINUS
Class Combination of ACCT6087 – BINUS Mean (%) SD (%)
IRAT 1 84�13 22�98
N = 66 IRAT 2 24�56 14�12
IRAT 3 69�72 31�75
IRAT 4 51�97 31�24
IRAT 5 67�10 19�74
GRAT 1 87�02 20�65
GRAT 2 61�80 24�03
GRAT 3 91�52 16�10
Class Combination of ACCT6087 – BINUS Mean (%) SD (%)
GRAT 4 82�12 22�70
GRAT 5 90�49 13�54
Mean – Final Exam 60�70 17�42
Mean – IRAT Mean – last 3 IRAT
59�50 62�93
Tables 5 and 6 present interesting findings:
1� In both units (INB30020 and ACCT6087), GRATs were always higher than IRAT� This result confirms that working in a team students perform better than individually�
2� The means of IRAT for both classes are almost similar: 60�62 for BUS30020, and 59�50 for ACCT6087� For BUS 30020, IRAT 2 was significantly higher than IRAT 1, and then dropped again to the level similar to IRAT 1 (56�33 and 56�11)� Is it possible that IRAT 3 is not sustained at a higher level (at least at the level similar to IRAT 2) due to students’ workload? IRAT 3 was conducted in week 11, which was one week before the final week in a 12-week semester� Usually, during the last three weeks of a semester, more tasks and assignments are due� Students have to submit their reports; and some have to make presentations� Thus, students possibly lack the time to read and understand the prescribed chapters for RAT� This needs further investigation�
3� On the other hand, for ACCT6087, the movement was quite erratic� It started with a very high mean (84�13) and dropped drastically to 24�56, and then went up, down and up, but not up to IRAT 1 level� However, if the first two RAT results were taken out, the last three IRAT results proved less volatile; they ranged from 51� 97 to 69�72� The mean of the last three IRATs was 62�93, which was higher than the average of the final exam� This is quite interesting as the IRATs were conducted in the first half-semester, and the final exam covered the material from the second half-semester� It will be intriguing to see whether IRAT will have any impact on the mid-term exam� Furthermore, if IRATs were conducted throughout a semester, not just in the first half-semester, will the mean of the final exam result improve? Further design of assessments may be required�
the final exam, albeit increasing� One of the possible explanations is that for the ACCT6087, the basic accounting unit is the first of the accounting courses that the students took since they had finished high school� Thus, the average final exam was quite low, slightly above 60� On the other hand, for BUS30020, the unit was the third year class� The class consisted of the first and second years of the international business course� Thus, the students were more familiar with the contents and basic concepts�
Conclusion
The purpose of this study was to investigate the impact of IRAT, which is part of the Team-Based Learning method, on learning outcomes� In this comparative study between Australian and Indonesian students, the conclusion is encouraging� The data showed that the students, especially those from Australia, had made worthwhile improvement in their academic performance� For the Australian students, who studied INB30020, the mean of the IRAT results was 60�62, and the final exam result was 66�12, i�e�, an increase of 9%� However, for the Indonesian students who enrolled in ACCT6087, the result was not different, around 60� One of the reasons could be the way TBL was conducted� Unlike in the INB30020 class, the ACCT6087 employed TBL (including IRAT) only in the first half of the semester� However, further research is recommended �
Acknowledgment
This work was supported by a research grant in International Cooperation and Interna-tional Publication provided by the Directorate of Research and Community Services of the Republic of Indonesia’s Ministry of Research, Technology, and Higher Education, in collaboration with Swinburne University of Technology, Australia�
References
Biggs, J� (1999)� What the Student Does: teaching for enhanced learning, Higher Education Research & Development,18(1), 57 – 75�
Blackwell, A� (2011)� Online is not always fine for Gen Y student, Campus Review, 21 (2), 8 February�
Fyfe, G� (2010)� The final examination: a squandered opportunity for feedback to students
or a poor use of time?, ATN Assessment Conference 2010: Assessment: Sustainability, Diversity and Innovation, Sydney, 18 – 19 November 2010�
Fink, L D� (2004)� Creating significant learning experiences: An integrated approach to designing college courses, San Francisco: Jossey-Bass�
Gibbs, G� (1992)� Improving the Quality of Student Learning, Bristol: TES�
Graham, C�R� (2006)� Blended learning Systems: Definition, Current Trends, and Future Directions� In C�J� Bonk and C�R� Graham (Eds�), The Handbook of Blended Learning: Global Perspectives, Local Designs� San Francisco: Pfeiffer, 3 – 21�
Gregory, B�, Uys, P�, & Gregory, S� (2014)� The role of instant feedback in improving student understanding of basic accounting concepts, Rhetoric and Reality: Critical Perspectives on Educational Technology�
Michaelsen, L K� (2004)� Getting started with team-based learning� In L�K� Michaelsen, A B Knight and L D Fink (Eds), Team-based learning: A transformative use of small groups on college teaching, Sterling, Virginia Stylus: 209 – 228�
Michaelsen, L�K�, & Sweet, M� (2008)� The Essential Elements of Team-Based Learning� New Directions for Teaching and Learning, 116, 7 – 21�
Office of Planning and Assessment, Writing and Assessing Course-Level Student Learning Outcomes� Retrieved from https://www�depts�ttu�edu/opa/resources/ docs/writing_learning_outcomes_handbook3�pdf, Accessed 21 January 2017�
Sharma, A� (2011)� Close the lecture theatres, The Age, 25 May�
Tobias, S� (1990)� They’re not dumb� They’re different: A new ‘tier of talent’ for science� Change 22(4): 11 – 30�