http://www.jurnal.unsyiah.ac.id/JInoMan
FACTORS AFFECTING REVISIT
INTENTION WITH CUSTOMER
SATISFACTION AS A MEDIATING
VARIABLE IN ECO FRIENDLY RESORTS
SYAFRUDDIN CHAN
Faculty of Economics and Business, Syiah Kuala University Corresponding email: [email protected]
Abstract
this study aimed to observe the effect of concern environment, physical and social environment as an independent variable that affects revisit intention with customer satisfaction as a mediating variable. Questionnaires distributed in eco-friendly resort in Sabang Zone, Indonesia, which is a recreational diving center in western part of Indonesia, using probability sampling techniques. Data were collected and then be analyzed using covariance Based SEM, AMOS. Hypothesis test results proved that there were positive and significant influence among five variables examined in the study, both directly and indirectly.
Key words Environment Concern, Physical Environment, Social Environment, Revisit Intention and Customer Satisfaction.
INTRODUCTION
This Study sees customer behavior of resort in Sabang Free Trade Zone (FTZ), Indonesia that uses the concept of eco-friendly as its point of selling. Although there have been some previous researches that highlights the importance of the physical and social environment as determinant of revisit intention variable in the study associated with the behavior of tourists to the offer made by resort industry including those resorts located in remote areas, but not many that incorporate environmental concern as one of its decisive variable (T. Chen &
wood, bamboo and cork.(Kuminoff, Zhang, & Rudi, 2010).
In addition to using eco-friendly features, because Sabang FTZ is an area of marine tourism, eco-friendly concept developed by resort managers lead to the conservation of marine ecological system, especially the underwater ecological system (Kusumawati & Huang, 2015). In cooperation with the association of fishermen, known as "Commander Laot", and traditional institutions in the region called "Tuha Peut", the resort industry has advocated conservation messages such as do not damage the reef, do not catch fish using fish bombs, do not anchor the yachts in the area of diving spot to prevent the destruction of marine life and some other nature conservation messages (BPKS, 2016).
Damage to the
environment that continues to happen has resulted in increased environmental consciousness, with consumers now choosing to integrate environmental considerations into their lifestyle choice (Rahbar & Wahid, 2011). Therefore eco-friendly concept in the tourism industry has become one differentiator for a tourism destination to compete with other tourist destinations (Kusumawati & Huang, 2015). Awareness among tourists chooses tourist destinations that offer eco-friendly concept also increase significantly. So that this phenomenon be the right moment for the players in tourism industry, including marine tourism to position its offering as an eco-friendly resort for targeting consciousness eco-friendly this segment (Paco & Raposo, 2009).
This paper aims to look at how revisit intention can be
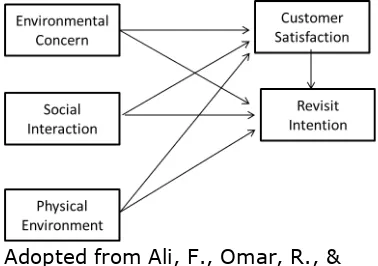
affected by variables Environmental Concern, Social Environment and Physical Environment with Customer Satisfaction as intervening variable.
LITERATURE REVIEW Environmental Concern
Many studies have been discussing the behavior of tourist that shifted to natural friendly concept (Brécard, Hlaimi, Lucas, & Perraudeau, 2009). Indeed, the environmental concern is often used to measure the importance of the environment and its protection and has been cited as an indicator of the green concept (Brécard et al., 2009). Furthermore several other researchers have also revealed a positive and significant relationship between consumers' environmental concerns and their shopping behavior (Rahbar & Wahid, 2011). Although many studies have addressed the issue of eco-friendly variable on consumer purchasing decisions, not many were linked it with the hospitality industry especially for those located in remote area that offered such a natural friendly strategy to promote their resorts. In fact, many groups of consumers are willing to pay a premium price for the product or service they are consumed when they are produced following green concept practices that do not cause environmental damage (Kuminoff et al., 2010).
Physical Environment and
Social Interaction
"environment in which the service is gathered and where sellers and customers interact, combined with a tangible commodity that performance or facilitate communication service". Servicescape may be likened to the 'sights' (Juhari, Ali, & Khair, 2012). This includes exterior facility (landscaping, exterior design, signage, parking, surrounding environment) and interior facilities (interior design and decoration, equipment, signage, layout, air quality, temperature and atmosphere). Servicescape along with other physical evidence such as business cards, stationery, billing statements, reports, employee gowns, uniforms, brochures, web pages forms servicescape virtual 'physical evidence' in marketing services (Ali, Omar, & Amin, 2013; Hassan & Hj, n.d.; Wall & Berry, 2007). For example, Walls & Berry (2007) conducted an exploratory study to understand customer experience in luxury hotels. The study listed ambience, spatial layout, signs and symbols within the physical environment whereas attitude, professional behavior, proactivity and appearance of staff and attitude, behavior, appearance and socialization of other customers were recognized as elements of the social environment that shape the customer experience. However, to satisfy consumers, relying only on physical environment is not enough.
There must be other variables to accompany such as Social Interaction. Social interaction is the process to act and react to response those around us (J. Huang & Hsu, 2010). In a nutshell, social interaction includes reviews those people
perform acts toward each other and the responses they give in return (Foster, 2004). Having a quick conversation with a friend seems are relatively trivial. In marketing activities, interaction becomes an important component both in terms of serving customers and deliver messages to the customers. Interaction to customers usually carried out by frontline staff (Foster, 2004; Libai, Bolton, Bügel, & Ruyter, 2010). In broader perspective, customer service could be represented by the quality of services that includes both physical and non-physical aspects such as reliability and responsiveness (Brady, Cronin, & Brand, 2002; Ladhari, 2010; Mahamad & Ramayah, 2010; Ramsaran-Fowdar, 2007).
Customer Satisfaction
that influence the perceptions and expectations of consumers when making purchases of goods or services among others are the need and desire felt by the consumer when purchasing goods or services, past experience when consuming goods or services and the experiences of friends who have consume goods or services and advertising (Matzler, Bailom, Hinterhuber, & Renzl, 2004). In a competitive environment, indicators that can show customer satisfaction is whether consumers will do repurchase and tell others to buy the product.
Many other researchers have revealed that variable customer satisfaction as leading indicators to influence customer to revisit destination in the future (Kim & Park, 2014). We can assess how strong the customers can feel their satisfaction by asking them to give rating on a 1-10 scale. When most of them have the answer 7 or more, then this becomes a clear indication that they will come back again. Furthermore, while customers give ratings 9-10 then they are not only coming back again, but also become the volunteer for the company to ask other people to stay at the same resort (Flint et al., 2011; Knutson, Stevens, Wullaert, & Patton, 1990). Conversely, if they only rate 6 and under, then this becomes a danger signal for the resort, because it is become clear indication that they are less happy to the services provided by the resort and most likely they will switch to other resorts. This group should be alert and should be given special attention to eliminate their frustration and to keep them stay with us. (Flint et al., 2011).
Revisit Intention
visit again (S. Huang & Hsu, 2009).
The Relationships among
Variables
Effect of Physical Environment on Customer Satisfaction and Revisit Intentions.
As one of the variables in the services marketing strategy, physical environment will be a determinant variable of the level of satisfaction of someone staying in a resort (Ali et al., 2013; Han & Ryu, 2009; Ryu & Han, 2011). Business resort should ensure all components are included in the group servicescapes must meet the expectations of guests staying (Juhari et al., 2012). The more satisfied the guests to the servicescape quality they gets, the greater the tendency for them to come back. Furthermore the satisfaction can lead the guests become loyal customers.
Effect of Social Environment on
Customer Satisfaction and
Revisit Intentions
Social environment or social interaction in this study is divided into two parts, namely the interaction to the resort staff and the interaction to other guests (Carlson & O’Cass, 2010; Yim, Tse, & Chan, 2008). Frontline officers who have direct contact with the guests had to be equipped with a variety of service skills and also friendly to guarantee a service excellence. (Foster, 2004). The resorts also need to create common activities so guests can have interaction each other.
Effect of Environmental
Concern to Customer
Satisfaction and Revisit
Intention
Currently the market segments that are concerned about maintaining environmental quality is growing (Paco & Raposo, 2009). Consumer purchasing behavior that incorporate to environmental factors as one of the variables that determine the purchase decision-making becomes increasingly important (Brécard et al., 2009; Jauhari & Manaktola, 2007; Kuminoff et al., 2010).
Effect of Customer Satisfaction on Revisit Intentions
Customer satisfaction has long been accepted as an antecedent variable for the customer's decision to repurchase (Kassim & Abdullah, 2010; Mahamad & Ramayah, 2010). Many researchers who have raised this variable as the most affect the customer's desire to revisit. So it's only if the resort managers endeavor to give satisfaction to its customers so they will come back again in the future (N. Chen & Funk, 2010; Raza et al., 2012)
Adopted from Ali, F., Omar, R., & Amin, M. (2013)
Figure 1
HYPOTHESIS
Based on the framework of research that has been described previously, it could be assigned hypothesis as follows:
1. Environmental Concern, Social Environment, Physical environment, Customer Satisfaction have an effect on Revisit Intention
2. Environmental Concern, Social Environment and Physical environment have an effect on Customer Satisfaction.
METHODOLOGY
Sample Design and Data
Collection
The target population for this study was limited to guests who had stayed at Sabang FTZ resort hotels at least once. The survey was conducted through face-to-face interaction with guests at various locations within four selected resort hotels in from Anoi Itam in the East down to Iboih in the West of Weh Island. A convenience sample was drawn for the survey and a self-administered survey was used to collect data. Questionnaires were distributed to guests at different times of the day, over the period of three weeks. A total of 240 questionnaires were distributed based on the sample size criteria highlighted by Peng and Lai
(2012) for SEM models, which is
ten times the total number of indicators in the study. Of the total questionnaires distributed, 210 questionnaires were able to be collected back and used for data analysis.
ANALYTICAL METHOD
For this study, the hypotheses were tested using the Structural Equation Modeling (SEM), using a statistical software package of AMOS. SEM is a method used for testing models and hypothesis developed in this study. SEM itself is a set of statistical techniques that allow the testing of a series of relative complicated relationship simultaneously (Ferdinand, 2002).
FINDINGS AND RESULTS Measurement Model
The following figure shows the relationship between unobserved variables and their respective indicators showing in the Measurement Model.
Figure 2
Measurement Model with Loading Factor
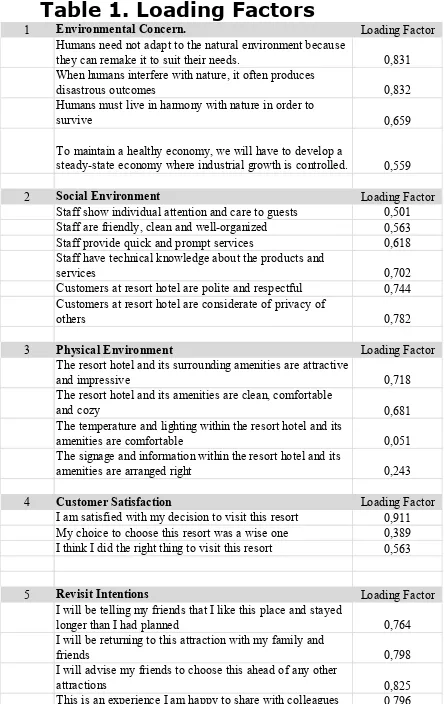
explained Environmental Concern better than other indicators. At construct Social Environment, an indicator that has the highest value is "Customers at resort hotels are considerate of the privacy of others" with a score of 0.782, so that this indicator has the most influence in the formation of social environment variable. In the Physical Environment constructs, indicator that has the highest value is "The resort hotel and its surrounding amenities are attractive and impressive" with a score of 0.718. While on the construct of Customer Satisfaction and Revisit Intention, indicators that have the highest value are "I am satisfied with my decision to visit this resort" and "I will advise my friends to choose this ahead of any other attractions", with the score respectively 0.911 and 0.825.
Table 1. Loading Factors
1 Environmental Concern. Loading Factor
Humans need not adapt to the natural environment because they can remake it to suit their needs. 0,831 When humans interfere with nature, it often produces
disastrous outcomes 0,832
Humans must live in harmony with nature in order to
survive 0,659
To maintain a healthy economy, we will have to develop a steady-state economy where industrial growth is controlled. 0,559
2 Social Environment Loading Factor
Staff show individual attention and care to guests 0,501 Staff are friendly, clean and well-organized 0,563 Staff provide quick and prompt services 0,618 Staff have technical knowledge about the products and
services 0,702
Customers at resort hotel are polite and respectful 0,744 Customers at resort hotel are considerate of privacy of
others 0,782
3 Physical Environment Loading Factor
The resort hotel and its surrounding amenities are attractive
and impressive 0,718
The resort hotel and its amenities are clean, comfortable
and cozy 0,681
The temperature and lighting within the resort hotel and its
amenities are comfortable 0,051
The signage and information within the resort hotel and its
amenities are arranged right 0,243
4 Customer Satisfaction Loading Factor
I am satisfied with my decision to visit this resort 0,911 My choice to choose this resort was a wise one 0,389 I think I did the right thing to visit this resort 0,563
5 Revisit Intentions Loading Factor
I will be telling my friends that I like this place and stayed
longer than I had planned 0,764
I will be returning to this attraction with my family and
friends 0,798
I will advise my friends to choose this ahead of any other
attractions 0,825
Evaluation Criteria Goodness of or rejected (Ferdinand, 2006)
Table 3
Criteria Goodness of Fit
From the table 3 above by the relationship between indicators with their respective constructs.
Analysis of Structural Equation Modeling
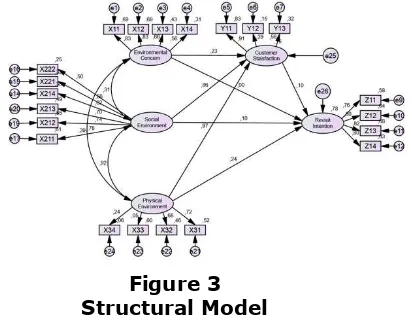
The analysis of Structural Equation Model (SEM) in Full Model is intended to test the model and hypotheses developed in this study. Testing the model in Structural Equation Model being done with two tests, first test with suitability of the model and second test with test significance of causality.
Figure 3 Structural Model
affects the dependent variable which is Revisit Intention, both direct and through customer satisfaction as mediating variable. The next step is to look at how strong the influence of the two variables was tested. Although all the independent variables affect revisit intention as dependence variable either directly or indirectly, but a more powerful influence given by variable of Physical Environment, compared to four other variables. This is shown by the coefficient numbers on the arrows leading to Revisit Intention.
MANAGERIAL IMPLICATION
As an endogenous or dependent variable, the variable of revisit intention influenced by variables used and developed in this study, such as the Environmental Concern, Social
Environment, Physical
Environment and Customer Satisfaction. Testing with measurement model to look at the contribution of indicators for each of the variables that have been built through the conceptual theory, seen these indicators do have a contribution and be able to explain the variable that represents by them. However, we need to give special attention for several indicators which have the highest loading factor, compared to other indicators. Because the indicator with the highest loading factor is the closest to duplicating the variable that they represents. So if the resort management wants to intervene in specific variables, the indicator with the highest factor loading value can be used as a lead to start improving the performance variables selected. For example the indicator of the resort hotel and its
surrounding amenities are attractive and impressive need to be maintained and not be destroyed since this indicator is belong to physical environment variable that has the greatest value compare to other variables. So the indicator and the variable play significant role to increase the willingness of the tourist revisit the resort.
CONCLUSION
1. All indicators that have the highest value in each variable should be of concern of resort management, at least to maintain them, because these indicators are shown to have a relatively large contribution to explain the variables they represent. 2. To improve revisit
REFERENCES
Ali, F., Omar, R., & Amin, M. (2013). of the relationships
between physical
environment, perceived
value, image and
behavioural Intentions: A SEM approach towards Malaysian resort hotels. Journal of Hotel and Tourism
Management. Retrieved from
http://fac.ksu.edu.sa/sites/d efault/files/ali_omar_and_am in_2013.pdf
Bitner, M. (1992). Servicescapes: The impact of physical surroundings on customers and employees. The Journal
of Marketing. Retrieved from
http://www.jstor.org/stable/ 1252042
BPKS Working Paper (2015). Focusing on Tourism to Develop Sabang FTZ Economy. BPKS Sabang, Aceh, Indonesia.
Brady, M., Cronin, J., & Brand, R. (2002). Performance-only measurement of service quality: a replication and extension. Journal of
Business Research. Retrieved
from
http://www.sciencedirect.co m/science/article/pii/S01482 96300001715
Brécard, D., Hlaimi, B., Lucas, S., & Perraudeau, Y. (2009). Determinants of demand for green products: An application to eco-label demand for fish in Europe.
Ecological. Retrieved from
http://www.sciencedirect.co m/science/article/pii/S09218 00909003061
Carlson, J., & O’Cass, A. (2010). Exploring the relationships between e-service quality, satisfaction, attitudes and behaviours in content-driven
e-service web sites. Journal
of Services Marketing.
Retrieved from
http://www.emeraldinsight.c om/doi/abs/10.1108/088760 41011031091
Chen, N., & Funk, D. (2010). Exploring destination image, experience and revisit intention: A comparison of sport and non-sport tourist perceptions. Journal of Sport
& Tourism. Retrieved from
http://www.tandfonline.com/ doi/abs/10.1080/14775085.2 010.513148
Chen, T., & Chai, L. (2010). Attitude towards the environment and green products: consumers’ perspective. Management
Science and Engineering.
Retrieved from
http://search.proquest.com/ openview/a7ca39a001ee597 761e03ab0306b9908/1?pq-origsite=gscholar&cbl=40275 Cherian, J., & Jacob, J. (2012). Green marketing: A study of consumers’ attitude towards environment friendly products. Asían Social
Science. Retrieved from
http://search.proquest.com/ openview/c38160fa7de4089c 0c9cb18e591a472a/1?pq-origsite=gscholar&cbl=30707 6
Flint, D. J., Blocker, C. P., & Boutin, P. J. (2011). Customer value anticipation, customer satisfaction and loyalty: An empirical examination. Industrial
Marketing Management,
40(2), 219–230.
http://doi.org/10.1016/j.ind marman.2010.06.034
front-line staff in the DIY sector. International Journal
of Retail & Distribution.
Retrieved from
http://www.emeraldinsight.c om/doi/pdf/10.1108/095905 50410549329
Han, H., & Ryu, K. (2009). The roles of the physical environment, price perception, and customer satisfaction in determining customer loyalty in the restaurant industry. Journal of Hospitality & Tourism
Research. Retrieved from
http://journals.sagepub.com /doi/abs/10.1177/10963480 09344212
Hassan, F., & Hj, R. (n.d.). Segmenting Nature~ based Tourists and Perception of Servicescape at Tainan Negara (National Park Malaysia).
Scholar.dkyobobook.co.kr.
Retrieved from
http://scholar.dkyobobook.c o.kr/searchDetail.laf?barcode =4010023244673
Huang, J., & Hsu, C. (2010). The impact of customer-to-customer interaction on cruise experience and vacation satisfaction. Journal
of Travel Research. Retrieved
from
http://journals.sagepub.com /doi/abs/10.1177/00472875 09336466
Huang, S., & Hsu, C. (2009). Effects of travel motivation, past experience, perceived constraint, and attitude on revisit intention. Journal of
Travel Research. Retrieved
from
http://journals.sagepub.com /doi/abs/10.1177/00472875 08328793
Jauhari, V., & Manaktola, K.
(2007). Exploring consumer attitude and behaviour towards green practices in the lodging industry in India.
International Journal of.
Retrieved from
http://www.emeraldinsight.c om/doi/pdf/10.1108/095961 10710757534
Juhari, N., Ali, H., & Khair, N. (2012). The shopping mall servicescape affects customer satisfaction. 3rd
International Conference on.
Retrieved from
https://www.researchgate.ne t/profile/Hishamuddin_Ali/pu blication/267406194_THE_S HOPPING_MALL_SERVICESC APE_AFFECTS_CUSTOMER_S ATISFACTION/links/546c917 20cf21e510f63e2b6.pdf Kassim, N., & Abdullah, N. A.
(2010). The effect of perceived service quality dimensions on customer satisfaction, trust, and loyalty in e-commerce settings: A cross cultural analysis. Asia Pacific Journal
of Marketing. Retrieved from
http://www.emeraldinsight.c om/doi/abs/10.1108/135558 51011062269
Kim, S., & Park, E. (2014). First-time and repeat tourist destination image: the case of domestic tourists to Weh Island, Indonesia. Anatolia, (May 2015), 1–13. http://doi.org/10.1080/1303 2917.2014.984233
Knutson, B., Stevens, P., Wullaert, C., & Patton, M. (1990). LODGSERV: A service quality index for the lodging industry. Journal of
Hospitality. Retrieved from
http://jht.sagepub.com/cont ent/14/2/277.short
(2010). Are travelers willing to pay a premium to stay at a" green" hotel? Evidence from an internal meta-analysis of hedonic price premia. Agricultural &
Resource. Retrieved from
https://pdfs.semanticscholar. org/97b0/21569be64ae9aeff c28a0ea30b968c3fe3d2.pdf Kusumawati, I., & Huang, H.-W.
(2015). Key factors for successful management of marine protected areas: A comparison of stakeholders׳ perception of two MPAs in Weh island, Sabang, Aceh, Indonesia. Marine Policy, 51, 465–475.
http://doi.org/10.1016/j.mar pol.2014.09.029
Ladhari, R. (2010). Developing e-service quality scales: A literature review. Journal of
Retailing and Consumer
Services. Retrieved from
http://www.sciencedirect.co m/science/article/pii/S09696 98910000615
Libai, B., Bolton, R., Bügel, M., & Ruyter, K. De. (2010). Customer-to-customer
interactions: broadening the scope of word of mouth research. Journal of Service.
Retrieved from
http://jsr.sagepub.com/cont ent/13/3/267.short
Mahamad, O., & Ramayah, T. (2010). Service quality, customer satisfaction and loyalty: a test of mediation.
International Business
Research. Retrieved from
http://search.proquest.com/ openview/759d887ce8d1f80 d5375570a65f217bb/1?pq-origsite=gscholar
Matzler, K., Bailom, F., Hinterhuber, H., & Renzl, B. (2004). The asymmetric
relationship between attribute-level performance and overall customer
satisfaction: a
reconsideration of the importance–performance analysis. Industrial
Marketing. Retrieved from
http://www.sciencedirect.co m/science/article/pii/S00198 50103000555
Mihelis, G., Grigoroudis, E., Siskos, Y., Politis, Y., & Malandrakis, Y. (2001). Customer satisfaction measurement in the private bank sector. European
Journal of Operational
Research, 130(2), 347–360.
http://doi.org/10.1016/S037 7-2217(00)00036-9
Nyaga, N. (n.d.). Assessing the tourist destination image and its effect on tourist Revisit Intentions in Rwanda.
Academia.edu. Retrieved
from
http://www.academia.edu/d ownload/33052274/John_pa per.docx
Paco, A. Do, & Raposo, M. (2009). “Green” segmentation: an application to the Portuguese consumer market. Marketing
Intelligence & Planning.
Retrieved from
http://www.emeraldinsight.c om/doi/abs/10.1108/026345 00910955245
Rahbar, E., & Wahid, N. A. (2011). Investigation of green marketing tools’ effect on consumers’ purchase behavior. Business Strategy
Series. Retrieved from
http://www.emeraldinsight.c om/doi/abs/10.1108/175156 31111114877
industry in Mauritius. Journal
of Vacation Marketing.
Retrieved from
http://journals.sagepub.com /doi/abs/10.1177/13567667 06071203
Raza, M., Siddiquei, A., & Awan, H. (2012). Relationship between service quality, perceived value, satisfaction and revisit intention in hotel industry. Journal of
Contemporary …. Retrieved
from
https://www.researchgate.ne t/profile/Muhammad_Raza42 /publication/275035518_Rel ationship_between_service_q uality_perceived_value_satisf action_and_revisit_intention _in_hotel_industry/links/556 4199708ae9963a11ef9ff.pdf Ryu, K., & Han, H. (2011). New or
repeat customers: How does physical environment influence their restaurant experience? International
Journal of Hospitality
Management. Retrieved from
http://www.sciencedirect.co m/science/article/pii/S02784 31910001350
Som, A., Marzuki, A., & Yousefi, M. (2012). Factors influencing visitors’ revisit behavioral intentions: a case study of
Sabah, Malaysia.
International Journal of.
Retrieved from
http://www.ccsenet.org/jour nal/index.php/ijms/article/vi ew/15499
Um, S., Chon, K., & Ro, Y. (2006). Antecedents of revisit intention. Annals of Tourism
Research. Retrieved from
http://www.sciencedirect.co m/science/article/pii/S01607 38306000685
Wall, E., & Berry, L. (2007). The combined effects of the physical environment and employee behavior on customer perception of restaurant service quality. Cornell Hotel and Restaurant
Administration. Retrieved
from
http://cqx.sagepub.com/cont ent/48/1/59.short
Yim, C., Tse, D., & Chan, K. (2008). Strengthening customer loyalty through intimacy and passion: Roles of customer–firm affection and customer–staff relationships in services.
Journal of Marketing
Research. Retrieved from