Table of Contents
CoverCHAPTER 1: Do Algorithms Dream About Artificial Alphas? 1.1 INTRODUCTION
1.2 REPLICATION OR REINVENTION
1.3 REINVENTION WITH MACHINE LEARNING 1.4 A MATTER OF TRUST
1.5 ECONOMIC EXISTENTIALISM: A GRAND DESIGN OR AN ACCIDENT?
1.6 WHAT IS THIS SYSTEM ANYWAY? 1.7 DYNAMIC FORECASTING AND NEW METHODOLOGIES
1.8 FUNDAMENTAL FACTORS, FORECASTING AND MACHINE LEARNING
1.9 CONCLUSION: LOOKING FOR NAILS NOTES
CHAPTER 2: Taming Big Data
2.1 INTRODUCTION: ALTERNATIVE DATA – AN OVERVIEW
2.2 DRIVERS OF ADOPTION
2.3 ALTERNATIVE DATA TYPES, FORMATS AND UNIVERSE
2.4 HOW TO KNOW WHAT ALTERNATIVE DATA IS USEFUL (AND WHAT ISN'T)
2.5 HOW MUCH DOES ALTERNATIVE DATA COST? 2.6 CASE STUDIES
2.7 THE BIGGEST ALTERNATIVE DATA TRENDS 2.8 CONCLUSION
NOTES
CHAPTER 3: State of Machine Learning Applications in Investment Management
3.1 INTRODUCTION
3.2 DATA, DATA, DATA EVERYWHERE
3.3 SPECTRUM OF ARTIFICIAL INTELLIGENCE APPLICATIONS
3.4 INTERCONNECTEDNESS OF INDUSTRIES AND ENABLERS OF ARTIFICIAL INTELLIGENCE
3.5 SCENARIOS FOR INDUSTRY DEVELOPMENTS 3.6 FOR THE FUTURE
3.7 CONCLUSION REFERENCES NOTES
CHAPTER 4: Implementing Alternative Data in an Investment Process
4.1 INTRODUCTION
4.2 THE QUAKE: MOTIVATING THE SEARCH FOR ALTERNATIVE DATA
4.3 TAKING ADVANTAGE OF THE ALTERNATIVE DATA EXPLOSION
4.4 SELECTING A DATA SOURCE FOR EVALUATION 4.5 TECHNIQUES FOR EVALUATION
4.6 ALTERNATIVE DATA FOR FUNDAMENTAL MANAGERS
4.7 SOME EXAMPLES 4.8 CONCLUSIONS REFERENCES
CHAPTER 5: Using Alternative and Big Data to Trade Macro Assets
5.2 UNDERSTANDING GENERAL CONCEPTS WITHIN BIG DATA AND ALTERNATIVE DATA
5.3 TRADITIONAL MODEL BUILDING APPROACHES AND MACHINE LEARNING
5.4 BIG DATA AND ALTERNATIVE DATA: BROAD BASED USAGE IN MACRO BASED TRADING
5.5 CASE STUDIES: DIGGING DEEPER INTO MACRO TRADING WITH BIG DATA AND ALTERNATIVE DATA 5.6 CONCLUSION
REFERENCES
CHAPTER 6: Big Is Beautiful: How Email Receipt Data Can Help Predict Company Sales
6.1 INTRODUCTION
6.2 QUANDL'S EMAIL RECEIPTS DATABASE
6.3 THE CHALLENGES OF WORKING WITH BIG DATA 6.4 PREDICTING COMPANY SALES
6.5 REAL TIME PREDICTIONS
6.6 A CASE STUDY: http://amazon.com SALES REFERENCES
NOTES
CHAPTER 7: Ensemble Learning Applied to Quant Equity: Gradient Boosting in a Multifactor Framework
7.1 INTRODUCTION
7.2 A PRIMER ON BOOSTED TREES 7.3 DATA AND PROTOCOL
8.1 INTRODUCTION
8.2 LITERATURE REVIEW
8.3 DATA AND SAMPLE CONSTRUCTION 8.4 INFERRING CORPORATE CULTURE 8.5 EMPIRICAL RESULTS
8.6 CONCLUSION REFERENCES
CHAPTER 9: Machine Learning and Event Detection for Trading Energy Futures
CHAPTER 10: Natural Language Processing of Financial News 10.1 INTRODUCTION
10.2 SOURCES OF NEWS DATA 10.3 PRACTICAL APPLICATIONS
10.4 NATURAL LANGUAGE PROCESSING 10.5 DATA AND METHODOLOGY
10.6 CONCLUSION REFERENCES
CHAPTER 11: Support Vector Machine Based Global Tactical Asset Allocation
11.1 INTRODUCTION
11.2 FIFTY YEARS OF GLOBAL TACTICAL ASSET ALLOCATION
LITERATURE
11.4 A SVR BASED GTAA 11.5 CONCLUSION
REFERENCES
CHAPTER 12: Reinforcement Learning in Finance 12.1 INTRODUCTION
12.2 MARKOV DECISION PROCESSES: A GENERAL FRAMEWORK FOR DECISION MAKING
12.3 RATIONALITY AND DECISION MAKING UNDER UNCERTAINTY
12.4 MEAN VARIANCE EQUIVALENCE 12.5 REWARDS
12.6 PORTFOLIO VALUE VERSUS WEALTH 12.7 A DETAILED EXAMPLE
12.8 CONCLUSIONS AND FURTHER WORK REFERENCES
CHAPTER 13: Deep Learning in Finance: Prediction of Stock Returns with Long Short Term Memory Networks
13.1 INTRODUCTION 13.2 RELATED WORK
13.3 TIME SERIES ANALYSIS IN FINANCE 13.4 DEEP LEARNING
13.5 RECURRENT NEURAL NETWORKS
CHAPTER 2 CHAPTER 3 CHAPTER 4 CHAPTER 5 CHAPTER 6 CHAPTER 7 CHAPTER 8 CHAPTER 9 CHAPTER 10 CHAPTER 11 CHAPTER 12 CHAPTER 13
List of Tables
Chapter 2Table 2.2 Key criteria for assessing alternative data usefulness
Chapter 4
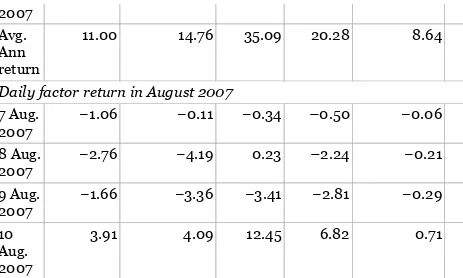
Table 4.1 Average annualized return of dollar neutral, equally weighted portf...
Table 4.2 Do complaints count predicts returns?
Table 4.3 The average exposure to common risk factors by quintile
Table 4.4 Regression approach to explain the cross section of return volatili...
Table 4.5 Complaints factor: significant at the 3% or better level every year
Chapter 7
Table 7.1 Summary and examples of features per family type Table 7.2 Analytics
Chapter 8
Table 8.1 Descriptive statistics on the user profiles of Glassdoor.com
Table 8.8 Regression of performance orientated firms and firm value
Table 8.9 Regression of performance orientated firms and earnings surprises
Chapter 9
Table 9.1 Performance statistics
Table 9.2 Summary statistics for RavenPack Analytics Table 9.3 In sample performance statistics.
Table 9.4 Out of sample performance statistics Table 9.5 Out of sample performance statistics Table 9.6 Performance statistics
Chapter 10
Table 10.1 Fivefold cross validated predictive performance results for the Ne...
Chapter 11
Table 11.1 Universe traded Chapter 13
Table 13.1 Experiment 1: comparison of performance measured as the HR for LST...
Table 13.2 Experiment 2 (main experiment) Table 13.3 Experiment 2 (baseline experiment)
Table 13.4 Experiment 2 (stocks used for this portfolio)
List of Illustrations
Chapter 2Figure 2.1 The law of diffusion of innovation. Figure 2.2 Spending on alternative data. Figure 2.3 Alternative dataset types.
Figure 2.4 Breakdown of alternative data sources used by the buy side.
Figure 2.5 Breakdown of dataset's annual price.
Figure 2.6 Neudata's rating for medical record dataset. Figure 2.7 Neudata's rating for Indian power generation dataset.
Figure 2.8 Neudata's rating for US earnings performance forecast.
Figure 2.9 Neudata's rating for China manufacturing dataset. Figure 2.10 Neudata's rating for short positions dataset.
Figure 2.11 Carillion's average net debt.
Figure 2.12 Neudata's rating for short positions dataset. Figure 2.13 Neudata's rating for invoice dataset.
Figure 2.14 Neudata's rating for salary benchmarking dataset. Figure 2.15 Ratio of CEO total compensation vs employee average, 2017.
Figure 2.16 Neudata's rating for corporate governance dataset.
Chapter 3
Figure 3.1 AI in finance classification
Figure 3.3 Equity performance and concentration in portfolio Figure 3.4 Evolution of Quant Investing
Chapter 4
Figure 4.1 Technology Adoption Lifecycle
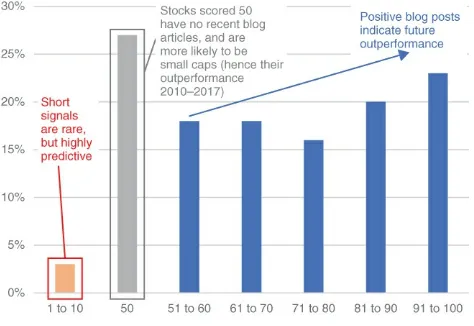
Figure 4.2 Cumulative residual returns to blogger recommendations.
Figure 4.3 Annualized return by TRESS bin.
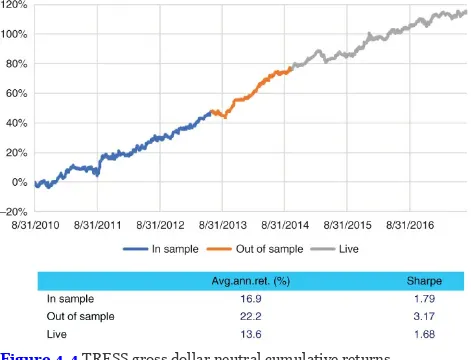
Figure 4.4 TRESS gross dollar neutral cumulative returns. Figure 4.5 alpha DNA's Digital Bureau.
Figure 4.6 Percentage revenue beat by DRS decile.
Figure 4.7 DRS gross dollar neutral cumulative returns. Figure 4.8 Cumulative gross local currency neutral returns. Figure 4.9 Percentile of volatility, by complaint frequency. Chapter 5
Figure 5.1 Structured dataset – Hedonometer Index. Figure 5.2 Scoring of words.
Figure 5.3 Days of the week – Hedonometer Index. Figure 5.4 Bloomberg nonfarm payrolls chart.
Figure 5.5 Fed index vs recent USD 10Y yield changes. Figure 5.6 USD/JPY Bloomberg score.
Figure 5.7 News basket trading returns.
Figure 5.8 Regressing news volume vs implied volatility. Figure 5.9 Plot of VIX versus IAI.
Figure 5.10 Trading S&P 500 using IAI based rule vs VIX and long only.
Figure 6.1 Domino's Pizza sales peak at weekends… Figure 6.2 …and at lunchtime.
Figure 6.3 Most popular pizza toppings: the pepperoni effect. Figure 6.4 Amazon customers prefer Mondays…
Figure 6.5 …and take it easy at the weekend.
Figure 6.6 How an email receipt is turned into purchase records.
Figure 6.7 The structure of Quandl's data offering. Figure 6.8 Sample size over time.
Figure 6.9 Geographic distribution as of April 2017.
Figure 6.10 Coverage of US population on a state by state basis as of April 2...
Figure 6.11 How long does a user typically spend in our sample?
Figure 6.12 Six of the most expensive purchases made on Amazon.com.
Figure 6.13 Seasonal pattern in fundamental data: Amazon's quarterly sales.
Figure 6.14 Seasonal patterns in big data: Amazon's weekly sales. The sales i...
Figure 6.15 Expedia's big data bookings split has changed significantly over ...
Figure 6.16 A timeline for quarterly sales forecasts.
Figure 6.17 Bayesian estimation of quarterly revenue growth: An example. The ...
Figure 6.18 Negative exponential distribution. Figure 6.19 Dividing each quarter into 13 weeks.
Figure 6.21 Estimated seasonal component, Q1. Figure 6.24 Estimated seasonal component, Q4. Figure 6.25 Sales breakdown per type, Amazon. Figure 6.26 Sales breakdown per region, Amazon. Figure 6.27 Contributions to sales growth in Q1. Figure 6.30 Contributions to sales growth in Q4. Figure 6.31 e commerce vs. headline growth.
Figure 6.32 Headline growth vs. growth in North America. Figure 6.33 Combining big data and consensus delivers superior forecasts of t...
Figure 6.34 Improving forecasting ability as the sample size increases. The p...
Figure 6.35 Big data can be used to predict sales… Figure 6.36 …and sales surprises.
Figure 6.37 In sample vs. actual sales growth.
Figure 6.38 The results are robust. The data covers the period 2014Q2–2017Q1....
Figure 6.39 Real time prediction of sales growth in 2016 Q2. The shaded area ...
Figure 6.40 Real time prediction of sales growth in 2016 Q3. Figure 6.42 Real time prediction of sales growth in 2017 Q1. Chapter 7
Figure 7.1 Two symbolic trees. Variations in the dependent variable (y) are ...
Figure 7.2 Hierarchical clustering for rank correlation between variable. Ran...
Figure 7.4 Confusion matrix illustration. We explain the confusion matrix in ...
Figure 7.5 Top 20 most important variables. We show the most important variab...
Figure 7.6 Wealth curve for decile portfolios based on multifactor signal.
Figure 7.8 Wealth curve for decile portfolios based on the machine learning m...
Figure 7.9 Annualized performance comparison for each decile of each model.
Chapter 8
Figure 8.1 Illustrative examples of Glassdoor reviews. Figure 8.2 Illustrative example of topic modelling. A topic model assumes tha...
Chapter 9
Figure 9.1 Relative variable importance using ELNET. Features are scaled by t...
Figure 9.2 Cumulative log returns. The red vertical line marks the beginning ...
Figure 9.3 Out of sample information ratios. The names on the x axes specify ...
Figure 9.4 Cumulative log returns.
Figure 9.5 Out of sample performance statistics with Ensemble.
Chapter 10
Figure 10.1 The NLP pipeline from preprocessing to feature representation an...
Figure 10.2 Flow of inference into decision and action.
Chapter 11
Figure 11.1 Three families of asset allocation. Figure 11.2 The kernel trick
Figure 11.3 The kernel trick: a non separable case
Figure 11.4 SVR GTAA compared to 60% bond, 40% equity (non compounded arithme...
Figure 11.5 SVR GTAA compared to 60% bond, 40% equity (non compounded arithme...
Chapter 12
Figure 12.1 Interacting system: agent interacts with environment.
Figure 12.2 Cumulative simulated out of sample P/L of trained model. Simulate...
Chapter 13
Figure 13.1 Recurrent neural network unrolled in time. Figure 13.2 The rectified linear unit (ReLu) and sigmoid functions.
Figure 13.3 Memory cell or hidden unit in an LSTM recurrent neural network.
Figure 13.4 LSTM recurrent neural network unrolled in time.
Founded in 1807, John Wiley & Sons is the oldest independent publishing company in the United States. With offices in North
America, Europe, Australia, and Asia, Wiley is globally committed to developing and marketing print and electronic products and services for our customers' professional and personal knowledge and
understanding.
The Wiley Finance series contains books written specifically for finance and investment professionals as well as sophisticated
individual investors and their financial advisors. Book topics range from portfolio management to e commerce, risk management,
financial engineering, valuation and financial instrument analysis, as well as much more.
Big Data and Machine Learning
in Quantitative Investment
© 2019 John Wiley & Sons, Ltd
Registered office
John Wiley & Sons Ltd, The Atrium, Southern Gate, Chichester, West Sussex, PO19 8SQ, United Kingdom
For details of our global editorial offices, for customer services and for information about how to apply for permission to reuse the copyright material in this book please see our website at www.wiley.com.
All rights reserved. No part of this publication may be reproduced, stored in a retrieval system, or transmitted, in any form or by any means, electronic, mechanical, photocopying, recording or otherwise, except as permitted by the UK Copyright, Designs and Patents Act 1988, without the prior permission of the publisher.
Wiley publishes in a variety of print and electronic formats and by print on demand. Some material included with standard print versions of this book may not be included in e books or in print on demand. If this book refers to media such as a CD or DVD that is not included in the version you purchased, you may download this material at http://booksupport.wiley.com. For more information about Wiley products, visit www.wiley.com.
Designations used by companies to distinguish their products are often claimed as
trademarks. All brand names and product names used in this book are trade names, service marks, trademarks or registered trademarks of their respective owners. The publisher is not associated with any product or vendor mentioned in this book.
Limit of Liability/Disclaimer of Warranty: While the publisher and author have used their best efforts in preparing this book, they make no representations or warranties with respect to the accuracy or completeness of the contents of this book and specifically disclaim any implied warranties of merchantability or fitness for a particular purpose. It is sold on the
understanding that the publisher is not engaged in rendering professional services and neither the publisher nor the author shall be liable for damages arising herefrom. If professional advice or other expert assistance is required, the services of a competent professional should be sought.
Library of Congress Cataloging in Publication Data is Available:
ISBN 9781119522195 (hardback) ISBN 9781119522218 (ePub) ISBN 9781119522089 (ePDF)
Cover Design: Wiley
CHAPTER 1
Do Algorithms Dream About Artificial
Alphas?
1.1 INTRODUCTION
The core of most financial practice, whether drawn from equilibrium economics, behavioural psychology, or agency models, is traditionally formed through the marriage of elegant theory and a kind of ‘dirty’ empirical proof. As I learnt from my years on the PhD programme at the London School of Economics, elegant theory is the hallmark of a beautiful intellect, one that could discern the subtle tradeoffs in agent based models, form complex equilibrium structures and point to the sometimes conflicting paradoxes at the heart of conventional truths. Yet ‘dirty’ empirical work is often scoffed at with suspicion, but
reluctantly acknowledged as necessary to give substance and real
world application. I recall many conversations in the windy courtyards and narrow passageways, with brilliant PhD students wrangling over questions of ‘but how can I find a test for my hypothesis?’.
Many pseudo mathematical frameworks have come and gone in quantitative finance, usually borrowed from nearby sciences: thermodynamics from physics, Eto's Lemma, information theory, network theory, assorted parts from number theory, and occasionally from less high tech but reluctantly acknowledged social sciences like psychology. They have come, and they have gone, absorbed (not defeated) by the markets.
of the framework.
The rest of this chapter is a set of observations and examples of how machine learning could help us learn more about financial markets, and is doing so. It is drawn not only from my experience, but from many conversations with academics, practitioners, computer
scientists, and from volumes of books, articles, podcasts and the vast sea of intellect that is now engaged in these topics.
It is an incredible time to be intellectually curious and quantitatively minded, and we at best can be effective conduits for the future
generations to think about these problems in a considered and
1.2 REPLICATION OR REINVENTION
The quantification of the world is again a fascination of humanity. Quantification here is the idea that we can break down patterns that we observe as humans into component parts and replicate them over much larger observations, and in a much faster way. The foundations of quantitative finance found their roots in investment principles, or observations, made by generations and generations of astute investors, who recognized these ideas without the help of large scale data.
The early ideas of factor investing and quantitative finance were replications of these insights; they did not themselves invent investment principles. The ideas of value investing (component valuation of assets and companies) are concepts that have been studied and understood for many generations. Quantitative finance took these ideas, broke them down, took the observable and scalable elements and spread them across a large number of (comparable) companies.
The cost to achieving scale is still the complexity in and nuance about how to apply a specific investment insight to a specific company, but these nuances were assumed to diversify away in a larger scale
portfolio, and were and are still largely overlooked.1 The relationship between investment insights and future returns were replicated as linear relationships between exposure and returns, with little attention to non linear dynamics or complexities, but instead, focusing on
diversification and large scale application which were regarded as better outcomes for modern portfolios.
There was, however, a subtle recognition of co movement and
correlation that emerged from the early factor work, and it is now at the core of modern risk management techniques. The idea is that stocks that have common characteristics (let's call it a quantified investment insight) have also correlation and co dependence potentially on macro style factors.
thought about stocks in isolation, valuing and appraising them as if they were standalone private equity investments. It was a reinvention because it moved the object of focus from an individual stock to a common ‘thread’ or factor that linked many stocks that individually had no direct business relationship, but still had a similar
characteristic that could mean that they would be bought and sold together. The ‘factor’ link became the objective of the investment process, and its identification and improvement became the objective of many investment processes – now (in the later 2010s) it is seeing another renaissance of interest. Importantly, we began to see the world as a series of factors, some transient, some long standing, some short and some long term forecasting, some providing risk and to be removed, and some providing risky returns.
Factors represented the invisible (but detectable) threads that wove the tapestry of global financial markets. While we (quantitative
researchers) searched to discover and understand these threads, much of the world focused on the visible world of companies, products and periodic earnings. We painted the world as a network, where
connections and nodes were the most important, while others painted it as a series of investment ideas and events.
1.3 REINVENTION WITH MACHINE LEARNING
Reinvention with machine learning poses a similar opportunity for us to reinvent the way we think about the financial markets, I think in both the identification of the investment object and the way we think of the financial networks.Allow me a simple analogy as a thought exercise. In handwriting or facial recognition, we as humans look for certain patterns to help us understand the world. On a conscious, perceptive level, we look to see patterns in the face of a person, in their nose, their eyes and their mouth. In this example, the objects of perception are those units, and we appraise their similarity to others that we know. Our pattern
recognition then functions on a fairly low dimension in terms of components. We have broken down the problem into a finite set of grouped information (in this case, the features of the face), and we appraise those categories. In modern machine learning techniques, the face or a handwritten number is broken down into much smaller and therefore more numerous components. In the case of a handwritten number, for example, the pixels of the picture are converted to
numeric representations, and the patterns in the pixels are sought using a deep learning algorithm.
We have incredible tools to take large scale data and to look for patterns in the sub atomic level of our sample. In the case of human faces or numbers, and many other things, we can find these patterns through complex patterns that are no longer intuitive or
understandable by us (consciously); they do not identify a nose, or an eye, but look for patterns in deep folds of the information.3 Sometimes the tools can be much more efficient and find patterns better, quicker than us, without our intuition being able to keep up.
Taking this analogy to finance, much of asset management concerns itself with financial (fundamental) data, like income statements, balance sheets, and earnings. These items effectively characterize a company, in the same way the major patterns of a face may
hundred, and use them in a large scale algorithm like machine learning, we may find that we are already constraining ourselves heavily before we have begun.
The ‘magic’ of neural networks comes in their ability to recognize patterns in atomic (e.g. pixel level) information, and by feeding them higher constructs, we may already be constraining their ability to find new patterns, that is, patterns beyond those already identified by us in linear frameworks. Reinvention lies in our ability to find new
constructs and more ‘atomic’ representations of investments to allow these algorithms to better find patterns. This may mean moving away from the reported quarterly or annual financial accounts, perhaps using higher frequency indicators of sales and revenue (relying on alternate data sources), as a way to find higher frequency and, potentially, more connected patterns with which to forecast price movements.
Reinvention through machine learning may also mean turning our attention to modelling financial markets as a complex (or just expansive) network, where the dimensionality of the problem is potentially explosively high and prohibitive for our minds to work with. To estimate a single dimension of a network is to effectively estimate a covariance matrix of n × n. Once we make this system endogenous, many of the links within the 2D matrix become a function of other links, in which case the model is recursive, and iterative. And this is only in two dimensions. Modelling the financial markets like a neural network has been attempted with limited
application, and more recently the idea of supply chains is gaining popularity as a way of detecting the fine strands between companies. Alternate data may well open up new explicitly observable links
1.4 A MATTER OF TRUST
The reality is that patterns that escape our human attention will be either too subtle, or too numerous, or too fast in the data. Our inability to identify with them in an intuitive way, or to construct stories
around them, will naturally cause us to mistrust them. Some patterns in the data will be not useful for investment (e.g. noise, illiquid, and/or uninvestable), so these will quickly end up on the ‘cutting room floor’.4 But many others will be robust, and useful, but entirely unintuitive, and perhaps obfuscated to us. Our natural reaction will be to question ourselves, and if we are to use them, ensure that they are part of a very large cohort of signals, so as to diversify questions about a particular signal in isolation.
So long as our clients are humans as well, we will face communication challenges, especially during times of weak performance. When
performance is strong, opaque investment processes are less questioned, and complexity can even be considered a positive,
differentiating characteristic. However, on most occasions, an opaque investment process that underperforms is quickly mistrusted. In many examples of modern investment history, the ‘quants’ struggled to
explain their models in poor performance periods and were quickly abandoned by investors. The same merits of intellectual superiority bestowed upon them rapidly became weaknesses and points of ridicule.
Storytelling, the art of wrapping complexity in comfortable and familiar anecdotes and analogies, feels like a necessary cost of using technical models. However, the same can be a large barrier to
innovation in finance. Investment beliefs, and our capability to generate comfortable anecdotal stories, are often there to reconfirm commonly held intuitive investment truths, which in turn are
supported by ‘sensible’ patterns in data.
insights, and/or from some kind of obfuscation such as bundling,
where scrutiny of an individual signal is not possible. Either way, there is a certain additional business risk involved in moving outside the accepted realm of stories, even if the investment signals themselves add value.
1.5 ECONOMIC EXISTENTIALISM: A GRAND
DESIGN OR AN ACCIDENT?
If I told you that I built a model to forecast economic sector returns, but that the model itself was largely unintuitive and highly
contextualized, would this concern you? What if I told you that a core component was the recent number of articles in newspapers covering the products of that industry, but that this component wasn't
guaranteed to ‘make’ the model in my next estimation. Most
researchers I have encountered have a conceptual framework for how they choose between potential models. Normally, there is a thought exercise involved to relate a given finding back to the macro picture and ask: ‘Is this really how the world works? Does it make sense?’ Without this, the results are easily picked apart for their empirical fragility and in sample biases. There is a subtle leap that we take there, and it is to assume that there is a central ‘order’ or design to the
economic system. That economic forces are efficiently pricing and trading off risks and returns, usually from the collective actions of a group of informed and rational (if not pseudo rational) agents. Even if we don't think that agents are informed, or fully rational, their
collective actions can bring about ordered systems.
Our thinking in economics is very much grounded in the idea that there is a ‘grand design’ in play, a grand system, that we are detecting and estimating, and occasionally exploiting. I am not referring to the idea that there are temporary ‘mini equilibria’ that are constantly changing or evolving, but to the notion that there are any equilibria at all.
Darwinian notions of random mutations, evolution, and learning challenge the very core of this world view. Dennett5 elegantly
describes the evolution of humans as moving from foraging for food to organized farms. In doing so, their numbers increase, and they are now unable to go back to foraging. The path dependence is an
important part of the evolution and constrains the evolution in terms of its future direction. For example, it is unable to ‘evolve’ foraging practices because it doesn't do that any more and now it is evolving farming.
Machine learning, and models like random forests, give little
indication of a bigger picture, or a conceptual framework, but are most easily interpreted as a series of (random) evolutions in the data that has led us to the current ‘truth’ that we observe. The idea of a set of economic forces working in unison to give rise to a state of the economy is instead replaced by a series of random mutations and evolutionary pathways. For finance quantitative models, the
implication is that there is strong path dependency.
This is challenging, and in some cases outright disturbing, for an economically trained thinker. The idea that a model can produce a series of correlations with little explanation other than ‘just because’ is concerning, especially if the path directions (mutations) are random (to the researcher) – it can seem as though we have mapped out the path of a water droplet rolling down glass, but with little idea of what guided that path itself. As the famous investor George Soros7
1.6 WHAT IS THIS SYSTEM ANYWAY?
Reinvention requires a re examination of the root cause of returns and, potentially, abnormal returns. In nature, in games, and in feature identification, we generally know the rules (if any) of an engagement, and we know the game, and we know the challenges of identification of features. One central element in financial markets, that is yet to be addressed, is their dynamic nature. As elements are identified,
correlations estimated, returns calculated, the system can be moving and changing very quickly.
Most (common) quantitative finance models focus more on cross
sectional identification and less on time series forecasting. Of the time series models, they tend to be continuous in nature, or have state
dependency with usually a kind of switching model embedded. Neither approach has a deeper understanding, ex ante, of the reasons why the market dynamics may change, and forecasting (in my experience) of either model tends to rely on serial correlation of states and the occasional market extreme environment to ‘jolt’ the system.8 In this sense, the true complexity of the financial markets is likely grossly understated. Can we expect more from a machine learning algorithm that can dig into the subtle complexities and relationships of the markets? Potentially, yes. However, the lack of clean data, and the likelihood of information segmentations in the cross section, suggest some kind of supervised learning models, where the ex ante structures set up by the researcher are as likely to be the root of success or failure as the parameters estimated by the model itself.
One hope is that structures of relationships suggested by machine learning models can inspire and inform a new generation of theorists and agent based simulation models, that in turn could give rise to more refined ex ante structures for understanding the dynamic
One thought exercise to demonstrate this idea is a simple 2D matrix, of 5 × 5 elements (or as many as it takes to make this point). Each second, there is a grain of sand that drops from above this plane and lands on a single square. Over time, the number of grains of sand builds up in each square. There is a rule whereby if the tower of sand on one square is much greater than on another, it will collapse onto its neighbour, conferring the sand over. Eventually, some of the sand will fall over one of the four edges of the plane. The system itself is
1.7 DYNAMIC FORECASTING AND NEW
METHODOLOGIES
We return now to the more direct problems of quantitative asset management. Asset pricing (equities) broadly begins with one of two premises that are usually reliant on your chosen horizon:
1. Markets are composed of financial assets, and prices are fair valuations of the future benefit (cash flows usually) of owning those assets. Forecasting takes place of future cash
flows/fundamentals/earnings. The data field is composed of firms, that are bundles of future cash flows, and whose prices reflect the relative (or absolute) valuation of these cash flows. 2. Markets are composed of financial assets that are traded by
agents with imperfect information based on a range of
considerations. Returns are therefore simply a ‘trading game’; to forecast prices is to forecast future demand and supply of other agents. This may or may not (usually not) involve understanding fundamental information. In fact, for higher frequency strategies, little to no information is necessary about the underlying asset, only about its expected price at some future date. Typically using higher frequency micro structures like volume, bid ask spreads, and calendar (timing) effects, these models seek to forecast future demand/supply imbalances and benefit over a period of anywhere from nano seconds to usually days. There's not much prior
modelling, as the tradeoff, almost by design, is too high frequency always to be reacting to economic information, which means that it is likely to be driven by trading patterns and to rebalance
1.8 FUNDAMENTAL FACTORS, FORECASTING
AND MACHINE LEARNING
In the case of a fundamental investment process, the ‘language’ of asset pricing is one filled with reference to the business conditions of firms, their financial statements, earnings, assets, and generally
business prospects. The majority of the mutual fund industry operates with this viewpoint, analyzing firms in isolation, relative to industry peers, relative to global peers, and relative to the market as a whole, based on their prospective business success. The vast majority of the finance literature that seeks to price systematic risk beyond that of CAPM, so multi factor risk premia, and new factor research, usually presents some undiversifiable business risk as the case of potential returns. The process for these models is fairly simple: extract
fundamental characteristics based on a combination of financial statements, analysis, and modelling, and apply to either relative (cross sectional) or total (time series) returns.
For cross sectional return analysis, the characteristics (take a very common measure like earnings/price) are defined in the broad cross section, are transformed into a z score, Z∼ N(0,1), or a percentile rank
(1–100), and then related through a function f* to some future returns,
rt + n, where ‘n’ is typically 1–12 months forward returns. The function
f* finds its home in the Arbitrage Pricing Theory (APT) literature, and so is derived through either sorting or linear regressions, but can also be a simple linear correlation with future returns (otherwise known as an information coefficient, IC), a simple heuristic bucket sorting
exercise, a linear regression, a step wise linear regression (for multiple
diversified away. However, not much time is typically spent defining different f* functional forms. Outside of the usual quadratic forms (typically used to handle ‘size’) or the occasional interaction (e.g.
Quality*Size), there isn't really a good way to think about how to use information in ‘Z’. It is an area that largely has been neglected in favour of better stock specific measurements, but still the same standardization, and the same f*.
So our objective is to improve f*. Typically, we have a set of several hundred fundamental ‘Z’ to draw from, each a continuous variable in the cross section, and at best around 3000 stocks in the cross section. We can transform the Z into indicator variables for decile membership for example, but typically, we want to use the extreme deciles as
indicators, not the middle of the distribution. Armed with
fundamental variables ‘Z’ and some indicators ZI based on ‘Z’, we start
to explore different non linear methodologies. We start to get excited now, as the potential new uber solving model lies somewhere before us.
The first problem we run into is the question: ‘What do I want to forecast?’ Random forests, neural networks, are typically looking for binary outcomes as predictors. Returns are continuous, and most fundamental outcomes are equally so (A percentage by which a
company has beat/miss estimates, for example). Before we choose our object, we should consider what kind of system we are looking to
identify.
1. I want to forecast a company's choice to do something, e.g. firms that ‘choose’ to replace CEOs, to buy or sell assets, to acquire competitors. I then hope to benefit from returns associated from these actions. But how do firms make these choices? Do they make them in isolation from economic factors, is there really unconditional choice, or are these firms already conditioned by some kind of latent economic event? For example, firms rarely cancel dividends in isolation. Typically, the choice to cancel is already heavily influenced by very poor market conditions. So our model may well be identifying firms that are under financial
certain choices are foregone conclusions.
2. I want to forecast wrongdoing by the firm and then make money by shorting/avoiding those firms. Intentional or not, firms that misreport their financials but then are ultimately discovered (we hope!), and therefore we have a sample set. This is especially interesting for emerging economies, where financial controls, e.g. for state owned enterprises, could have conflicting interests with simply open disclosure. This feels like an exciting area of forensic accounting, where ‘clues’ are picked up and matched by the
algorithm in patterns that are impossible to follow through
human intuition alone. I think we have to revisit here the original assumption: is this unintentional, and therefore we are modelling inherent uncertainty/complexity within the organization, or is it intentional, in which case it is a ‘choice’ of sorts. The choice of independent variables should inform both ideally, but the ‘choice’ idea would require a lot more information on ulterior motives. 3. I just want to forecast returns. Straight for the jugular, we can say:
Can we use fundamental characteristics to forecast stock returns? We can define relative returns (top decile, top quintile?) over some future period ‘n’ within some peer group and denote this as ‘1’ and everything else as ‘0’. It is attractive to think that if we can line up our (small) army of fundamental data, re estimate our model (neural net or something else) with some look back window, we should be able to do crack this problem with brute force. It is, however, likely to result in an extremely dynamic model, with extreme variations in importance between factors, and probably not clear ‘local maxima’ for which model is the best. Alternately, we can define our dependent variable based on a total return target, for example anything +20% over the future period ‘n’ (clearly, the two choices are related), and aim to identify an ‘extreme movers’ model. But why do firms experience unusually large price jumps? Any of the above models (acquisition, beating forecasts, big surprises, etc.) could be candidates, or if not, we are effectively forecasting cross sectional volatility. In 2008, for
it was expected. Cross sectional volatility and market direction are necessarily ‘states’ to enable (or disqualify) the probability of a +x% move in stock prices. Therefore, total return target models are unlikely to perform well across different market cycles (cross sectional volatility regimes), where the unconditional probability of achieving a +20% varies significantly. Embedding these is effectively transforming the +20% to a standard deviation move in the cross section, when you are now back in the relative return game.
4. If you were particularly keen on letting methodology drive your model decisions, you would have to reconcile yourself to the idea that prices are continuous and that fundamental accounting data (as least reported) is discrete and usually highly managed. If your forecast period is anywhere below the reporting frequency of accounting information, e.g. monthly, you are essentially relying on the diverging movements between historically stated financial accounts and prices today to drive information change, and
therefore, to a large extent, turnover. This is less of a concern
when you are dealing with large, ‘grouped’ analytics like bucketing or regression analysis. It can be a much bigger concern if you are using very fine instruments, like neural nets, that will pick up subtle deviations and assign meaningful relationships to them. 5. Using conditional models like dynamic nested logits (e.g. random
forests) will probably highlight those average groups that are marginally more likely to outperform the market than some
others, but their characterization (in terms of what determines the nodes) will be extremely dynamic. Conditional factor models
(contextual models) exist today; in fact, most factor models are determined within geographic contexts (see any of the
commercially available risk models, for example) and in some case within size. This effectively means that return forecasting is conditional based on which part of the market you are in. This is difficult to justify from an economic principle standpoint because it would necessitate some amount of segmentation in either
as a way of driving returns, while another set of clients (Japan large cap) looks for something totally different. If the world was that segmented, it would be difficult (but not impossible) to argue for asset pricing being compensation for some kind of global
(undiversifiable) risk. In any case, conditional asset pricing models, whatever the empirical methodology, should work to justify why they think that prices are so dynamically driven by such different fundamentals over the relatively short period between financial statements.
In summary, the marriage of large scale but sensitive instruments like machine learning methodologies to forecasting cross sectional returns using fundamental information must be done with great care and attention. Much of the quantitative work in this area has relied on brute force (approximations) to sensitivities like beta. Researchers will find little emphasis on error correction methodologies in the
mainstream calculations of APT regressions, or of ICs, which rely on picking up broad, average relationships between signals (Z) and future returns. Occasionally (usually during high cross sectional volatility periods) there will be a presentation at a conference around non linear factor returns, to which the audience will knowingly nod in
acknowledgement but essentially fail to adjust for. The lure of the linear function f* is altogether too great and too ingrained to be easily overcome.
In the past, we have done experiments to ascertain how much additional value non linear estimators could add to simulation
tell tale signs that are usually non repeatable. Ironically, factors were built to work well as buy and hold additions to a portfolio. This means that it is especially difficult to improve on a buy and hold return by using a continuous timing mechanism, even one that is fitted. Missing one or two of the extreme return events through history, then
accounting for trading costs, will usually see the steady as she goes linear factor win, frustrating the methodologically eager researcher. Ultimately, we would be better served to generate a less well
constructed factor that had some time series characteristics and aim to time that.
1.9 CONCLUSION: LOOKING FOR NAILS
It is for scientifically minded researchers to fall in love with a new methodology and spend their time looking for problems to deploy it on. Like wielding your favourite hammer, wandering around the house looking for nails, machine learning can seem like an exciting branch of methodology with no obviously unique application. We areincreasingly seeing traditional models re estimated using machine learning techniques, and in some cases, these models could give rise to new insights. More often than not, if the models are constrained,
because they have been built and designed for linear estimation, we will need to reinvent the original problem and redesign the experiment in order to have a hope of glimpsing something brand new from the data.
A useful guiding principle when evaluating models, designing new models, or just kicking around ideas in front of a whiteboard is to ask yourself, or a colleague: ‘What have we learnt about the world here?’ Ultimately, the purpose of empirical or anecdotal investigation is to learn more about the fantastically intricate, amazing, and inspiring way in which the world functions around us, from elegant
mathematics, to messy complex systems, and the messiest of all: data. A researcher who has the conviction that they represent some kind of ‘truth’ about the world through their models, no matter what the methodology and complexity, is more likely to be believed,
remembered, and, ultimately, rewarded. We should not aggrandize or fall in love with individual models, but always seek to better our
understanding of the world, and that of our clients.
Strong pattern recognition methodologies, like machine learning, have enormous capability to add to humanity's understanding of complex systems, including financial markets, but also of many social systems. I am reminded often that those who use and wield these models
should be careful with inference, humility, and trust. The world falls in and out of love with quantification, and usually falls out of love
NOTES
1 Consider the nuances in the way that you would value a bank or a healthcare company, and contrast this to the idea that everything could be compared under the broad umbrella of a single empirical measure of book to price.
2 We are just now again beginning to prod the limits of our
understanding of factors by considering how to define them better, how to time them, all the meanwhile expanding considerable effort trying to explain them to non technical investors.
3 Early experiments are mixed, and adversarial systems have shown some of these early patterns to be extremely fragile. But as
technology grows, and our use of it too, these patterns are likely to become increasingly robust, but will retain their complexity.
4 There is an entire book that could be written on the importance of noise versus signal, but I would suggest we suspend our natural scepticism and allow for the possibility that unusual patterns do exist and could be important.
5 ‘From Bacteria to Bach and Back: The Evolution of Minds’ by Daniel C. Dennett, 2018, Penguin.
6 ‘Homo Deus: A Brief History of Tomorrow’ by Yuval Noah Harari, 2015, Vintage.
7 The Alchemy of Finance by George Soros, 2003.
8 Consider, for example, a classic state switching model, where the returns to a factor/signal persist until there is an extreme valuation or return observed, perhaps a bubble, where the state of the future returns turns out to be negative. Most forecasting models for
CHAPTER 2
Taming Big Data
2.1 INTRODUCTION: ALTERNATIVE DATA –
AN OVERVIEW
Around 20 years ago alternative data and machine learning techniques were being used by a select group of innovative hedge funds and asset managers. In recent years, however, both the number of fund
managers using alternative data and the supply of new commercially available data sources have dramatically increased.
We have identified over 600 alternative datasets which have become commercially available in the past few years. Currently, around 40 new and thoroughly vetted alternative datasets are added to the total number of alternative datasets on the Neudata platform per month. We expect the total number of datasets to increase steadily over the next few years as (i) more data exhaust firms monetize their existing data, and (ii) new and existing start ups enter the space with fresh and additional alternative data offerings.
2.1.1 Definition: Why ‘alternative’? Opposition
with conventional
For the uninitiated, the term ‘alternative data’ refers to novel data sources which can be used for investment management analysis and decision making purposes in quantitative and discretionary
investment strategies. Essentially, alternative data refers to data which was, in the main, created in the past seven years and which until very recently has not been available to the investment world. In some cases, the original purpose for creating alternative data was to provide an analysis tool for use by non investment firms – entities across a wide range of industries. In many other cases alternative data is a by
product of economic activity, often referred to as ‘exhaust data’.
Alternative data is mainly used by both the buy side and the sell side, as well as to some degree by private equity, venture capital, and
2.1.2 Alternative is not always big and big is
not always alternative
The terms ‘big data’ and ‘alternative data’ are often used
interchangeably and many use both in the context of unstructured data and in some cases to refer to large volumes of data.
The term ‘alternative data’ was initially used by data brokers and
consultants in the US and it found widespread acceptance around five years ago. The meaning of alternative data is much more widely
understood by the asset management industry in the US than in other regions: in Europe, for example, the term has become more widely recognized only as recently as 2017.
The large number of conferences and events hosted in 2016 and 2017 by the sell side, traditional data vendors, and other categories of
conference organizer has certainly helped to proliferate the awareness of alternative data. In addition, many surveys and reports on
alternative data and artificial intelligence by sell side banks, data
providers and consultants in the past year have helped to educate both the buy side and the wider industry.
2.2 DRIVERS OF ADOPTION
2.2.1 Diffusion of innovations: Where are we
now?
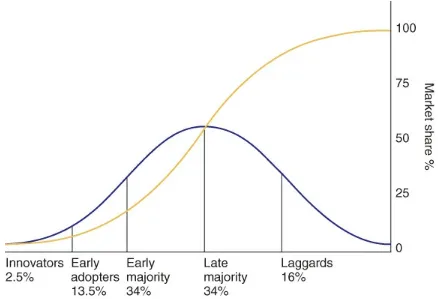
The financial industry is still in the early adoption stages with regards to alternative data (Figure 2.1). This is evidenced by the number of buy side firms actively seeking and researching alternative data sources. However, the adoption of alternative data is at the cusp of
transitioning into an early majority phase as we observe a larger
number of asset managers, hedge funds, pension funds, and sovereign wealth funds setting up alternative data research capabilities.
Figure 2.1 The law of diffusion of innovation.
Source: Rogers, 1962.
Asian funds. Most of the innovators and early adopters have
systematic and quantitative investment strategies, and, to a significant degree, consumer focused discretionary funds.
In 2017 we saw a proliferation of interest from funds using
fundamental strategies. However, despite the increased interest from these more traditional managers in using alternative data, the uptake for quantitative strategies is at a notably more rapid pace. We suspect one of the main reasons for this is operational know how. Put simply, it is more challenging for firms driven by fundamental strategies to integrate and research alternative datasets given that the required technical and data infrastructure needed is often not adequate, and that research teams frequently have significant skill set gaps. As a result, the task of evaluating, processing, ensuring legal compliance, and procuring a large number of datasets requires an overhaul of existing processes and can represent a significant organizational challenge.
For large, established traditional asset managers, one significant obstacle is the slow internal process of providing the research team with test data. This procedure often requires (i) due diligence on the new data provider, (ii) signing legal agreements for (in most cases free) test data, and (iii) approval by compliance teams. The framework for these internal processes at an asset manager, and hence the time required to organize a large number of new datasets for research teams, varies significantly. It can take from a few days/weeks at an innovative hedge fund to several months at a less data focused and less efficiently organized asset manager.
The adoption of alternative data within the investment community has been driven by the advancements of financial technology and has
improved technological capabilities for analyzing different datasets. Many investors, hedge funds, and asset managers alike view these developments as a complementary tool alongside conventional investment methodologies, offering an advantage over investment managers that have not deployed such capabilities.
Today, despite many investment professionals claiming that
this frontier is already fairly well established, given that the presence of industry practitioners is now fairly common. As noted by EY's 2017 global hedge fund and investor survey,1 when participants were asked ‘What proportion of the hedge funds in which you invest use non traditional or next generation data and “big data” analytics/artificial intelligence to support their investment process?’, the average answer was 24%. Perhaps most interestingly, when asking the same
participants what they expected that proportion to be in three years, the answer increased to 38%.
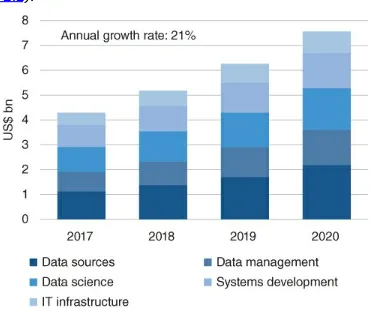
Indeed, according to Opimas Analysis,2 global spending by investment managers on alternative data is forecast to grow at a CAGR of 21% for the next four years and is expected to exceed $7 billion by 2020
(Figure 2.2).
Figure 2.2 Spending on alternative data.
2.3 ALTERNATIVE DATA TYPES, FORMATS
AND UNIVERSE
The classification of alternative data sources is challenging for several reasons. First, the information provided by the data providers
describing their offering can often be inconsistent and incomplete, and not sufficiently relevant for investment management purposes.
Second, the nature of alternative data can be complex and multi
faceted, and sources cannot easily be classified or described as a single type. Traditional sources such as tick or price data, fundamental or reference data are less complex and easier to define.
We categorize each data source into 20 different types and for most alternative data examples, multiple categories apply. For instance, an environmental, social, and governance (ESG) dataset could have components of ‘Crowd sourced’, ‘Web scraped’, ‘News’, and ‘Social media’ (Figure 2.3). To complicate things further, a dataset could also be a derived product and be made available in different formats:
1. Raw, accounting for 28% of our feed type. 2. Structured or aggregated, 35%.
Figure 2.3 Alternative dataset types.
Source: Neudata.
2.3.1 Alternative data categorization and
definitions
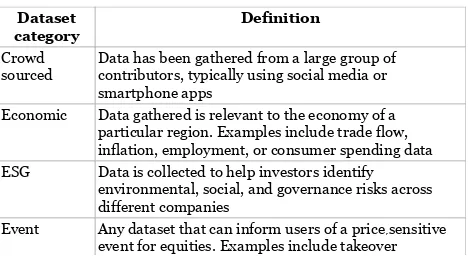
Table 2.1 Data categorization types
Source: Neudata.
Dataset
category Definition
Crowd
sourced Data has been gathered from a large group ofcontributors, typically using social media or smartphone apps
Economic Data gathered is relevant to the economy of a particular region. Examples include trade flow, inflation, employment, or consumer spending data ESG Data is collected to help investors identify
environmental, social, and governance risks across different companies
notification, catalyst calendar or trading alert offerings Financial
products Any dataset related to financial products. Examplesinclude options pricing, implied volatility, ETF, or structured products data
Fund flows Any datasets related to institutional or retail investment activity
Fundamental Data is derived from proprietary analysis techniques and relates to company fundamentals
Internet of
things Data is derived from interconnected physical devices,such as Wi Fi infrastructures and devices with embedded internet connectivity
Location Dataset is typically derived from mobile phone location data
News Data is derived from news sources including publicly available news websites, news video channels or company specific announcement vendors
Price Pricing data sourced either on or off exchange Surveys and
Polls Underlying data has been gathered using surveys,questionnaires or focus groups Satellite and
aerial Underlying data has been gathered using satellites,drones or other aerial devices Search Dataset contains, or is derived from, internet search
data
Sentiment Output data is derived from methods such as natural language processing (NLP), text analysis, audio
analysis, or video analysis
Social media Underlying data has been gathered using social media sources
Transactional Dataset is derived from sources such as receipts, bank statements, credit card, or other data transactions Weather Data is derived from sources that collect weather
Web scraping Data is derived from an automated process that
collects specific data from websites on a regular basis Web and app
tracking Data is derived from either (i) an automated processthat archives existing websites and apps and tracks specific changes to each website over time or (ii) monitoring website visitor behaviour
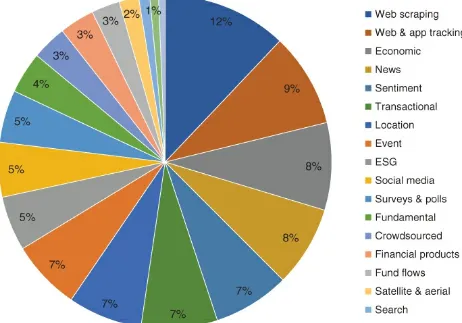
2.3.2 How many alternative datasets are there?
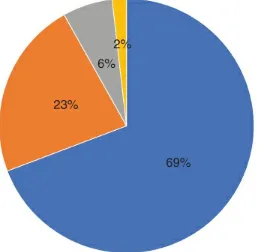
We estimate that there are over 1000 alternative data sources used by the buy side today. The majority of these – 21% (Figure 2.4) – fall into the category of web and apps related data, 8% macro economic data, which consists of several subcategories such as employment, gross domestic product (GDP), inflation, production, economic indicators, and many others (Figure 2.4).side.
Source: Neudata.
The first six data categories make up 50% of all data sources. It is important to note that a dataset can be classified in multiple categories. One dataset could consist of multiple sources and be applicable for different use cases.
However, the way of using these data sources in investment
2.4 HOW TO KNOW WHAT ALTERNATIVE
DATA IS USEFUL (AND WHAT ISN'T)
The ultimate question for many fund managers is which data source to select for research or to backtest. One of the key questions is, which dataset is easily actionable? How much data cleaning, mapping, and preparation work has to be carried out to prepare and to integrate a dataset within a research database?
One way we attempt to answer these questions is by scoring each dataset on the eight factors in Table 2.2. Understandably, each fund manager will have a different opinion on which are the most important of the factors in Table 2.2. Many will have particular ‘hard stops’. For example, one may want to backtest a dataset only if it has at least five years of history, costs less than $50 000 per year, is updated at least daily, and is relevant to at least 1000 publicly listed equities.
Table 2.2 Key criteria for assessing alternative data usefulness
Source: Neudata.
Factor Description
Data history length
The earliest point from which historical point in time data is available
Data
frequency The frequency with which data can be delivered Universe
coverage How many investable companies the dataset relates to Market
obscurity Neudata's assessment of how well known this dataset isto institutional investors Crowding
factor Neudata's estimate of how many hedge funds and assetmanagement clients are using this dataset Uniqueness Neudata's assessment of how unique this specific dataset
is
quality structure, accuracy and timeliness of data Annual
price Annual subscription price charged by the data provider Of course, the above factors are only an initial overview in order for institutional investors to ascertain exactly how one dataset varies from the next. Beyond this, there are numerous qualitative factors that need to be taken into account in order to gauge whether a dataset is worth investigating further. This is carried out through a thorough
investigation process, which attempts to answer between 80 and 100 questions which reflect the queries we most frequently receive from the investment community. Examples include:
1. What are the underlying sources of the data?
2. Exactly how is the data collected and subsequently delivered? 3. Was the data as complete three years ago as it is today?
4. How has the panel size changed over time and what are the biases?
5. How timely is the data delivery? 6. Is the data ‘point in time’?
7. Is the data mapped to identifiers or tickers, and if so, how? 8. How is this dataset differentiated from similar offerings? 9. What institutional investors have so far been interested in the
offering, if any?
10. What is the geographical coverage and how might this expand? 11. What is the specific list of investable companies related to this
dataset?
We find answers to these questions by holding multiple meetings with the data provider, reviewing sample data (which is often shared with interested clients), and reviewing independent relevant sources (e.g. academic papers). In carrying out these steps, not only is a
2.5 HOW MUCH DOES ALTERNATIVE DATA
COST?
One of the most challenging questions for both the data providers and purchasers of alternative data is how to determine the price of a
dataset.
For many new data provider entrants to the financial services industry it can be very difficult to work out a price, for two reasons. The first is that in many cases new providers' understanding and knowledge of peer or comparable data subscription pricings is non existent or very limited. Second, data providers do not know how their data will be used by the buy side and how much value or alpha a dataset provides to an asset manager. To an asset manager, the value add of a dataset will be dependent on many factors, such as investment strategy, time horizon, universe size, and many other factors that will be unique to a fund manager strategy. The marginal alpha of a new alternative
dataset could be too small if the new data source is highly correlated with datasets already used by an asset manager.
For asset managers starting to research alternative data, the challenge is in budgeting for data subscriptions. Annual data subscription prices will vary widely depending on the data formats (as described in
Section 2.3), data quality, and other data provider specific factors. The price of alternative datasets ranges from free to $2.5 million annual subscription fees. About 70% of all datasets are priced in the range of $1–150 000 per year. There are also several free alternative datasets. However, for some free data sources there might be the indirect cost of data retrieval, cleaning, normalizing, mapping to identifiers, and other preparations to make these data sources useful for research and
Figure 2.5 Breakdown of dataset's annual price.
2.6 CASE STUDIES
Five examples are shown below which have been sourced by Neudata's data scouting team in the past year. Only summarized extracts from full reports are given, and provider names have been obfuscated.
2.6.1 US medical records
Provider: an early stage data provider capable of delivering healthcare brand sales data within three days of prescription.
2.6.1.1 Summary The group provides insights into the healthcare sector derived from medical records. For the past seven years the firm has partnered with medical transcription companies across the US and uses natural language processing (NLP) techniques to process data. The dataset offers around 20 million medical transcription records covering all 50 states, with 1.25 million new records added every month (250 000 every month in 2016), 7000 physicians covering every specialty, and 7 million patients. Data becomes available as quickly as 72 hours after the patient leaves the doctor's office and can be accessed in either unstructured or structured format (CSV file).
2.6.1.2 Key Takeaways The group claims to be the only company commercializing this data. To date the offering has been used for (i) tracking a medication immediately following launch, (ii) investigating the reasons behind the underutilization of particular brands, and (iii) spotting adverse events involving a company product and label
expansion before FDA approval.
Figure 2.6 Neudata's rating for medical record dataset.
Source: Neudata.
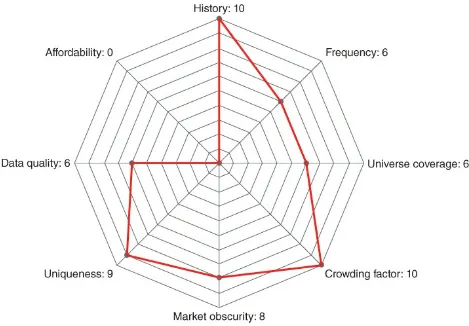
2.6.2 Indian power generation data
Provider: an established data provider yet to launch a daily data delivery pertaining to the Indian power sector.
2.6.2.1 Summary This data provider's core business involves
2.6.2.2 Key Takeaways We believe this is a unique offering given the granularity of data and delivery frequency. Comprehensive
granularity, such as power generation at the plant level, can be provided from 2014. Less detailed datasets can be provided from as early as 2012. Once launched, the dataset can be delivered through an API feed.
2.6.2.3 Status No clients to date are using this dataset and the group is actively seeking out institutions that would find such a dataset
useful. On finding interested parties, we understand it would take around four weeks to set up an API feed (Figure 2.7).
Figure 2.7 Neudata's rating for Indian power generation dataset.
Source: Neudata.
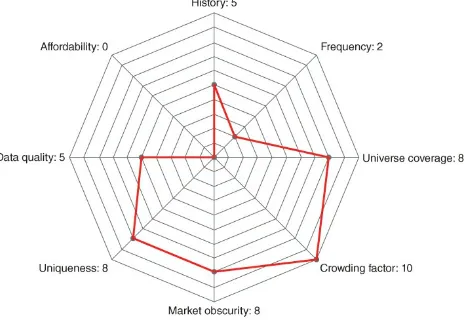
provides earnings performance forecasts for 360 US companies, predominantly within the retail sector.
2.6.3.1 Summary Launched in September 2016, this offering
combines (i) online user search data, (ii) geolocation data from a panel of 65 million devices, and (iii) point of sale transaction data. The
output is a quarterly signal designed to give clients an idea of how well a given company has performed relative to previous quarters. The earnings signals are delivered between 3 and 10 days after a given company's fiscal quarter end via FTP or the group's website. Historical data for the entire universe is available from late 2012.
2.6.3.2 Key Takeaways Prospective users should be aware that (i) rather than an absolute earnings figure, only relative earnings
measures are provided for each company on an arbitrary scale compared with previous periods, (ii) out of sample data for the
recently expanded universe is only four months old, (iii) until recently this offering covered only around 60 US stocks; in August 2017, the universe was widened to 360 stocks and expanded beyond the retail sector to include cinema, restaurant, and hotel chains. Since this time the group has informed us that client interest has picked up
significantly.
Figure 2.8 Neudata's rating for US earnings performance forecast.
Source: Neudata.
2.6.4 China manufacturing data
Provider: a data provider using advanced satellite imagery analysis in order to assist users in tracking economic activity in China.
2.6.4.1 Summary This offering is a manufacturing index, which is calculated based on images of around 6000 industrial sites across mainland China, covering 500 000 km2. Datapoints that are used to construct the index are delivered to clients via CSV file three times per week with a two week delay. History is available from 2004.
questioned by observers for a lack of accuracy and reliability.
2.6.4.3 Status The group began selling the underlying data to the quantitative division of a large multinational bank in early 2017. Other quants more recently have become interested, and to date the group has four clients receiving the same underlying data. Due to client demand, the group is undergoing a mapping process of specific industrial sites to underlying companies using CUSIPs, which is expected to be completed by early 2018 (Figure 2.9).
Figure 2.9 Neudata's rating for China manufacturing dataset.
Source: Neudata.
2.6.5 Short position data
Provider: this company collects, consolidates and analyzes ownership data for publicly traded securities held by over 600 investment
2.6.5.1 Summary The group collects disclosures from regulators in over 30 countries which detail long and short positions for around 3200 equities. These disclosures are consolidated by an investment manager and allow clients to perform their own analytics on the
aggregated output. For example, clients can discover how many other managers have entered the same short position on a given stock over a particular time period and how large their position is. Updates are provided on a daily basis and historical data is available from 2012.
2.6.5.2 Key Takeaways Ownership data is presented in a simple, standardized format that is easy to analyze. Conversely, data presented by regulators often isn't standardized and at times can be misleading. For example, many asset managers disclose short positions under different names, which may be an attempt to understate their position. The data collection methodology behind this offering, however, is able to recognize this activity and aggregate disclosures accordingly,
presenting a global, accurate, manager level holding for a given security.
2.6.5.3 Status The group expanded in 2017, in terms of both
coverage (in 2H17 Nordic and additional Asian countries, including Taiwan, Singapore, and South Korea were added) and asset