Giovanni Giuffrida · Giuseppe Nicosia (Eds.)
123
LNCS 10122
Second International Workshop, MOD 2016
Volterra, Italy, August 26–29, 2016
Revised Selected Papers
Machine Learning,
Optimization,
Commenced Publication in 1973 Founding and Former Series Editors:
Gerhard Goos, Juris Hartmanis, and Jan van Leeuwen
Editorial Board
David HutchisonLancaster University, Lancaster, UK Takeo Kanade
Carnegie Mellon University, Pittsburgh, PA, USA Josef Kittler
University of Surrey, Guildford, UK Jon M. Kleinberg
Cornell University, Ithaca, NY, USA Friedemann Mattern
ETH Zurich, Zurich, Switzerland John C. Mitchell
Stanford University, Stanford, CA, USA Moni Naor
Weizmann Institute of Science, Rehovot, Israel C. Pandu Rangan
Indian Institute of Technology, Madras, India Bernhard Steffen
TU Dortmund University, Dortmund, Germany Demetri Terzopoulos
University of California, Los Angeles, CA, USA Doug Tygar
University of California, Berkeley, CA, USA Gerhard Weikum
Giovanni Giuffrida
•Giuseppe Nicosia (Eds.)
Machine Learning,
Optimization,
and Big Data
Second International Workshop, MOD 2016
Volterra, Italy, August 26
–
29, 2016
Revised Selected Papers
Department of Industrial and Systems Engineering
University of Florida Gainesville, FL USA
Piero Conca
Semantic Technology Laboratory National Research Council (CNR) Catania
Italy
Dipartimento di Sociologia e Metodi della Ricerca Sociale
Universitàdi Catania Catania
Italy
Giuseppe Nicosia
Department of Mathematics and Computer Science
University of Catania Catania
Italy
ISSN 0302-9743 ISSN 1611-3349 (electronic) Lecture Notes in Computer Science
ISBN 978-3-319-51468-0 ISBN 978-3-319-51469-7 (eBook) DOI 10.1007/978-3-319-51469-7
Library of Congress Control Number: 2016961276
LNCS Sublibrary: SL3–Information Systems and Applications, incl. Internet/Web, and HCI ©Springer International Publishing AG 2016
This work is subject to copyright. All rights are reserved by the Publisher, whether the whole or part of the material is concerned, specifically the rights of translation, reprinting, reuse of illustrations, recitation, broadcasting, reproduction on microfilms or in any other physical way, and transmission or information storage and retrieval, electronic adaptation, computer software, or by similar or dissimilar methodology now known or hereafter developed.
The use of general descriptive names, registered names, trademarks, service marks, etc. in this publication does not imply, even in the absence of a specific statement, that such names are exempt from the relevant protective laws and regulations and therefore free for general use.
The publisher, the authors and the editors are safe to assume that the advice and information in this book are believed to be true and accurate at the date of publication. Neither the publisher nor the authors or the editors give a warranty, express or implied, with respect to the material contained herein or for any errors or omissions that may have been made.
Printed on acid-free paper
This Springer imprint is published by Springer Nature The registered company is Springer International Publishing AG
MOD is an international workshop embracing the fields of machine learning, opti-mization, and big data. The second edition, MOD 2016, was organized during August 26–29, 2016, in Volterra (Pisa, Italy), a stunning medieval town dominating the pic-turesque countryside of Tuscany.
The key role of machine learning, optimization, and big data in developing solutions to some of the greatest challenges we are facing is undeniable. MOD 2016 attracted leading experts from the academic world and industry with the aim of strengthening the connection between these institutions. The 2016 edition of MOD represented a great opportunity for professors, scientists, industry experts, and postgraduate students to learn about recent developments in their own research areas and to learn about research in contiguous research areas, with the aim of creating an environment to share ideas and trigger new collaborations.
As program chairs, it was an honor to organize a premiere workshop in these areas and to have received a large variety of innovative and original scientific contributions.
During this edition, four plenary lectures were presented: Nello Cristianini, Bristol University, UK
George Michailidis, University of Florida, USA Stephen H. Muggleton, Imperial College London, UK Panos Pardalos, University of Florida, USA
There were also two tutorial speakers:
Luigi Malagó, Shinshu University, Nagano, Japan
Luca Oneto and Davide Anguita, Polytechnic School, University of Genova, Italy Furthermore, an industrial panel on “Machine Learning, Optimization and Data Science for Real-World Applications”was also offered:
Amr Awadallah, Founder and CTO at Cloudera, San Francisco, USA Giovanni Giuffrida, CEO and co-founder at Neodata Group, Italy
Andy Petrella, Data Scientist and co-founder at Data Fellas, Liege, Belgium Daniele Quercia, Head of Social Dynamics group at Bell Labs, Cambridge, UK Fabrizio Silvestri, Facebook Inc., USA
Moderator: Donato Malerba, University of Bari, Italy and Consorzio Interuniver-sitario Nazionale per l’Informatica (CINI)
This conference could not have been organized without the contributions of these researchers, and we thank them all for participating. A sincere thank goes also to all the Program Committee, formed by more than 300 scientists from academia and industry, for their valuable work of selecting the scientific contributions.
Finally, we would like to express our appreciation to the keynote speakers, tutorial speakers, and the industrial panel who accepted our invitation, and to all the authors who submitted their research papers to MOD 2016.
August 2016 Panos M. Pardalos
MOD 2016 Committees
General Chair
Giuseppe Nicosia University of Catania, Italy Conference and Technical Program Committee Co-chairs Panos Pardalos University of Florida, USA Piero Conca University of Catania, Italy Giovanni Giuffrida University of Catania, Italy Giuseppe Nicosia University of Catania, Italy Tutorial Chair
Giuseppe Narzisi New York Genome Center, NY, USA Industrial Session Chairs
Ilaria Bordino UniCredit R&D, Italy Marco Firrincieli UniCredit R&D, Italy Fabio Fumarola UniCredit R&D, Italy Francesco Gullo UniCredit R&D, Italy Organizing Committee
Piero Conca CNR and University of Catania, Italy Jole Costanza Italian Institute of Technology, Milan, Italy Giuseppe Narzisi New York Genome Center, USA
Andrea Patane’ University of Catania, Italy Andrea Santoro University of Catania, Italy Renato Umeton Harvard University, USA Publicity Chair
Giovanni Luca Murabito DiGi Apps, Italy Technical Program Committee
Ajith Abraham Machine Intelligence Research Labs, USA Andy Adamatzky University of the West of England, UK Agostinho Agra University of Aveiro, Portugal
Youhei Akimbo Shinshu University, Japan Leman Akoglu Stony Brook University, USA Richard Allmendinger University College London, UK Paula Amaral University Nova de Lisboa, Portugal Ekart Aniko Aston University, UK
Paolo Arena University of Catania, Italy Ashwin Arulselvan University of Strathclyde, UK Jason Atkin University of Nottingham, UK Martin Atzmueller University of Kassel, Germany Chloé-Agathe Azencott Mines ParisTech Institut Curie, France Jaume Bacardit Newcastle University, UK
James Bailey University of Melbourne, Australia Baski Balasundaram Oklahoma State University, USA Wolfgang Banzhaf Memorial University, Canada
Helio Barbosa Laboratório Nacional Computação Científica, Brazil Thomas Bartz-Beielstein Cologne University of Applied Sciences, Germany Simone Bassis University of Milan, Italy
Christian Bauckhage Fraunhofer IAIS, Germany Aurélien Bellet Télécom ParisTech, France
Gerardo Beni University of California at Riverside, USA Tanya Berger-Wolf University of Illinois at Chicago, USA Heder Bernardino Universidade Federal de Juiz de Fora, Brazil Daniel Berrar Shibaura Institute of Technology, Japan Martin Berzins University of Utah, USA
Rajdeep Bhowmik Cisco Systems, Inc., USA
Albert Bifet University of Waikato, New Zealand Mauro Birattari UniversitéLibre de Bruxelles, Belgium J. Blachut University of Liverpool, UK
Konstantinos Blekas University of Ioannina, Greece
Maria J. Blesa Universitat Politècnica de Catalunya, Spain Christian Blum Basque Foundation for Science, Spain Flavia Bonomo Universidad de Buenos Aires, Argentina Gianluca Bontempi UniversitéLibre de Bruxelles, Belgium Pascal Bouvry University of Luxembourg, Luxembourg Larry Bull University of the West of England, UK Tadeusz Burczynski Polish Academy of Sciences, Poland Róbert Busa-Fekete University of Paderborn, Germany Sergio Butenko Texas A&M University, USA Stefano Cagnoni University of Parma, Italy
Mustafa Canim IBM T.J. Watson Research Center, USA Luigia Carlucci Aiello Sapienza Universitàdi Roma, Italy Tania Cerquitelli Politecnico di Torino, Italy
Uday Chakraborty University of Missouri St. Louis, USA Lijun Chang University of New South Wales, Australia W. Art Chaovalitwongse University of Washington, USA
Koke Chen Wright State University, USA Kaifeng Chen NEC Labs America, USA Silvia Chiusano Politecnico di Torino, Italy Miroslav Chlebik University of Sussex, UK Sung-Baa Cho Yonsei University, South Korea
Siang Yew Chong University of Nottingham, Malaysia Campus, Malaysia Philippe Codognet University of Tokyo, Japan
Pietro Colombo Universitàdell’Insubria, Italy Ernesto Costa University of Coimbra, Portugal
Jole Costanza Fondazione Istituto Italiano di Tecnologia, Italy Maria Daltayanni University of California Santa Cruz, USA Raj Das University of Auckland, New Zealand Mahashweta Das Hewlett Packard Labs, USA
Kalyanmoy Deb Michigan State University, USA Noel Depalma Joseph Fourier University, France Clarisse Dhaenens University of Lille 1, France Luigi Di Caro University of Turin, Italy Gianni Di Caro IDSIA, Switzerland Tom Diethe University of Bristol, UK
Federico Divina Pablo de Olavide University, Spain Stephan Doerfel University of Kassel, Germany
Karl Doerner Johannes Kepler University Linz, Austria
Rafal Drezewski AGH University of Science and Technology, Poland Ding-Zhou Du University of Texas at Dallas, USA
George S. Dulikravich Florida International University, USA Talbi El-Ghazali University of Lille, France
Michael Emmerich Leiden University, The Netherlands Andries Engelbrecht University of Pretoria, South Africa Roberto Esposito University of Turin, Italy
Cesar Ferri Universitat Politècnica de València, Spain
Steffen Finck Vorarlberg University of Applied Sciences, Austria Jordi Fonollosa Institute for Bioengineering of Catalonia, Spain Carlos M. Fonseca University of Coimbra, Portugal
Giuditta Franco University of Verona, Italy Piero Fraternali Politecnico di Milano, Italy Valerio Freschi University of Urbino, Italy Enrique Frias-Martinez Telefonica Research, Spain
Marcus Gallagher University of Queensland, Australia Patrick Gallinari Pierre et Marie Curie University, France Xavier Gandibleux University of Nantes, France
Amir Hossein Gandomi The University of Akron, USA Inmaculada Garcia
Fernandez
University of Almeria, Spain
Deon Garrett Icelandic Institute Intelligent Machine, Iceland Paolo Garza Politecnico di Torino, Italy
Michel Gendreau École Polytechnique de Montréal, Canada Kyriakos Giannakoglou National Technical University of Athens, Greece Giovanni Giuffrida University of Catania, Italy and Neodata Intelligence
Inc., Italy
Aris Gkoulalas Divanis IBM Dublin Research Lab, Ireland Christian Gogu UniversitéToulouse III, France Michael Granitzer University of Passau, Germany Mario Guarracino ICAR-CNR, Italy
Heiko Hamann University of Paderborn, Germany Jin-Kao Hao University of Angers, France William Hart Sandia Labs, USA
Richard F. Hartl University of Vienna, Austria
Mohammad Hasan Indiana University Purdue University, USA
Geir Hasle SINTEF, Norway
Verena Heidrich-Meisner Extraterrestrial Physics CAU Kiel, Germany Eligius Hendrix Universidad de Málaga, Spain
Carlos Henggeler Antunes University of Coimbra, Portugal Alfredo G. Hernández-Díaz Pablo de Olvide University, Spain Francisco Herrera University of Granada, Spain J. Michael Herrmann University of Edinburgh, UK Jaakko Hollmén Aalto University, Finland Vasant Honavar Penn State University, USA Hongxuan Huang Tsinghua University, China Fabric Huet University of Nice, France
Sam Idicula Oracle, USA
Yoshiharu Ishikawa Nagoya University, Japan Christian Jacob University of Calgary, Canada Hasan Jamil University of Idaho, USA Gareth Jones Dublin City University, Ireland Laetitia Jourdan Inria/LIFL/CNRS, France
Narendra Jussien Ecole des Mines de Nantes/LINA, France Valeriy Kalyagin Higher School of Economics, Russia George Karakostas McMaster University, Canada George Karypis University of Minnesota, USA Ioannis Katakis University of Athens, Greece Saurabh Kataria Xerox Research, USA
Graham Kendall University of Nottingham, UK Kristian Kersting TU Dortmund University, Germany Zeynep Kiziltan University of Bologna, Italy Joshua Knowles University of Manchester, UK
Andrzej Kochut IBM T.J. Watson Research Center, USA Yun Sing Koh University of Auckland, New Zealand Igor Konnov Kazan University, Russia
Petros Koumoutsakos ETHZ, Switzerland
Halina Kwasnicka Wroclaw University of Technology, Poland Joerg Laessig University of Applied Sciences Zittau/Görlitz,
Germany
Albert Y.S. Lam The University of Hong Kong, Hong Kong, SAR China
Niklas Lavesson Blekinge Institute of Technology, Sweden
Kang Li Groupon Inc., USA
Edo Liberty Yahoo Labs, USA
Arnaud Liefooghe University of Lille, France
Weifeng Liu China University of Petroleum, China Giosue’Lo Bosco Universitàdi Palermo, Italy
Fernando Lobo University of Algarve, Portugal Marco Locatelli University of Parma, Italy Manuel Lopez-Ibanez University of Manchester, UK
Jose A. Lozano The University of the Basque Country, Spain Paul Lu University of Alberta, Canada
Angelo Lucia University of Rhode Island, USA Luigi Malagò Shinshu University, Japan
Lina Mallozzi University of Naples Federico II, Italy Vittorio Maniezzo University of Bologna, Italy
Yannis Manolopoulos Aristotle University of Thessaloniki, Greece Marco Maratea University of Genova, Italy
Elena Marchiori Radboud University, The Netherlands Tiziana Margaria Lero, Ireland
Juan Enrique Martinez-Legaz
Universitat Autònoma de Barcelona, Spain Basseur Matthieu LERIA Angers, France
Giancarlo Mauri University of Milano-Bicocca, Italy
Suzanne McIntosh NYU Courant Institute and Cloudera Inc., USA
Gabor Melli VigLink, USA
Silja Meyer-Nieberg Universität der Bundeswehr München, Germany Alessio Micheli University of Pisa, Italy
Martin Middendorf University of Leipzig, Germany Taneli Mielikäinen Nokia, Finland
Kaisa Miettinen University of Jyväskylä, Finland Marco A. Montes De Oca Clypd, Inc., USA
Antonio Mora University of Granada, Spain
Christian L. Müller Simons Center for Data Analysis, USA Mohamed Nadif University of Paris Descartes, France
Hidemoto Nakada National Institute of Advanced Industrial, Japan Amir Nakib UniversitéParis Est Créteil, France
Mirco Nanni ISTI-CNR Pisa, Italy Giuseppe Nicosia University of Catania, Italy Jian-Yun Nie Universitéde Montréal, Canada Xia Ning Indiana University Purdue, USA
Salvatore Orlando UniversitàCa’Foscari Venezia, Italy
Sinno Jialin Pan Nanyang Technological University, Singapore
Pan Pan Alibaba Inc., China
George Papastefanatos IMIS/RC Athena, Greece Luis Paquete University of Coimbra, Portugal Andrew J. Parkes University of Nottingham, USA Ioannis Partalas Viseo R&D, France
Jun Pei University of Florida, USA Nikos Pelekis University of Piraeus, Greece David Pelta University of Granada, Spain Diego Perez University of Essex, UK Vincenzo Piuri University of Milan, Italy Silvia Poles Noesis Solutions NV, Belgium George Potamias FORTH-ICS, Greece
Adam Prugel-Bennett University of Southampton, UK
Buyue Qian IBM T.J. Watson Research Center, USA Chao Qian Nanjing University, China
Günther Rail Technische Universität Wien, Austria Helena Ramalhinho Universitat Pompeu Fabra, Spain Jan Ramon Inria Lille, France
Vitorino Ramos Technical University of Lisbon, Portugal Zbigniew Ras University of North Carolina, USA Khaled Rasheed University of Georgia, USA
Jan Rauch University of Economics Prague, Czech Republic Steffen Rebennack University of Florida, USA
Celso Ribeiro Universidade Federal Fluminense, Brazil Florian Richoux Universitéde Nantes, France
Juan J. Rodriguez University of Burgos, Spain Andrea Roli University of Bologna, Italy Samuel Rota Bulò Fondazione Bruno Kessler, Italy Arnab Roy Fujitsu Laboratories of America, USA Alessandro Rozza Universitàdi Napoli-Parthenope, Italy Thomas Runarsson University of Iceland, Iceland Berc Rustem Imperial College London, UK
Florin Rusu University of California, Merced, USA Nick Sahinidis Carnegie Mellon University, USA Lorenza Saitta Universitàdel Piemonte Orientale, Italy Horst Samulowitz IBM Research, USA
Ganesh Ram Santhanam Iowa State University, USA Vítor Santos Costa Universidade do Porto, Portugal Claudio Sartori University of Bologna, Italy Frédéric Saubion University of Angers, France Andrea Schaerf University of Udine, Italy
Robert Schaefer AGH University of Science and Technology, Poland Fabio Schoen University of Florence, Italy
Oliver Schuetze CINVESTAV-IPN, Mexico Michèle Sebag University of Paris-Sud, France Giovanni Semeraro University of Bari, Italy
Roberto Serra University of Modena Reggio Emilia, Italy Marc Sevaux Universitéde Bretagne-Sud, France
Junming Shao University of Electronic Science and Technology, China
Ruey-Lin Sheu National Cheng-Kung University, Taiwan Patrick Siarry Universitéde Paris 12, France
Dan Simovici University of Massachusetts Boston, USA Karthik Sindhya University of Jyväskylä, Finland
Anthony Man-ChoSo The Chinese University of Hong Kong, Hong Kong, SAR China
Christine Solnon LIRIS—CNRS, France
Oliver Stein Karlsruhe Institute of Technology, Germany Catalin Stoean University of Craiova, Romania
Thomas Stützle UniversitéLibre de Bruxelles, Belgium Ponnuthurai Suganthan Nanyang Technological University, Singapore Johan Suykens K.U. Leuven, Belgium
El-Ghazali Talbi University of Lille, France Domenico Talia University of Calabria, Italy
Wei Tan IBM, USA
Letizia Tanca Politecnico di Milano, Italy
Ke Tang University of Science and Technology of China, China Andrea Tettamanzi University Nice Sophia Antipolis, France
Jerzy Tiuryn Warsaw University, Poland
Heike Trautmann TU Dortmund University, Germany Vincent S. Tseng National Chiao Tung University, Taiwan Theodoros Tzouramanis University of the Aegean, Greece Satish Ukkusuri Purdue University, USA
Giorgio Valentini University of Milan, Italy Pascal Van Hentenryck University of Michigan, USA
Analucia Varbanescu University of Amsterdam, The Netherlands Carlos A. Varela Rensselaer Polytechnic Institute, USA Iraklis Varlamis Harokopio University of Athens, Greece Eleni Vasilaki University of Sheffield, UK
Sébastien Verel Universitédu Littoral Côte d’Opale, France Vassilios Verykios Hellenic Open University, Greece
Henna Viktor University of Ottawa, Canada Maksims Volkovs University of Toronto, Canada Dean Vucinic Vrije Universiteit Brussel, Belgium Jason Wang New Jersey Institute of Technology, USA Jianwu Wang University of Maryland, USA
Lipo Wang NTU, Singapore
Yinglong Xia IBM T.J. Watson Research Center, USA Ning Xiong Mälardalen University, Sweden
Chang Xu Peking University, China
Xin Xu George Washington University, USA Shengxiang Yang De Montfort University, UK
Qi Yu Rochester Institute of Technology, USA Tina Yu Memorial University of Newfoundland, Canada Kunpeng Zhang University of Illinois at Chicago, USA
Nan Zhang The George Washington University, USA Qingfu Zhang City University of Hong Kong, Hong Kong,
SAR China
Rui Zhang IBM Research—Almaden, USA
Machine Learning: Multi-site Evidence-Based Best Practice Discovery . . . 1 Eva K. Lee, Yuanbo Wang, Matthew S. Hagen, Xin Wei,
Robert A. Davis, and Brent M. Egan
Data-Based Forest Management with Uncertainties and Multiple Objectives . . . 16 Markus Hartikainen, Kyle Eyvindson, Kaisa Miettinen,
and Annika Kangas
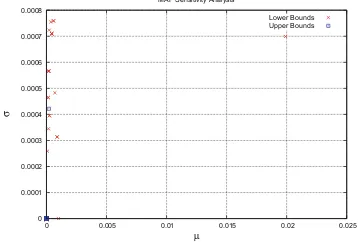
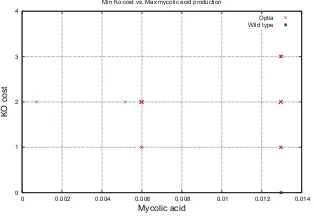
Metabolic Circuit Design Automation by Multi-objective BioCAD . . . 30 Andrea Patané, Piero Conca, Giovanni Carapezza, Andrea Santoro,
Jole Costanza, and Giuseppe Nicosia
A Nash Equilibrium Approach to Metabolic Network Analysis . . . 45 Angelo Lucia and Peter A. DiMaggio
A Blocking Strategy for Ranking Features According
to Probabilistic Relevance . . . 59 Gianluca Bontempi
A Scalable Biclustering Method for Heterogeneous Medical Data . . . 70 Maxence Vandromme, Julie Jacques, Julien Taillard,
Laetitia Jourdan, and Clarisse Dhaenens
Neural Learning of Heuristic Functions for General Game Playing . . . 82 Leo Ghignone and Rossella Cancelliere
Comparing Hidden Markov Models and Long Short Term Memory
Neural Networks for Learning Action Representations . . . 94 Maximilian Panzner and Philipp Cimiano
Dynamic Multi-Objective Optimization with jMetal and Spark:
A Case Study . . . 106 JoséA. Cordero, Antonio J. Nebro, Cristóbal Barba-González,
Juan J. Durillo, JoséGarcía-Nieto, Ismael Navas-Delgado, and JoséF. Aldana-Montes
Feature Selection via Co-regularized Sparse-Group Lasso. . . 118 Paula L. Amaral Santos, Sultan Imangaliyev, Klamer Schutte,
and Evgeni Levin
Economic Lot-Sizing Problem with Remanufacturing Option:
A Branch-and-Cut Algorithm for a Multi-item Inventory
Distribution Problem . . . 144 Agostinho Agra, Adelaide Cerveira, and Cristina Requejo
Adaptive Targeting in Online Advertisement: Models Based
on Relative Influence of Factors . . . 159 Andrey Pepelyshev, Yuri Staroselskiy, Anatoly Zhigljavsky,
and Roman Guchenko
Design of Acoustic Metamaterials Through Nonlinear Programming . . . 170 Andrea Bacigalupo, Giorgio Gnecco, Marco Lepidi,
and Luigi Gambarotta
Driver Maneuvers Inference Through Machine Learning . . . 182 Mauro Maria Baldi, Guido Perboli, and Roberto Tadei
A Systems Biology Approach for Unsupervised Clustering
of High-Dimensional Data . . . 193 Diana Diaz, Tin Nguyen, and Sorin Draghici
Large-Scale Bandit Recommender System . . . 204 Frédéric Guillou, Romaric Gaudel, and Philippe Preux
Automatic Generation of Sitemaps Based on Navigation Systems . . . 216 Pasqua Fabiana Lanotte, Fabio Fumarola, Donato Malerba,
and Michelangelo Ceci
A Customer Relationship Management Case Study Based on Banking Data . . . 224 Ivan Luciano Danesi and Cristina Rea
Lagrangian Relaxation Bounds for a Production-Inventory-Routing
Problem . . . 236 Agostinho Agra, Adelaide Cerveira, and Cristina Requejo
Convergence Rate Evaluation of Derivative-Free Optimization Techniques . . . 246 Thomas Lux
The Learnability of Business Rules . . . 257 Olivier Wang, Changhai Ke, Leo Liberti, and Christian de Sainte Marie
Dynamic Programming with Approximation Function for Nurse Scheduling . . . 269 Peng Shi and Dario Landa-Silva
Breast Cancer’s Microarray Data: Pattern Discovery Using Nonnegative
Matrix Factorizations . . . 281 Nicoletta Del Buono, Flavia Esposito, Fabio Fumarola,
Optimizing the Location of Helicopter Emergency Medical Service
Operating Sites . . . 293 Maurizio Bruglieri, Cesare Cardani, and Matteo Putzu
An Enhanced Infra-Chromatic Bound for the Maximum Clique Problem . . . . 306 Pablo San Segundo, Jorge Artieda, Rafael Leon, and Cristobal Tapia
Cultural Ant Colony Optimization on GPUs for Travelling
Salesman Problem . . . 317 Olgierd Unold and Radosław Tarnawski
Combining Genetic Algorithm with the Multilevel Paradigm
for the Maximum Constraint Satisfaction Problem . . . 330 Noureddine Bouhmala
Implicit Location Sharing Detection in Social Media Turkish
Text Messaging . . . 341 Davut Deniz Yavuz and Osman Abul
Fuzzy Decision-Making of a Process for Quality Management . . . 353 Feyza Gürbüz and Panos M. Pardalos
A Bayesian Network Profiler for Wildfire Arsonists . . . 379 Rosario Delgado, JoséLuis González, Andrés Sotoca,
and Xavier-Andoni Tibau
Learning Optimal Decision Lists as a Metaheuristic Search for Diagnosis
of Parkinson’s Disease. . . 391 Fernando de Carvalho Gomes and JoséGilvan Rodrigues Maia
Hermes: A Distributed-Messaging Tool for NLP . . . 402 Ilaria Bordino, Andrea Ferretti, Marco Firrincieli, Francesco Gullo,
Marcello Paris, and Gianluca Sabena
Deep Learning for Classification of Dental Plaque Images . . . 407 Sultan Imangaliyev, Monique H. van der Veen,
Catherine M.C. Volgenant, Bart J.F. Keijser, Wim Crielaard, and Evgeni Levin
Multiscale Integration for Pattern Recognition in Neuroimaging . . . 411 Margarita Zaleshina and Alexander Zaleshin
Game Theoretical Tools for Wing Design . . . 419 Lina Mallozzi, Giovanni Paolo Reina, Serena Russo,
Fastfood Elastic Net: Combining Variable Selection with Kernel
Expansion Approximations . . . 427 Sonia Kopel, Kellan Fluette, Geena Glen, and Paul E. Anderson
Big Data Analytics in a Public General Hospital . . . 433 Ricardo S. Santos, Tiago A. Vaz, Rodrigo P. Santos,
and JoséM. Parente de Oliveira
Inference of Gene Regulatory Network Based on Radial Basis Function
Neural Network . . . 442 Sanrong Liu, Bin Yang, and Haifeng Wang
Establishment of Optimal Control Strategy of Building-Integrated Photovoltaic Blind Slat Angle by Considering Interior Illuminance
and Electricity Generation . . . 451 Taehoon Hong, Jeongyoon Oh, Kwangbok Jeong, Jimin Kim,
and Minhyun Lee
Best Practice Discovery
Eva K. Lee1,2,3(&), Yuanbo Wang1,2,3, Matthew S. Hagen1,2,3, Xin Wei1,2,3, Robert A. Davis4,5, and Brent M. Egan4,5 1 Center for Operations Research in Medicine and HealthCare,
Atlanta, GA, USA [email protected] 2
NSF I/UCRC Center for Health Organization Transformation, Atlanta, GA, USA
3
Georgia Institute of Technology, Atlanta, GA, USA 4
University of South Carolina School of Medicine, Greenville, SC, USA 5
Care Coordination Institute, Greenville, SC, USA
Abstract. This study establishes interoperability among electronic medical records from 737 healthcare sites and performs machine learning for best practice discovery. A mapping algorithm is designed to disambiguate free text entries and to provide a unique and unified way to link content to structured medical concepts despite the extreme variations that can occur during clinical diagnosis documentation. Redundancy is reduced through concept mapping. A SNOMED-CT graph database is created to allow for rapid data access and queries. These integrated data can be accessed through a secured web-based portal. A classification model (DAMIP) is then designed to uncover discrimi-natory characteristics that can predict the quality of treatment outcome. We demonstrate system usability by analyzing Type II diabetic patients. DAMIP establishes a classification rule on a training set which results in greater than 80% blind predictive accuracy on an independent set of patients. By including features obtained from structured concept mapping, the predictive accuracy is improved to over 88%. The results facilitate evidence-based treatment and optimization of site performance through best practice dissemination and knowledge transfer.
1 Introduction
Individual health systems provide various services and allocate different resources for patient care. Healthcare resources including professional and staff time are often constrained. Making clinical decisions is a complicated task since it requires physicians to infer information from a given case and determine a best treatment based on their knowledge [1]. Addressing these problems is essential for delivering effective care plans to patients.
Data from electronic medical records (EMRs) can reveal critical variables that impact treatment outcomes and inform allocation of limited time and resources, allowing physicians to practice evidence-based treatment tailored to individual patient
©Springer International Publishing AG 2016
conditions. On a larger scale, realistically modifiable social determinants of health that will improve community health can potentially be discovered and addressed.
Although EMR adoption is spreading across the industry, many providers continue to document clinicalfindings, procedures and outcomes with“free text”natural lan-guage on their EMRs [2]. They have difficulty (manually) mapping concepts to stan-dardized terminologies and struggle with application programs that use structured clinical data. This creates challenges for multi-site comparative effectiveness studies.
Standardized clinical terminologies are essential in facilitating interoperability among EMR systems. They allow seamless sharing and exchange of healthcare information for quality care delivery and coordination among multiple sites. However, the volume and number of available clinical terminologies are large and are expanding. Further, due to the increase in medical knowledge, and the continued development of more advanced computerized medical systems, the use of clinical terminologies has extended beyond diagnostic classification [3]. SNOMED-CT is a multidisciplinary terminology system that is used for clinical decision support, ICU monitoring, indexing medical records, medical research, and disease surveillance [4]. LOINC is a set of universal names for expressing laboratory tests and clinical observations [5]. RxNorm is a normalized naming system for medicines and drugs [6]. The Unified Medical Language System (UMLS) is a terminology integration system developed by the US National Library of Medicine (NLM) to promote the interoperability of systems and mapping between the multitude of available clinical terminologies [7].
Many systems have been developed to map heterogeneous terminologies to support communication and semantic interoperability between healthcare centers. STRIDE mapped RxNorm concepts to the SNOMED-CT hierarchy and used the RxNorm relationships in UMLS to link pharmacy data from two EMR sources in the Stanford University Medical Center [8]. Carlo et al. classified ICD-9 diagnoses from unstruc-tured discharge summaries using mapping tables in UMLS [9]. Patel and Cimino used the existing linkages in UMLS to predict new potential terminological relationships [10]. While many of these studies only focus on one standardized concept, our work herein designs a mapping system that has the ability to accurately map medications, laboratory results, and diagnosis entries from multiple EMRs. Each of the entries is mapped to predefined terms in the SNOMED-CT ontology. Due to the hierarchical nature of SNOMED-CT, similarities between patient diagnoses, laboratory results, and medications can be found more easily. Hence mapped concepts can be generalized to find shared characteristics among patients. Our work thus creates a more powerful system than previous studies, because multiple types of concepts can be mapped and compared in a hierarchical manner.
In this paper, wefirst establish interoperability among EMRs from 737 clinical sites by developing a system that can accurately map free text to concise structured medical concepts. Multiple concepts are mapped, including patient diagnoses, laboratory results, and medications, which allows shared characterization and hierarchical com-parison. We then leverage a mixed integer programming-based classification model (DAMIP) [11] to establish classification rules with relatively small subsets of dis-criminatory features that can be used to predict diabetes treatment outcome. Previous studies in diabetes have identified features such as demographics, obesity, hyperten-sion, and genetics that appear to be linked to the development and progression of type II diabetes [12–14]. However, little is known about how these features interact with treatment characteristics to affect patient outcome.
2 Methods and Design
2.1 Integrating and Mapping of Data to Standardized Clinical Concepts and Terminologies
This study utilized EMR data of 2.7 million patients collected from 737 healthcare facilities. A relational database wasfirst designed with Postgres 9.3 to store these data. Thirteen tables were created containing patient records pertaining to procedures, demographics, diagnosis codes, laboratory measurements and medications. Indexes were developed for each table to enable rapid search and table joins for data querying. The data size for indexes is an additional 11 GB, totaling 27 GB for the entire data-base. We label this the CCI-health database, where CCI stands for Care Coordination Institute.
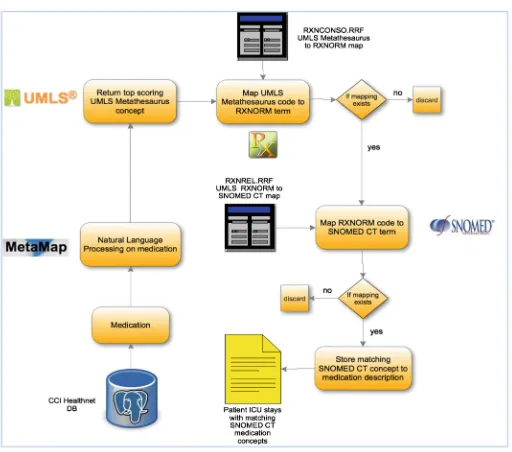
completely differently, relationships could still be found due to rules such as trade-names and ingredients. Figures1 and 2 show the workflows for mapping laboratory and medication phrases to SNOMED-CT concepts.
Fig. 1. The diagram shows the mapping procedure for laboratory phrases to SNOMED-CT concepts.
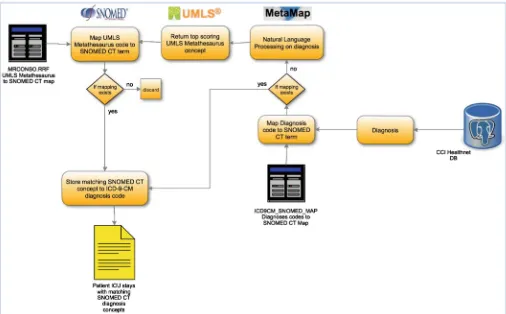
The CCI-health database employs ICD-9 [18] codes for patient diagnoses. This makes the mapping procedure to SNOMED-CT concepts slightly different from those designed for laboratories and medications. The ICD9CM_SNOMED_MAP table in UMLS can be used to map ICD-9 directly to SNOMED-CT concepts. However, this does not include all ICD-9 codes that are associated with patients in the CCI-health database. Metamap was then used to analyze the descriptions of the remaining ICD codes that are not found in the ICD9CM_SNOMED_MAP table. The MRCONSO table was used to map the UMLS concepts returned by Metamap to associated SNOMED-CT concepts (Fig.3).
SNOMED-CT provides a rich hierarchy enabling semantic distances between concepts to be measured by path distances. We developed a Neo4j Graph Database for the CCI-health data to rapidly compute common ancestor queries between the mapped SNOMED CT terms. In our Neo4j Graph Database, tab delimitedfiles of all SNOMED concepts and relationships are exported from SNOMED CT Postgres relational data-base tables. The tab delimited files are then directly loaded into Neo4j community edition 2.0.0 using their batch inserter (http://docs.neo4j.org/chunked/milestone/ batchinsert.html). This results in a SNOMED Graph Database that has many cycles. The cycles greatly impede graph operations such as returning all paths between nodes. Using the Cypher query language, we can quickly identify all cycles with 2 or more nodes. Each cycle can then be removed by deleting an edge based on some criteria involving node depth and in-degree (number of incoming edges to a node).
mapped SNOMED-CT concepts can then be generalized to concepts at a higher depth level. It is important to choose an appropriate depth level to accurately distinguish patient characteristics from one another. For medications and diagnosis, a depth level of 2 is chosen. A depth level of 3 is chosen for laboratories, since assigning lower depth levels returned concepts that are too general. For a given SNOMED-CT concept, Neo4j can quickly calculate all possible paths to the root node. With the Cypher query language, Neo4j returns all nodes for a given depth level that are crossed from all possible paths to the root of the hierarchy. This method was used for all mapped SNOMED-CT concepts, and they can be converted into equivalent nodes at a more general depth level. After conversion, the data was manipulated so that each row contains one patient with a set of yes/no columns for each general SNOMED-CT concept. Some mapped SNOMED-CT concepts are too common and are necessary to remove before analysis. Examples include“Disorder of body system (362965005)”, “Measurement procedure (122869004)”, “Chemical procedure (83762000)”, and “Types of drugs (278471000)”. Upon cleaning, we arrived at the final integrated dataset that includes additional features for predictive analysis.
2.2 Clustering Patients for Multi-site Outcome Analysis
The CCI-health database contains 267,666 diabetic patients. Each patient is charac-terized by 24 features including hospital site, demographics, laboratory tests and results, prescriptions, treatment duration, chronic conditions, blood pressure, number of visits and visit frequencies (Table1). For each patient, treatment duration is determined by calculating the elapsed time between diagnosis (indicated by thefirst prescription of a diabetic medication) and the last recorded activity (i.e. procedure, lab, etc.). These variables are considered potential features that may influence treatment outcome. They are used as input for our classification analysis.
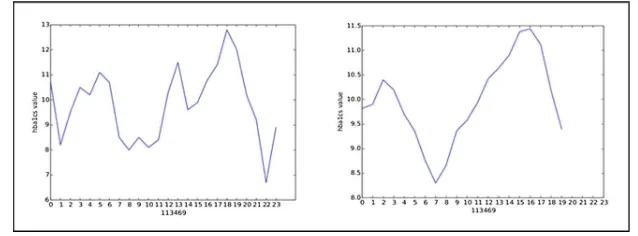
To establish the outcome group status for these diabetic patients, Glycated hemoglobin (HbA1c) lab measurement series throughout the treatment duration were used as indicators of treatment outcome. In our analysis, only patients with 7 or more HbA1c measurements recorded and no missing features were included. This resulted in 3,875 patients. On each patient’s HbA1c measurement series, we performed sliding window with a size offive measurements with equal weights to reduce potential noise. Figure4 shows the comparison of a patient’s HbA1c data before and after sliding window is performed.
linkage (SciPy v0.17.0, scipy.cluster.hierarchy.linkage) was performed. A threshold of 650 and the“distance”criterion were used to form twoflat patient clusters. As a result, 400 patients were clustered into the“Good outcome”group, and the remaining 3,475 patients were clustered in the “medium outcome” group. We characterized the two groups as“good”versus“medium”based on the trend of HbA1c lab measurements of patients in each group.
To establish the classification rule, the 3,875 diabetic-patient dataset were parti-tioned into a training set and an independent set for blind-prediction using stratified
Table 1. Name and description of the 24 features for each diabetic patient. Features used in training
classifiers
Description
Treatment duration Total time elapsed sincefirst prescription of a diabetic medication Visit frequency Number of vitals measurements recorded/treatment duration Diagnoses (6 features) 6 binary variables (true or false) indicating if patient has been
diagnosed with the following conditions: hypertension, hyperlipidemia, cardiovascular disease, stroke, emphysema, asthma
Race Patient race
Gender Patient gender
Age Patient age
Height Patient height measured duringfirst visit Weight Patient weight measured duringfirst visit Provider site Clinical site that patient receives treatment Systolic blood pressures
(5 features)
5 systolic blood pressure measurements sampled equi-distantly throughout measurements over the entire treatment period after sliding average with window size of 5 is applied
Diastolic blood pressure (5 features)
5 diastolic blood pressure measurements sampled equi-distantly throughout measurements over the entire treatment period after sliding average with window size of 5 is applied
random sampling. The training set consisted of 2,325 patients (60% of the population), and the blind prediction set consisted of 1,550 patients (40% of the population). Table2 summarizes the number of patients in each set.
2.3 Optimization-Based Classifier: Discriminant Analysis via Mixed Integer Program (DAMIP)
Suppose we havenentities fromKgroups with mfeatures. LetG ¼ f1;2;. . .;Kgbe the group index set,O ¼ f1;2;. . .;ngbe the entity index set, andF ¼ f1;2;. . .;mg be the feature index set. Also, letOk,k2 GandOk O, be the entity set which belong to groupk. Moreover, let Fj, j2 F, be the domain of feature j, which could be the space of real, integer, or binary values. The i th entity, i2 O, is represented as
yi;xi
ð Þ ¼ ðyi;xi1;. . .;ximÞ2 G F1 Fm, whereyiis the group to which entity ibelongs, andðxi1;. . .;ximÞis the feature vector of entityi. The classification model finds a functionf :ðF1 FmÞ ! G to classify entities into groups based on a selected set of features.
Letpkbe the prior probability of group kandfkð Þx be the conditional probability density function for the entity x2Rm of group k, k2 G. Also let ahk2ð0;1Þ, h;k2 G;h6¼k, be the upperbound for the misclassification percentage that group hentities are misclassified into groupk. DAMIP seeks a partitionfP0;P1;. . .;PKgof RK, wherePk,k2 G, is the region for groupk, andP0is the reserved judgement region with entities for which group assignment are reserved (for potential further exploration).
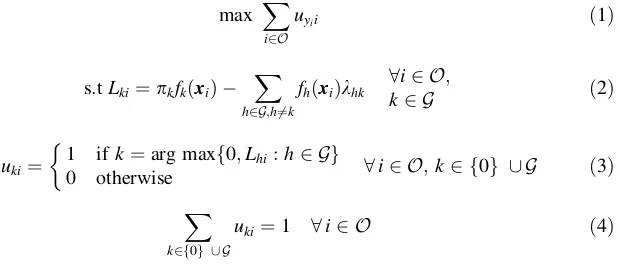
Letuki be the binary variable to denote if entity iis classified to groupk or not. Mathematically, DAMIP [20–22] can be formulated as
max X
Table 2. Partitioning of periodogram-based patient clusters for classification analysis. 10-fold cross validation training set Blind prediction set
Total
X
i:i2Oh
ukibahknhc 8h;k2 G;h6¼k ð5Þ
uki2f0;1g 8i2 O;k2 f0g [ G Lkiunrestricted in sign 8i2 O;k2 G
khk0 8h;k2 G;h6¼k
The objective function (1) maximizes the number of entities classified into the correct group. Constraints (2) and (3) govern the placement of an entity into each of the groups in G or the reserved-judgment region. Thus, the variablesLkiandkhk provide the shape of the partition of the groups in the G space. Constraint (4) ensures that an entity is assigned to exactly one group. Constraint (5) allows the users to preset the desirable misclassification levels, which can be specified as overall errors for each group, pairwise errors, or overall errors for all groups together. With the reserved judgment in place, the mathematical system ensures that a solution that satisfies the preset errors always exists.
Mathematically, we have proven that DAMIP is NP-hard. The model has many appealing characteristics including: (1) the resulting DAMIP-classification rule is strongly universally consistent, given that the Bayes optimal rule for classification is known [20,22]; (2) the misclassification rates using the DAMIP method are consis-tently lower than other classification approaches in both simulated data and real-world data; (3) the classification rules from DAMIP appear to be insensitive to the specifi -cation of prior probabilities, yet capable of reducing misclassification rates when the number of training entities from each group is different; and (4) the DAMIP model generates stable classification rules on imbalance data, regardless of the proportions of training entities from each group. [20–23].
Computationally, DAMIP is the first multiple-group classification model that includes a reserved judgment and the ability to constrain the misclassification rates simultaneously within the model. Further, Constraints (2) serve to transform the attributes from their original space to the group space, serving as dimension reduction. In Brooks and Lee (2010) and Brooks and Lee (2014), we have shown that DAMIP is difficult to solve [22,23]. We applied the hypergraphic structures that Lee, Wei, and Maheshwary (2013) derived to efficiently solve these instances.
The predictive model maximizes the number of correctly classified cases; therefore, it is robust and not skewed by errors committed by observation values. The associated optimal decision variable values ðLkiandkhkÞ form the classification rule, which consists of the discriminatory attributes; examples include demographics, treatment duration, health conditions, laboratory results, medications, etc.
The entities in our model correspond to the diabetic patients with two outcome groups:“Medium outcome”versus “Good outcome”. The goal was to predict which patients have good treatment outcome. Identifying these patient and care characteristics will establish best practice and evidence for providers.
accuracy of each classifier is further assessed by applying the rule to the blind-prediction set. DAMIP returns classifiers that include as few features as possible. To demonstrate the effectiveness of inclusion of standardized clinical terminolo-gies, we utilized the generalized SNOMED-CT concepts obtained from our mapping procedure, which introduced a total of 2,205 additional features including diagnosis, lab, and medication for each patient. Using the same classification approaches, we established new classifiers using these additional features.
We contrasted the DAMIP approach with logistic regression, naïve Bayes, radial basis function networks (RBFNetwork), Bayesian Network, J48 decision tree, and sequential minimal optimization (SMO) approaches that are implemented in Weka 3.6.13. In these Weka classifiers, feature selection was performed using the “InfoGainAttributeEval”as the Attribute Evaluator and“Ranker”as the Search Method to select at most 200 features.
3 Results
3.1 Data Integration and Mapping to Standardized Medical Concepts
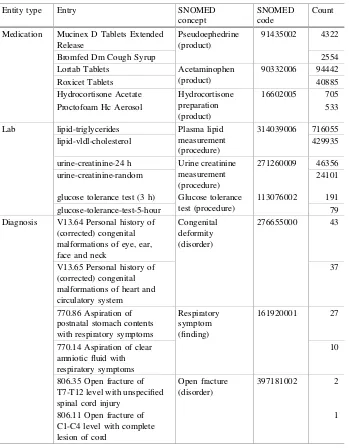
Free text entries from laboratories and medications and ICD9 codes were all success-fully mapped to SNOMED-CT concepts. Of the 803 unique lab phrases in the CCI-health database, 603 can be linked to SNOMED-CT; this covers 1.20 million of 1.33 million patients. Similar successes were found for concept mapping of medications and diagnoses: 5,899 of 9,755 medication phrases were mapped to SNOMED-CT; this covers 801,025 of 952,729 patients. 10,655 of 29,371 ICD-9 codes were linked to SNOMED-CT concepts. Specifically, 2.35 million of 2.46 million patients contain at least one ICD-9 diagnosis code that can be mapped to SNOMED-CT. Table3shows examples of medical entries for medication, laboratories, and diagnoses and their mapped SNOMED concepts. Medication can have many brand names and a range of ingredients. Laboratory procedures and diagnoses may also be described by physicians with a great deal of variation. Table3 shows how variations and ambiguity among phrases are eliminated by our mapping algorithm.
After mapping all the medications, laboratories and diagnoses to standardized medical terms, tens of thousands of new features were created for each patient. Specifically, a total of 17,140 entries for laboratories, medications, and diagnosis codes were mapped to 11,208 SNOMED-CT concepts. For each patient, a feature must be created for each mapped medical concept indicating whether a patient received a medication, was given a diagnosis, or underwent a laboratory procedure. Furthermore, many of these features were closely related. It is thus beneficial to generalize them to reduce the total number of features per patient. In our implementation, these mappedSNOMED-CT concepts were generalized into level 2 nodes for medications and diagnoses and level 3 nodes for laboratories.
3.2 Classification Results on Predicting Treatment Outcome
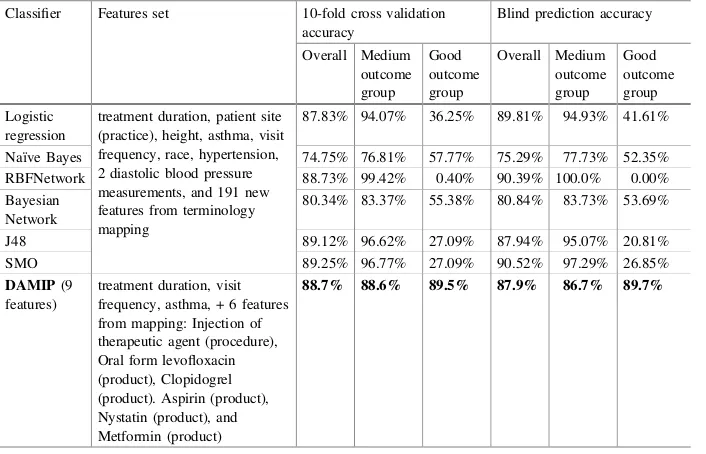
Table4contrasts our in-house DAMIP classification results with six Weka classifiers. Uniformly the six classifiers suffer from group imbalance and tend to place all patients into the larger“Medium outcome”group. In contrast, the DAMIP classifier selects 5 discriminatory features among the 24 and is able to achieve relatively high classification Table 3. Mapping of medication, laboratory, and diagnosis phrases to SNOMED concepts.
Entity type Entry SNOMED
and blind prediction accuracies for both groups. We remark that the commonly used Pap Smear diagnosis test has an accuracy of roughly 70%.
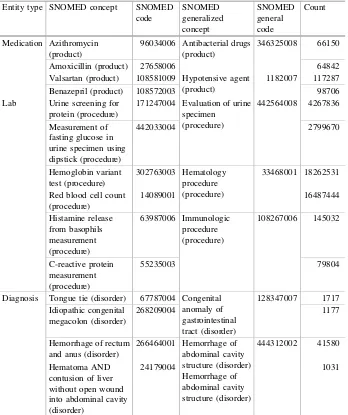
Table5shows classification results after including 2,205 additional features for each patient. With these added features, DAMIP improves its prediction accuracies of the “Good outcome” group while keeping a high accuracy for the “Medium outcome” group. We observe that instead of selecting the“provider site”as one of the discriminatory Table 4. Generalizing mapped concepts of medication, laboratory and diagnosis into SNOMED depth-level mapping.
features, DAMIP selects the type of procedures and medications used instead. Identifying these features facilitates dissemination of best practice and target treatment regime to specific patients among the sites. For the six Weka classifiers, the results improve only slightly on the“Good outcome”group. (Table6).
Table 5. Comparison of DAMIP results against other classification methods. Classifier Features set 10-fold cross validation
accuracy
89.68% 96.87% 30.28% 90.77% 97.14% 30.87%
Naïve Bayes 87.05% 92.77% 39.84% 87.94% 92.72% 42.95%
RBFNetwork 88.22% 98.36% 4.38% 89.03% 97.22% 12.08%
Bayesian Network
87.66% 92.96% 43.82% 87.23% 91.86% 43.62%
J48 89.16% 97.69% 18.73% 90.65% 97.72% 24.16%
SMO 89.16% 99.42% 4.38% 90.77% 99.64 7.38%
DAMIP(5
80.1% 80.6% 75.1% 81.9% 81.9% 81.3%
Table 6. Comparison of prediction accuracies with additional 2,205 medical terminologies obtained from mapping.
Classifier Features set 10-fold cross validation accuracy
87.83% 94.07% 36.25% 89.81% 94.93% 41.61%
Naïve Bayes 74.75% 76.81% 57.77% 75.29% 77.73% 52.35%
RBFNetwork 88.73% 99.42% 0.40% 90.39% 100.0% 0.00%
Bayesian Network
80.34% 83.37% 55.38% 80.84% 83.73% 53.69%
J48 89.12% 96.62% 27.09% 87.94% 95.07% 20.81%
SMO 89.25% 96.77% 27.09% 90.52% 97.29% 26.85%
DAMIP(9
4 Discussion
In this study, we establish interoperability among EMRs from 737 clinical facilities using a mapping process that disambiguates free text entries. The mapping provides a unique way to link to structured medical concepts despite the extreme variations that can occur during clinical diagnosis and documentation. It enables more powerful systems to be developed for future studies where semantic distances can be calculated between patient records due to their association with hierarchical concepts. The graph database allows for rapid data access and queries.
To test the usability of such heterogeneous multi-site data, we develop a DAMIP machine learning model for uncovering patient and practice characteristics that can discriminate “Good outcome”from other outcomes on a group of diabetic patients. Compared to other classification models, the DAMIP model is able to select a small set of discriminatory features to establish good classification rules. Specially, the DAMIP-rules can predict patients with good outcome from those with medium out-come with over 80% blind predictive accuracy. By including medical concepts obtained from terminology mapping, we are able to further improve the predictive capabilities of our model, creating a more powerful evidence-based best practice dis-covery system. The ultimate goal in our study is to establish and identify practice characteristics that result in good outcome and to disseminate this practice among the 737 clinical sites for population health improvement. The features identified, including treatment duration, frequency, co-existing condition, and type of regimens allow for design of“best practice”clinical practice guidelines.
The next step is to use the discriminatory features identified and the criteria developed via the DAMIP-machine learning framework to design and optimize evidence-based treatment plans and to disseminate such knowledge through“rapid learning”across the multiple sites. With these, we seek to increase quality and timeliness of care and maxi-mize outcome and service performance of the healthcare system. We will investigate and contrast our methodologies on other types of diseases. We will also perform predictive health surveillance on the healthy patients (there are 1.8 million healthy individuals in our CCI-health database). Health status will be monitored and rapid analytics will be per-formed based on existing data to identify thefirst sign of health risk. This facilitates proactive patient-centered pre-disease and behavior intervention.
Acknowledgment. This paper receives the 2016 NSF Health Organization Transformation award (second place). The work is partially supported by a grant from the National Science Foundation IIP-1361532. Findings and conclusions in this paper are those of the authors and do not necessarily reflect the views of the National Science Foundation.
References
1. Jensen, P.B., Jensen, L.J., Brunak, S.: Mining electronic health records: towards better research applications and clinical care. Nat. Rev. Genet.13(6), 395–405 (2012)
3. Rosenbloom, S.T., et al.: Interface terminologies: facilitating direct entry of clinical data into electronic health record systems. J. Am. Med. Inform. Assoc.13(3), 277–288 (2006) 4. Donnelly, K.: SNOMED-CT: the advanced terminology and coding system for eHealth.
Stud. Health Technol. Inform.121, 279 (2006)
5. McDonald, C.J., et al.: LOINC, a universal standard for identifying laboratory observations: a 5-year update. Clin. Chem.49(4), 624–633 (2003)
6. Liu, S., et al.: RxNorm: prescription for electronic drug information exchange. IT Prof.7(5), 17–23 (2005)
7. Bodenreider, O.: The unified medical language system (UMLS): integrating biomedical terminology. Nucleic Acids Res.32(suppl 1), D267–D270 (2004)
8. Hernandez, P., et al.: Automated mapping of pharmacy orders from two electronic health record systems to RxNorm within the STRIDE clinical data warehouse. American Medical Informatics Association (2009)
9. Carlo, L., Chase, H.S., Weng, C.: Aligning structured and unstructured medical problems using umls. American Medical Informatics Association (2010)
10. Patel, C.O., Cimino, J.J.: Using semantic and structural properties of the unified medical language system to discover potential terminological relationships. J. Am. Med. Inform. Assoc.16(3), 346–353%@ 1067–5027 (2009)
11. Gallagher, R.J., Lee, E.K.: Mixed integer programming optimization models for brachyther-apy treatment planning. In: Proceedings of the AMIA Annual Fall Symposium. American Medical Informatics Association (1997)
12. Haffner, S.M.: Epidemiology of type 2 diabetes: risk factors. Diab. Care 21(Suppl. 3), C3–C6 (1998)
13. Chan, J.M., et al.: Obesity, fat distribution, and weight gain as risk factors for clinical diabetes in men. Diab. Care17(9), 961–969 (1994)
14. Estacio, R.O., et al.: Effect of blood pressure control on diabetic microvascular complications in patients with hypertension and type 2 diabetes. Diab. Care23, B54 (2000) 15. Aronson, A.R.: Effective mapping of biomedical text to the UMLS Metathesaurus: the MetaMap program. In: Proceedings of the AMIA Symposium. American Medical Informatics Association (2001)
16. Aronson, A.R.: Metamap: Mapping Text to the UMLS Metathesaurus. NLM, NIH, DHHS, Bethesda, pp. 1–26 (2006)
17. Aronson, A.R., Lang, F.-M.: An overview of MetaMap: historical perspective and recent advances. J. Am. Med. Inform. Assoc.17(3), 229–236 (2010)
18. National Center for Health Statistics (U.S.). ICD-9-CM: The International Classification of Diseases, 9th Revision, Clinical Modification. 1978: Commission on Professional and Hospital Activities
19. Caiado, J., Crato, N., Peña, D.: Comparison of times series with unequal length in the frequency domain. Commun. Stat. Simul. Comput.®38(3), 527–540 (2009)
20. Lee, E.K.: Large-scale optimization-based classification models in medicine and biology. Ann. Biomed. Eng.35(6), 1095–1109 (2007)
21. Lee, E.K., et al.: A clinical decision tool for predicting patient care characteristics: patients returning within 72 hours in the emergency department. In: AMIA Annual Symposium Proceedings. American Medical Informatics Association (2012)
22. Brooks, J.P., Lee, E.K.: Solving a multigroup mixed-integer programming-based constrained discrimination model. INFORMS J. Comput.26(3), 567–585 (2014)
with Uncertainties and Multiple Objectives
Markus Hartikainen1(&), Kyle Eyvindson2, Kaisa Miettinen1, and Annika Kangas3
1 Faculty of Information Technology, University of Jyvaskyla, P.O. Box 35, 40014 University of Jyvaskyla, Finland {markus.hartikainen,kaisa.miettinen}@jyu.fi
2
Department of Biological and Environmental Science,
University of Jyvaskyla, P.O. Box 35, 40014 University of Jyvaskyla, Finland [email protected]
3
Natural Resources Institute Finland (Luke),
Economics and Society Unit, Yliopistokatu 6, 80101 Joensuu, Finland [email protected]
Abstract. In this paper, we present an approach of employing multiobjective optimization to support decision making in forest management planning. The planning is based on data representing so-called stands, each consisting of homogeneous parts of the forest, and simulations of how the trees grow in the stands under different treatment options. Forest planning concerns future deci-sions to be made that include uncertainty. We employ as objective functions both the expected values of incomes and biodiversity as well as the value at risk for both of these objectives. In addition, we minimize the risk level for both the income value and the biodiversity value. There is a tradeoff between the expected value and the value at risk, as well as between the value at risk of the two objectives of interest and, thus, decision support is needed tofind the best balance between the conflicting objectives. We employ an interactive method where a decision maker iteratively provides preference information to find the most preferred management plan and at the same time learns about the inter-dependencies of the objectives.
Keywords: Forest management planning
Multiobjective optimizationInteractive multiobjective optimization
Pareto optimalityUncertainty1 Introduction
In forest management, a forest area is typically divided to decision units, so-called stands, which are relatively homogeneous with respect to the age structure and the species composition of trees. Forest management planning means selecting optimal harvest schedules including one or more treatment option(s) and their timing for each of these stands. The treatment options may include harvesting all the trees (final felling) or a part of them (thinning) within any stand, and planting new seedlings and tending them after a harvest has been carried out. The timing of the treatment options in the
©Springer International Publishing AG 2016
schedules is described by dividing the planning horizon to several planning periods of one or more years.
For most decision makers, forest management planning is a multiobjective decision making problem. Harvesting implies incomes from forests but, on the other hand, it diminishes the recreational and esthetical values of the forest, and it may have adverse effects on the natural values of the forest area, for instance, the biodiversity within the area and the viability of wildlife populations living in the area.
Importantly, forest management planning involves a lot of uncertainty as it is not possible to measure all trees within a forest area. This means that there is uncertainty concerning the current state of the forests. Furthermore, measuring biodiversity is prohibitively expensive, so using proxy variables (biodiversity indices) is the only possibility. Finally, all forest decisions concern the future (typically the next 5–20 years), so that the state of the forest stands and the biodiversity as well as the conse-quences of the treatment options need to be predicted using statistical models. As we do not know the exact consequences of the management decisions, the decisions involve uncertainty which the decision makers may wish to manage.
In this paper, we present an application that accounts for the conflicting objectives in forestry (incomes and biodiversity) and manage the risk involved in them using the value at risk (often denoted by VaR) concept. We apply an interactive multiobjective optimization method to find the most preferred treatment option for each stand considered.
2 Background and Related Work
Selecting the optimal treatment schedule for each stand is a combinatorial optimization problem, where the size of the problem depends on the number of separate stands and the number of possible treatment schedules for them. Linear programming has been widely used to solve this problem since the 1960s (Kangas et al.2015). Most appli-cations have multiple objectives, and have typically been solved using thee-constraint
method (Miettinen1999). Heuristic optimization has also been used since the 1990s. Within a heuristic framework, multiobjective optimization has typically been based on a weighted (additive) utility function. The main reason for not utilizing multiobjective optimization more has been the lack of computational tools to do so.
Multiobjective optimization problems can in general be formulated as
maxff1ðxÞ;. . .;fkðxÞg
s:t gjðxÞ 0 for allj¼1;. . .;J hkðxÞ ¼0 for all k¼1;. . .;K aixibi for alli¼1;. . .;n x¼ ðxi;xrÞ; where xi2Za; xi2Rn z:
integer-valued variables xi and real-valued variables xr. All the constraints form a feasible set Q which is a subset of the decision space. The image of Q mapped with the objective functions is called the feasible objective set f(Q) and elements of it are so-called objective vectorsz.
In multiobjective optimization, there typically does not exist a single optimal solution but, instead, there exist multiple so-called Pareto optimal solutions, where none of the objective functions can be improved without impairing at least one of the others. For this reason, one needs additional preference information to decide which of the Pareto optimal solutions is the best one. The person giving this information is called a decision maker (DM).
One way of giving preferences is providing aspiration levels, which are values of objective functions that should desirably be achieved, and they constitute a reference point zref 2Rk. Aspiration levels are employed in so-called achievement scalarizing functions (Wierzbicki1986). The main idea behind achievement scalarizing functions is that they measure the preferability of a solution given a reference point in a way that is theoretically justifiable. This is defined as order-consistency by Wierzbicki (1986). There exist many achievement scalarizing functions following the characterization of Wierzbicki (1986). In this paper, we use the following achievement scalarizing function to be maximized
sasf :fðQÞ Rk!R;
ðz;zrefÞ 7!mini¼1;...;kðzi zrefi Þ=ðz ideal
i z
nadir i Þ
þqXki
¼1zi=ðz ideal
i z
nadir i Þ:
In the above problem, zis a so-called objective vector in the image space of the feasible set,zidealis the ideal vector of the problem containing the maximum values of the individual objectives andznadiris the nadir vector containing the minimum values of the individual objectives within the set of Pareto optimal solutions (see e.g. Miettinen,
1999). The summation term at the end is called an augmentation term and the constant qis a small positive constant, e.g. 0.0001. The augmentation term guarantees that the solutions are indeed Pareto optimal.
Employing the achievement scalarizing function means solving the optimization problem
maxx2QsasfðfðxÞ;zrefÞ
for any reference point zref given by the DM. Given a reference point, the optimal solution of the above problem is a Pareto optimal solution to the original multiobjective optimization problem (Wierzbicki 1986). The variant of the reference point method (Wierzbicki1986) employed utilizes the achievement scalarizing function.
papers (Eyvindson and Kangas 2016a, Eyvindson and Chen 2016). The latter employed conditional value at risk (Rockafeller and Uryasev 2000). Applications utilizing value at risk (Duffie and Pan 1997) have not yet been published in forest management planning. To our knowledge, applications including two or more different value at risk concepts have not been published in anyfield. However, in forest plan-ning, it is quite possible that the DM is willing to accept high risks for poor incomes but only a low risk for losing biodiversity or vice versa. The main reason why the uncertainties have been ignored so far is that the problem including uncertainties requires quite heavy calculations, which can be regarded too demanding for large areas with a lot of stands.
In interactive multiobjective optimization methods (e.g. Miettinen1999, Miettinen et al.2008), thefinal Pareto optimal solution, to be called the most preferred solution, is identified by iterating the steps of re-defining the preferences and producing a solution fulfilling these preferences as well as possible, until the DM is satisfied. The idea is that in this way the DM learns about what kind of preferences are attainable and what kind of solutions are achievable. As mentioned, the preferences can be expressed, for instance by giving aspiration levels. Even though the benefits of interactive methods have been acknowledged in the forest management planningfield (Pykäläinen2000), only a few applications have been published.
3 Multiobjective Optimization of Forest Inventory
One complication in forest management planning is that most decisions concern the future. Even when a decision is implemented immediately, the consequences of the actions in the future need to be predicted. This prediction is carried out using a forest growth simulator.
In the Finnish forestry, there are three different operational simulators that are used by all organizations making forest planning. In this study, we used the SIMO simulator, which includes more than 400 equations to predict, e.g., the diameter growth and the height growth of each tree, and the probability that a tree dies in the next years. The simulator also predicts the total volume of timber available from a harvest carried out at a specific time, and the income based on the harvested volume. Forest growth can be predicted fairly accurately for the next 1–5 years, but as the time period becomes longer, the uncertainties grow.
The stochasticity involved can be dealt with by using a set of scenarios. Parametric distributions are utilized to describe the uncertainty in any one of the input variables of a system, and a parametric distribution can also be used to describe the uncertainty in the simulated growth. The variables of interest, like incomes from harvests, are a result of several input variables and statistical models, and therefore describing the uncer-tainty is easiest to carry out with a set of scenarios, each of them essentially describing one possible future development of the forest area. Then, the whole set of scenarios describes the uncertainty in the variables of interest. Using a set of scenarios also enables describing the stochastic optimization problem involving uncertainties in a way where linear optimization can be used (a so-called deterministic equivalent of the stochastic problem).
It is possible to evaluate the quality of the set of scenarios used to describe the stochastic problem, through the use of evaluation techniques. The so-called Sample Average Approximation (SAA, Kleywegt et al.2001) method compares the solution generated by a smaller number of scenarios to the solution generated by a much larger number of scenarios. This is iterated several times to generate confidence intervals of the gap in optimality and expected objective value of the solution. One application of this method has been realized in forestry, and the number of scenarios required to effectively represent the uncertainty depended on the quantity of uncertainty and risk preferences of the DM (Eyvindson and Kangas2016b).
4 Modelling Forest Management as a Multiobjective Mixed
Integer Linear Problem
We assume that we have S stands, T treatment schedules for each stand, R scenarios and P periods of time to consider. We have simulated valuesIt;s;r;p for the income and Bt;s;r;pfor the biodiversity with indices denoting
• treatment schedulest(including one or more timed treatments), • standss,
• scenarios of future development of the forest standr • and 5-year periodsp.
The problem of choosing the best treatment schedules for all the stands can be formulated as a multiobjective optimization problem
max min
1. Minimum income in the scenarios that are in the set of scenariosRI (in euros). This objective will be denoted byVaRIin what follows. According to thefirst constraint, the setRI is a subset of the complete set of scenariosRand the number of scenarios in this subset is greater or equal todItimes the number of scenarios in the complete set of scenarios. This means that this is the income at risk for the risk level 1 dI. 2. Minimum biodiversity index in the scenarios that are in the set of scenariosRB. This objective will be denoted by VaRB. Being an index, this variable is unitless, and only the relative differences can be interpreted. According to the second constraint, the setRBis a subset of the complete set of scenariosRand the number of scenarios in this subset is greater or equal todBtimes the number of scenarios in the complete set of scenarios. This means that this is the biodiversity at risk for the risk level 1 dB.
3. Expected minimum income across the periods p in the complete set of scenarios R(in euros). This objective will be denoted byEI.
4. Expected minimum biodiversity index across the periods in the complete set of scenariosR. This objective will be denoted byEB.
5. ProbabilitydI of the setRI. The risk level for the value at risk for the income is, thus, 1 dI.
6. ProbabilitydBof the setRB. The risk level for the value at risk for the biodiversity is, thus, 1 dB.
Traditionally in forestry, the variation of income over periods has been handled by seeking a so-called even-flow solution. In an even-flow solution, the income is equal over all periods. With biodiversity, stability is even more important. We, however, maximize the minimum income and biodiversity over periods, instead of seeking the even-flow solution. The solution that maximizes the minimum income or biodiversity over the periods is sometimes the even-flow solution, if all the periodic incomes are the same as the minimum income, or it is better than the best available even-flow solution, if the income or the biodiversity in one of the periods is higher than the minimum income or biodiversity. For this reason, we believe that it makes more sense to max-imize the minimum over the periods than to seek for the even-flow solution.
Our decision variables in the problem formulated are both the setsRI andRB and the treatment decisionsxt;s for all treatment schedules t and stands s. The treatment decision xt;s is one, if the treatment schedule is chosen for the stand s and 0 if not. Because only one treatment schedule can be chosen for each stand, the third constraint allows only one of thext;s values to be one, and the others must be zero for all the stands.
In order to solve the optimization problem efficiently, it can be converted into a mixed integer linear problem (MILP). Once we can re-formulate the problem as a MILP, we can use the efficient MILP solvers available e.g., IBM ILOG CPLEX Optimization Studio (see e.g., http://www-01.ibm.com/support/knowledgecenter/