The Effect of Marine Fish
Biomass Stock Reduction to Fishers Revenue
(A Case Study of Sardinella Lemuru Fisheries
on Bali Strait)
Ratna Purwaningsih1, Sjarief Widjaja2, and Sri Gunani Partiwi3
AbstractStock assessment studies indicate that Sardinela Lemuru fisheries of Bali strait have been overfishing. This research attempts to (1) Identify the effect of biomass stock reduction to fishers revenue per trip, (2) Analyze the economic feasibility study for purse seine of Muncar, Banyuwangi. System Dynamic approach is used for simulation modeling. Simulation output shows a strong correlation between fish stock reduction and fisher revenue. The growth of fishing effort per year results on the reduction of catch per unit effort and total catch per year. Feasibility study concludes that purse seine (30 GT) which operates 120 trips per year is no longer a profitable business since 2020.
Keywordsfish biomass stock, fishers revenue, simulation, system dynamic, Purse Seine feasibility study
AbstrakBerbagai kajian stok mengindikasikan bahwa perikanan Sardinella Lemuru selat Bali saat ini telah mengalami lebih tangkap. Penelitian ini bertujuan untuk (1) Mengidentifikasi pengaruh penurunan stok ikan lemuru terhadap pendapatan nelayan (2) Melakukan analisa terhadap studi kelayakan usaha penangkapan ikan dengan purse seine di wilayah Muncar, Banyuwangi. Pemodelan dan simulasi dikembangkan dengan pendekatan sistem dinamik. Hasil simulasi menunjukkan bahwa terdapat korelasi yang kuat antara penurunan stok ikan dengan pendapatan nelayan. Pertumbuhan alat tangkap per tahun mengakibatkan penurunan jumlah tangkapan per unit alat tangkap dan total hasil tangkapan per tahunnya. Studi kelayakan usaha menyimpulkan bahwa purse seine (30 GT) yang beroperasi 120 trip per tahun tidak akan memberikan keuntungan usaha pada tahun 2020.
Kata Kuncibiomass stok ikan, pendapatan nelayan, simulasi, sistem dinamik, studi kelayakan usaha purse seine
I.INTRODUCTION8910
isheries contribute to human welfare by generating income for millions people and providing essential dietary requirements for more than a billion people, particularly in developing countries [1]. The FAO Code of Conduct for Responsible Fisheries states that conservation and management decisions for fisheries should be based on the best scientific evidence available, also taking into account traditional knowledge of the resources and their habitat, as well as relevant environmental, economic and social factors [2]. Studies show that most of Indonesia's capture fisheries are either full or over-exploited [3]. This condition caused by over investment in marine capture fisheries.
The fishery for Lemuru (Sardinella longiceps) on Bali strait is one of the main small pelagic fisheries in Indonesia. Bali Strait is an area of 2,500 km2 located between Bali and East Java Province, it is funnel-shaped and shallow in the northern part while deeper in the Southern part. Fishing has been largely conducted by fishers from Pengambengan in Bali Province and Muncar in East Java Province. The fish catch is landed at Pengambengan fish landing site and Muncar coastal
8
Ratna Purwaningsih is a with in Department of Marine Technology, FTK, Institut Teknologi Sepuluh Nopember, Surabaya, 60111, Indonesia. E-mail:ratna.ti2005@yahoo.com.
Sjarief Widjaja is with Department of Naval Architecture and Ship Building, FTK, Institut Teknologi Sepuluh Nopember, Surabaya, 60111, Indonesia. E-mail: sjarief.widjaja@yahoo.co.uk.
Sri Gunani Partiwi is with Department of Industrial Engineering, FTI, Institut Teknologi Sepuluh Nopember, Surabaya, 60111, Indonesia. E-mail: srigunani@ie.its.ac.id
fisheries port in Banyuwangi district. About 60%-80% of fish production in Muncar is Lemuru [4].
The dynamic nature of small pelagic resources such as Lemuru has resulted in the fluctuation of catch.The numbers of fishing effort also influence to total catch and fish biomass stock. In the early years before the introduction of purse seine in 1974, fisher on Bali strait used traditional fishing gears such as danish seine (locally call d “payang oras”), scoop n t, gilln t (locally call d “jaring d r”), lift n t and cast n t. The introduction of purse seine in 1974 by owners of canning factories in Muncar caused protests by traditional fishermen and even led to riots, and as a result, seven purse seines out of ten were burnt by fisher [5]. These riots led to the local government decision to provide credit to fishermen to buy purse seines and in the early phase 50 fishermen received credit. Because of the successful catch of purse seines, the new technology was finally adopted by fishermen and in the following year, 1975, fishermen from Bali side also started employing purse seine [6]. The rapid increase of purse seine has increased total catch of Lemuru.
Fish is renewable natural resources. Fish stock should be maintained by applying restrictive regulation on fish exploitation. The amount of total fish catch must be not more than its Maximum Sustainability Yield (MSY). The Directorate General of Fisheries of both Bali province and East Java province in 1992 met and declared a joint agreement. The fisheries regulation on this joint agreement is limitation on fishing effort by limiting the number of fishing boats in two provinces, namely 190 units of East Java and 83 units in Bali; and the size of fishing vessel, which should never exceed 30 GT. The
Provincial Fisheries Services of East Java and Bali and DGF have combined their efforts in strengthening management of the lemuru fisheries. One of the priorities is to discourage the processing industry to build fishing boats by not issuing new fishing lisence.
Although Lemuru fishery in Bali straits have been managed well by applying regulation on limitation of purse seine, the stock assessment study of Lemuru still shows reduction on biomass stock. Total fish landed at a fishery port depends on fish biomass stock and the numbers of fishing effort used to catch in certain fishing ground. The decreasing on biomass stock of Lemuru will reduce marine capture fish production and fishers revenue.
This research attempts to develop a simulation model to analyze the effect of biomass fish reduction to purse seine fisher revenue. The simulation run using system dynamic modelling using Powersim software. Economic analysis to purse seine tries to decide whether it is a profitable business or not.
II.METHOD
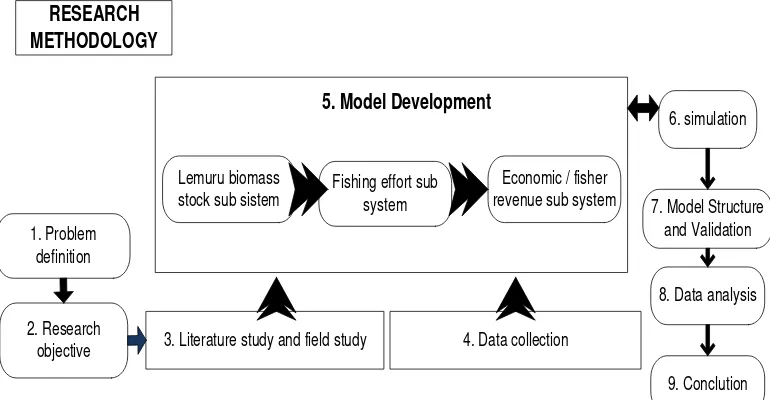
The model is developed using system dynamic approach, the method is shown on Figure 1. Model consists of three sub systems : fish stock, fishing effort, and purse seine economic. The methods of systems thinking provide us with tools for better understanding of difficult management problems.
System dinamyc have been used for over thirty years and are now well established. System dynamic uses system thinking in its Causal Loop Diagram (CLD) represents interelation among variables involved [7]. The CLD diagram of this model is shown in Figure 2.
The data was collected on September – October 2009 and June 2010. The historical data were obtained from Muncar coastal fishing port annual report and research report of [8] and [5]. The primary data are collected through field study at Muncar fishery port such as interview with 20 fishers, 5 purse seine owners, and official of directorate general of fisheries Banyuwangi district.
The validation only on the construction of model logic which based on theory (mathematical formulation) and do not do a validation on output data. It is hard to avoid the fact that Illegal, Unreported and Unregulated (IUU) fishing happened in this fishing port caused the differencess between total catch count by model and total catch reported by Muncar fishing port annual report [9-10]. The catch reported by fishers to fishing port official estimated only a half to one per three from all catch they get [5].
Marine capture fisheries is one of the renewable natural resources in which the level of exploitation determines the sustainability of the resources. The level of exploitation is measured by the value of total catch per year in certain fishing area management. More investment in fishing effort can be seen as increasing the number of fishing boat. The growth of fishing effort will lead to the growth of total catch value until it reaches maximum exploitation boundaries. Beyond that point, the total catch will decrease. It indicates that the fish biomass stock have been depleted.
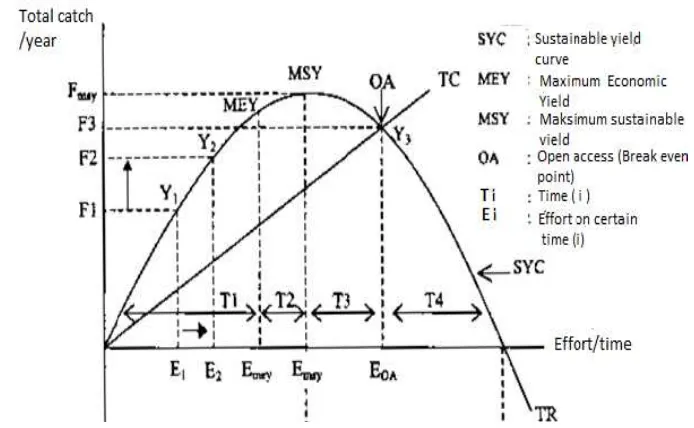
There are three approach on manage fisheries by limiting fishing effort, MSY, MEY and OA [11]. First,
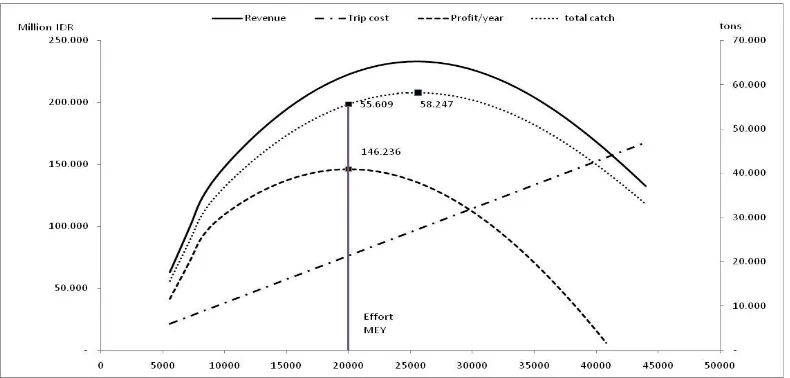
Maximum Sustainable yield or MSY. This is the parameter to determine maximum exploitation point. MSY is an ecology indicator in marine capture fisheries management, exploited under this point will maintain the biomass fish stock remain in certain level. Figure 3 gives us an illustration that the fishing effort level determines the total catch and Total Revenue ( TR ). But MSY does not give optimum economic rent. Second, Maximum Economic Yield or MEY. Exploited on MEY level will give maximum profit. The third approach is Open Access (OA) or Maximum Social Yield (MscY). Open Access gives maximum number of fishing effort or number fishers to be involved in this activity without breaking the sustainable level of biomass stock. As consequency, there will be less revenue (total catch x price per kilogram fish) gained by fishers. Besides of providing job for coast community, it is a suitable policy approach.
Marine capture fisheries must be evaluated as a business unit because it has a huge initial investment value and operating cost. The revenue can be estimated by predicting the total catch of fresh fish per year in ton. In the case of overfishing, the fishing effort lies on the right side of the curve over the open access point. There will be a depletion on fish biomass stock and any recovering regulation is needed to increase biomass stock. Actually, it is done by fishing restriction on a certain species or certain fishing area, limitation on net size, and the number of fishing boat being operated. A spesific role on a boat size and machine specification are also important to increase fish biomass stock.
The overfishing is a global issue recent day, many countries indicate a depletion on their biomass stock assessment report, also world fish stock in 2008 [12].
The size of fish biomass stock B(t) is influenced by its natural growth rate and total fish catched from exploitation activity. Natural growth rate depends on value of growth rate coefficient (r). Biomass stock can grow from stock (x) to reach its maximum value according to value of environment support factor which is presented as (K) value. K describes the maximum biomass stock value if there is no exploitation. Fish biomass stock natural growth rate in unexploited condition is described in formulation below [19].
(1) In condition fish have been exploited, total catch [h(t)] depends on biomass stock B(t), fishing effort (E) and catchability coefficient (q), described below :
(2) Thus, the dynamic of biomass stock according to the level of exploitation will be calculated using the formulation below.
(3)
In equilibrium, F (Bt) = h (t), thus dB(t)/dt = 0, the formulation will be below
(4)
biomass stock is still maintained in certain level. This condition needs tight restriction on fishing effort by limiting the numbers of fishing boat and trip per year. In fact, the numbers of fishing boat grow per year although the government already made a regulation on it.
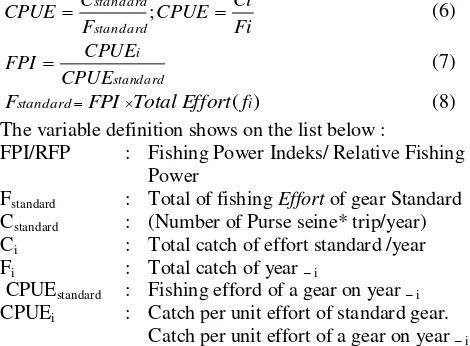
Indonesian marine fisheries are characterized by multi gears. There are four gears operated in Lemuru fisheries Bali strait: purse seine, payang, gill net, and bagan. Fisheries management models must assume that multi gears are transferred in to one standard unit gear [24]. Purse seine is a dominant gear in Lemuru fisheries because it catches almost 70 % of Lemuru production. Other gears must be transformed to purse seine standard by calculating their Catch Per Unit Effort (CPUE) and standard FPI TotalEffort f
F (8)
The variable definition shows on the list below : FPI/RFP
Fishing Power Indeks/ Relative Fishing Power
Total of fishing Effort of gear Standard (Number of Purse seine* trip/year) Total catch of effort standard /year Total catch of year – i
Fishing efford of a gear on year – i
Catch per unit effort of standard gear. Catch per unit effort of a gear on year – i
III.RESULTS AND DISCUSSION
Fish production on Muncar coastal fishery port consists of Lemuru and other fish species. According to the annual report of Muncar fisheries port from 2000 to 2009, Lemuru dominated the Muncar fish production. Lemuru production has a seasonal fluctuation. High catches were obtained during the months of the nortwest monsoon from November to January [14].
The average number of fish production per year for Lemuru is 23,899,180 kg and for other fish (by catch) is 6,805,637 kg. The average percentage of Lemuru production is 71 % of total fish landed which is decsribed on Table 1. Data of gears which is operated on Bali strait fishing area and its trip per year are provide on Table 3. It can be seen that this is a multi gears and multi species of fisheries.
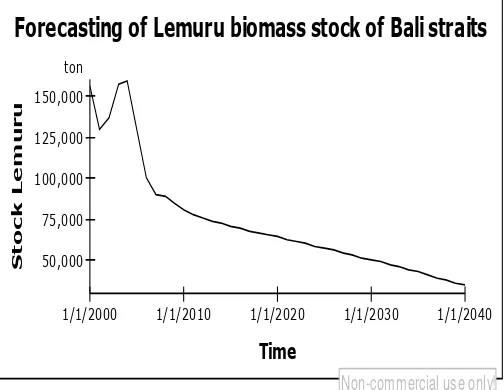
Simulation is running after inputing intial value for some variabel of sub system fish stock and sub system fishing effort described on Table 2. The value of fish biomass stock is 155.995 ton on the year 2000. Table 3 shows that the number of fishing vessel grew per year (based on historical data from 2000 to 2009) from the starting point 180 units on 2009. Fishing vessel number grew slowly and fraction result need to be changed to
int g r valu . Ov r inv stm nt had occur d h r that’s
why the purse seine standard grew slowly and reduced. Fast grow of purse seine occured between the period of 1980 -1990 [15].
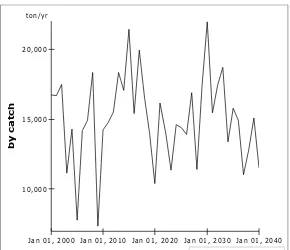
Total production of by catch is forecasted by the normal distribution data and used the statistic parameter to randomly generate the value. The output of arena software used to identify the type of data distribution and its parameter. By catch production is a normal distribution with mean value 6.990 and standard deviation 1.790 .
The profit of a purse seine is determined by its revenue and cost. Investment cost are changed to annual cost by dividing it with life time of the vessel (20 years) and machine (5 years) without salvage value. There are two
boats op rat d tog th r p r trip (call d ‘tand m mod ’),
one boat to catch the fish used purse seine net and other to load fish catch and store it until landed, covered by ice flack to reduce fish damage. The detail of initial investment is shown on Table 4, it is calculated without considering bank interest, salvage value and depreciation. The operational cost is Rp 3,810,000.00/ trip and then times by 120 trip per year. It is the wage for crew and fuel consumption. Another significant cost is boat, machine and purse seine net maintenance cost, it is estimated Rp 49 million. Boat maintenance is twice per year cost Rp 20 million, net maintenance is Rp 1,5 million per month (Rp 18 million per year) and another equipment maintenance cost is Rp 11 million. The simulation ouput parameter shows on Table 5.
Table 5 shows simulation output of fish biomass stock, natural growth, Bali strait lemuru production, Muncar lemuru Production, and annual profit of purse seine.
Total catch or fish production is a function of biomass stock and effort. Production catch means total of lemuru catch from Bali strait fishing area, landed at Pengambengan, Muncar and other landing site around Banyuwangi coast. Table 5 shows that the lemuru production or total catch per year is above the natural
gro th. That’s hy th biomass stock com to collaps .
Figure 5 shows the graphic of lemuru production or total catch per year of Bali strait. Graphic shows a linear declining of production. It is linear to the declining of biomass stock on Figure 4.
the size of fishing vessel should never exceed 30 GT [14], [16].
Figure 7 shows the purse seine profit per year. It shows a declining profit curve linear to declining of biomass stock of lemuru. Revenue of purse seine consist of lemuru production and non lemuru (by catch). The price of lemuru is Rp.4000, 00/kg and price of other fish or by catch assumed Rp. 8.000,00/kg.
Table 5 shows that on 2020 profit per trip still in positive value about 1.8 million rupiah, but it do sn’t mean that purse seine is still a profitable business after 2020. Purse seine boats operation will give loss about 22 million per year after considering the initial investment cost. The decline of lemuru biomass stock will reduce the catch per unit effort and then decline the fishers revenue. Annual profit fluctuation on Figure 7 caused by fluctuation of by catch production which still on stable value. Figure 8 describe the by catch production.
The biomass fish stock reduces rapidly because there are too many fishing boats operated per year. Total catch of lemuru already passed the MSY (Maximum Sustainable Yield) level. The maximum effort per year which quarantees the sustainable marine capture fisheries for sardinella lemuru in Bali strait is 25.600 trip in purse seine standard and result on total catch 58.247 ton/year. If there are 160 boats, trips per year should be 160 trip/year per boat. But this is not an ideal condition because MSY does not give maximum profit for fishers like MEY does. MEY gives the maximum effort barrier on 20,000 trip per year, equal to 160 boats operate 125 trips per year, and gives the total catch 55,609 ton per year. It is clearly illustrated on Figure 9 .
Demand on fresh fish as raw material for fish processing industries around Muncar fishery port gives pressure to the increasing number of fishing effort. Some fish processing industries give loan to boat owners to buy a new purse seine and ask them to sell their catch to certain buyer.
Natural factors such as El Nino which bring up welling and provide more flankton for feeding fish is not considering in this biomass stock model. It is the lackness of this model. The natural factors will make a stock curve unlinear, stock will increase periodically. This simulation model is built by assuming that the biomass stock level only is determined by its natural growth (r coefficient) and its mortality level which called ‘total catch’ or total L muru production. It can b s n from Figure 3 that the rapid reduction of biomass stock occured linear to time. In real condition, there are many natural factors influence the fish biomass stock, for example the level of salinity, temperature, waves, lighting etc.
The most significant natural factor is El Nino because it causes up welling and bring the fish more planton. Major El Niño events occurred in 1891, 1911, 1917, 1925, 1930, 1941, 1957, 1965,1972, 1976, 1982, 1986, 1992 and 1997 [6]. Last El nino occured in 2007. During that years, the Lemuru fish production is 90 % more than the fishery port total fish production.
In the period of El Nino, purse seine boat owner can cover all investment cost from the revenue they get in one year. In this period, fishing activity did almost everyday. The only break time is for boat, machine and net maintenance. It could be more than 250 trips per boat
during that year. But, the El Nino phenomena does not include in this model. The profit of purse seine fishing boat described on Figure 3 shows a rapid decline and should be in big losses per year. In reality, El Nino always gives the ship owner investation and a lot of profit. It is still a profitable business since El Nino occurs frekuenly.
The result of model simulation shows linear relationship between biomass fish stock of Sardinella Lemuru and fishers (purse seine fishing boat owner). Although the by catch fish involve in the model and the price of by catch (non lemuru fish) assumed to be Rp 8000/kg and price of lemuru Rp 4000/kg, the reduction on biomass stock of Lemuru still gives significant effect to fishers revenue. The dominance of lemuru fisheries in Bali strait is a uniqueness that can not be found in other fishing area in Indonesia.
The El Nino phenomena which almost regularly occure in Bali strait is not involved in the model. Model assumed that natural growth of biomass stock going on normal condition. This is the weakness of this model. Other assumption which became the weakness of the model are assumed trip per year as a constant variable. In fact, trip per year is fluctuated.
What happen to Lemuru fishery in Bali strait similar to what happen in Herring fishery in Atlantic sea. The story of herring is entwined in the history of commercial fishing. For over two millennia, Herring has been commercially caught and its importance to the coastal peoples of Britain cannot be measured [17]. The north sea and west of Scotland Herring stock have experienced exessive fisheries in the past leading to collapse. The North sea stock decline in the late 1960s and early 1970 leading to a closure. Following a diversion of the fishing fleet after the closure in the North Sea the west Coast stock collapsed in the late 70s [18]. Fortunately, the fishers and the industries found Mackarel fish to replace Herring fish as raw material for canning fish processing industries on Scotland. Recent days, Herring stock is already recover.
Recently, decreasing on fish stock happened in many oceans and became a global issue [19]. Unsustainable development practices on marine capture fisheries for years result on ecological damage. Fisheries management should apply the concept of sustainable development. WCED defines sustainable development as development that does not compromise ability of future generation to meet their own need [20]. There are four aspects in sustainable development: economic,
ecology community and instituti [21]. Also,
Kusumastanto said that fisheries is a complex system, consist of ecology, economy, technology, and social aspects [22]. Fisheries should be manage as a system. System dynamic is a suitable method to learn the fishery system after applied a regulation.
catch. It means more money invested to improve fish capturing technology and more boats operated will not give more profit to the fishers. This is happen on case of overfishing. It is a condition when fish stock decreasing because total fish catch per year above the maximum sustainable yield (MSY) [11]. Decreasing on total fish catch or fish production will bring fish processing industries to lack of raw material.
Sardinella lemuru became important comodity because many fish processing industries around Muncar need this comodity as their raw material. Fresh fish is then processing into fish canning, frozen fish, fish oil and fish powder. Sardinella lemuru became important comodity because many fish processing industries around Muncar need this comodity as their raw material. Fresh fish is then processing into fish canning, frozen fish, fish oil and fish powder. The marine capture industries creates job for 7000 people of Muncar resident and the fish
processing industries involves 8000 worker from around Muncar. The fisheries should be managed in sustainable way to to keep providing job for thousand people there.
IV. CONCLUSION
Sardinella Lemuru biomass stock will decrease rapidly because of too many purse seine boat operated in Bali strait fishing area and fish total catch over the maximum sustainable yield (MSY).
The decreasing of biomass stock causes reduction on purse seine catch per unit effort (CPUE) and reduces fishers’s revenue.
Purse seine boat investment in fishing industries will be unprofitable investment since too many fishing boat operated over the maximum effort needed to reach maximum economic yield level.
Purse seine boats which operate 120 trips per year will start get losses on their balance sheet in the year of 2020 although they still get profit per trip.
3. Literature study and field study
5. Model Development
Fishing effort sub system Lemuru biomass
stock sub sistem
1. Problem definition
4. Data collection
6. simulation
7. Model Structure and Validation
8. Data analysis
9. Conclution Economic / fisher
revenue sub system
2. Research objective
RESEARCH METHODOLOGY
RESEARCH METHODOLOGY
+ Natural Growth
+
Number of gears in Purse Seine standard
+
+
+
-Total catch of Non lemuru Total catch
of lemuru
CPuE
Port Total fish production Effort
Stock Lemuru
+
+
Operational cost
Purse seine Profit
Investment cost
Revenue
-+
+
+
r koefficient
+
-Fish price/ton
-+
_
Total cost (TC)
Ship owner revenue
Local market consumption
Fishers revenue +
_
_
Stock non lemuru
+
Figure 2. Causal loupe diagram of system dynamic model
Effort Std. Purse Seine
1/1/2000 1/1/2010 1/1/2020 1/1/2030 1/1/2040
15,000 20,000 25,000 30,000 35,000 40,000 trip/yr
t
r
ip
/y
r
Non-commercial use only!
Forecasting of Lemuru biomass stock of Bali straits
1/1/2000 1/1/2010 1/1/2020 1/1/2030 1/1/2040
50,000 75,000 100,000 125,000 150,000 ton
Time
S
t
o
c
k
L
e
m
u
r
u
Non-commercial use only!
Lemuru production (Total catch per year)
1/1/2000 1/1/2010 1/1/2020 1/1/2030 1/1/2040 40,000
60,000 80,000 100,000 ton/yr
Non-commercial use only!
Figure 4. The biomass stock of Sardinella Lemuru
Figure 5. Simulation result of Lemuru total catch per year
Jan 01, 2000 Jan 01, 2010 Jan 01, 2020 Jan 01, 2030 Jan 01, 2040 -100,000,000
0 100,000,000 200,000,000 300,000,000 rp/(yr*klg)
a
n
n
u
a
l
p
r
o
f
it
Non-commercial use only!
Jan 01, 2000 Jan 01, 2010 Jan 01, 2020 Jan 01, 2030 Jan 01, 2040 10,000
15,000 20,000 ton/yr
b
y
c
a
t
c
h
Non-commercial use only!
Figure 7. Simulation output of purse seine annual profit 2000 - 2040
Figure 9. Simulation using mathematical formulation of MSY and MEY TABLE.1.
PERCENTAGE OF LEMURU PRODUCTION
Year Lemuru Production %
Other Fish Production %
Total Fish Production 2000 4.101.574 35% 7.577.174 65% 11.678.748 2001 6.781.206 45% 8.286.854 55% 15.068.060 2002 15.831.075 68% 7.319.468 32% 23.150.543 2003 25.618.960 75% 8.439.881 25% 34.058.841 2004 15.933.526 67% 7.844.013 33% 23.777.539 2005 9.020.670 78% 2.545.206 22% 11.565.876 2006 51.336.512 87% 7.478.773 13% 58.815.285 2007 54.089.139 90% 6.304.509 10% 60.393.648 2008 27.833.004 78% 7.923.632 22% 35.756.636 2009 28.446.134 87% 4.336.863 13% 32.782.997
Sources : BPPI Muncar, annual report 2009 [3] TABLE 2.
INTIAL VALUE OF SUBSYSTEM FISH STOCK AND FISHING EFFORT
Sub System Fish Stock
biomass stock t0 ( year 2000 ) : 155.995 ton R value 0,86 per year
K value 252.484,3 ton/year
(Value of Bt0, r and K according to [8])
By catch production : Normal distribution, average 6.990 ton/year and deviation standard 1.790 ton/year Sub System Fishing Effort
Purse seine : 180 unit
Other boat 337 unit on the year 2000, CPUE other boat converted to standard Purse seine : 0,089 operated 33 trip/year.
Crew/ boat : 40 person
q (coefficient of technology) = 0.000018
Trip/year : 120 trip/year
Growth of purse seine/year : 0,9 % /year
TABEL 3.
*Non Purse seine are calculation of payang, gill net, and bagan (lift net); **Other means traditional gears which its species target is not lemuru, TABLE 4. Total Investment Cost : 1.186.800.000 166.980.000
Sources : interview with purse seine owner and Directorate General of fisheries Banyuwangi district officer 2010, data was pu blished in [5]
TABLE 5.
SIMULATION OUTPUT OF BIOMASS STOCK OF LEMURU,NATURAL GROWTH,TOTAL LEMURU PRODUCTION,MUNCAR LEMURU PRODUCTION,TOTAL BY CATCH, AND ANNUAL PROFIT OF PURSE SEINE FROM 2000-2030
Simulation output
REFERENCES
[1] DFID, “A Framework for Linking Poverty to Policy in the Post-Harvest Fisheries Sector,” DFID’s Post-Harvest Fisheries Research Programme, 2004.
[2] FAO, Code of conduct For Responsible fisheries, Rome, 1995. [3] WWF, “Wajah Perikanan dan Kelautan Indonesia, memasuki
strategi pengelolaan yang berkelanjutan,” Lembar informasi, Jan. 2008.
[4] I. G. S. Merta, “Dinamika populasi ikan lemuru, Sardinella lemuru Bleeker 1853 (Pisces: Clupeidae) di perairan Selat Bali dan alternatif pengelolaannya,” Dr. Disertasi, IPB, Bogor, 1992. [5] A. E. Buchary,“In search of viable policy options for responsible
use of Sardine Resources in the Bali straits, Indonesia,”Thesis
for Doctor of Phylosofy, University of British Columbia, 2010. [6] A. Ghofar, C. P. Mathew, I. G. S. Merta and S. Salim,
“Incorporating the southern oscillation indices to the management model of the Bali strait Sardinella Lemuru.” In
Proceeding of FAO Fish Code Management on fishery and management of Bali Sardinella, Bali, 2000.
[7] J. W. Forrester, Industrial Dynamics, M.I.T. Press, New York, 1961.
[8] D. Setyohadi, “Kajian pemanfaatan sumberdaya ikan lemuru (Sardinella Lemuru) di selat Bali: Analisis simulasi kebijakan pengelolaan 2008–2020,” Dr. Disertasi, Universitas Brawijaya, Malang, 2010.
[9] BPPI Muncar, Annual Report 2009. [10] BPPI Muncar, Annual Report, 2010.
[11] Widodo and J., Suadi, Pengelolaan Sumberdaya Perikanan Laut, Gadjah Mada University Press, Yogyakarta, 2006. [12] FAO, “The state of world fisheries and aquaculture”, Fisheries
and aquaculture development Electronic Publishing, Rome, 2008.
[13] D. G. R. Wiadnya, L. Sutini, and T. D. Lelono,Manajemen Sumberhayati Perairan dengan Kasus Perikanan Tangkap di Jawa Timur, Fakultas Perikanan, Universitas Brawijaya, Malang, 1993.
[14] FAO, “Status of th l muru fish ri s in Bali Strait its development and prospect, ” in Proceeding of FAO Fishcode Management on fishery and management of Bali Sardinella in Bali strait, Rome, 2000.
[15] M. K. Widana and Y. R.Basuki, “Status of the Lemuru in Bali straits, its development and prospect, ” in FAO proceeding n Fish Code Management, 2000.
[16] S. Budiningharto, “Analisis tentang efektivitas pengaturan perikanan Lemuru Selat Bali, 1974–1996”, Dr. Disertasi, Universitas Gadjah Mada, Yogyakarta, 1999.
[17] M. Smylie, Herring, a history of the silver darlings, History Press, Brimscombe Port, Gloucesterhire, UK, 2011.
[18] J. Simmonds, Managing the Scotland Herring’s stock, Pelagic News, Aberdeen, UK, 2001.
[19] M. D. Alessi, “Measuring the biological sustainability of marine fisheries: property rights, politics, and science,”The Electronic Journal of Sustainable Development, vol. 1, no. 2, 2008. [20] WCED, “Our common future”, Report of the World Commission
on Environment and Development, 1987.
[21] A. Charles, “Sustainable Fishery System”, Fish And Aquatic Resources Series, vol. 5, Blackwell Science, Oxford, UK, 2001. [22] T. Kusumastanto, Revitalisasi Perikanan Dan Kelautan Secara
Berkelanjutan (Sustainable Fishery and Marine Revitalisation). Pusat Kajian Sumberdaya Pesisir dan Lautan, Institut Pertanian Bogor, 2004.
[23] A. Fauzi, Kebijakan Perikanan dan Kelautan, Isu, Sintesis, dan Gagasan, Gramedia Pustaka Utama, Jakarta, 2005.