CHAPTER III
RESEARCH METHOD
In this part, the researcher describes research methodology used in conducting the research. It is purposed to answer the problem of the study. This chapter consist of research type, research design, variable of the study, population and sample, research instrument, test validity and reliability, data collection procedures and technique of data analysis.
A. Research Type
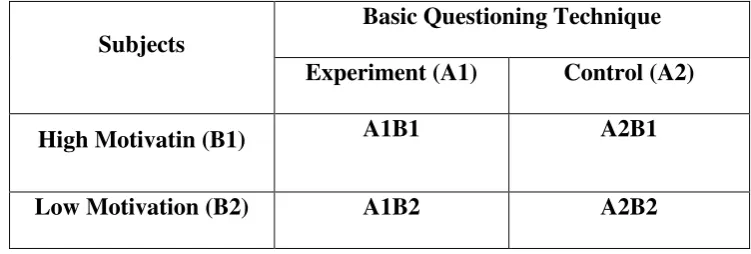
Considering the purpose of the research and the nature of the problems, the type of research is quantitative research that uses sample. The research will take two classes as experiment class and control class. Both of groups are divide into two groups;
Table 3.1 The Schema of Experimental Research Class
Subjects
Basic Questioning Technique
Experiment (A1) Control (A2)
High Motivatin (B1) A1B1 A2B1
Low Motivation (B2) A1B2 A2B2
Where :
B. Research Design
The study will use experimental factorial design. Factorial design is one in which the researcher manipulates two or more variables simultaneously in order to study the independent (basic questioning technique with picture ) effect of each variable on the dependent (high and low motivation) variable, as well as the effects caused by interactions among the several variables. The independent variables in factorial designs are referred to as factors. Factors might be categorical variables such as gender, ethnicity, social class and type of school, or they might be continuous variables such as aptitude or achievement.1
The research design of the research is experimental design because the research will measure the effect of basic questioning technique with picture
towards students’ achievement accross the different levels of motivation. It will
compare with experiment class and control class.
Experimental research involves a study of the effect of the systematic manipulation of one variable(s) on another variable. The manipulated variable is called the experimental treatment or the independent variable (basic questioning technique with picture). The observed and measured variable is called the dependent variable (high and low motivation).2
C. Variable of the study
The research has 3 variables that independent variable (X1) and dependent variables (Y1 and Y2). Independent variable is (a) using basic questioning
1
Donald Ary, et.al, Introduction to Research, p. 311.
2
technique with picture (X1). Dependent variable are students’ score to the high
motivation students (Y1) and students’ score to the low motivation students (Y2).
D. Population and Sample
1. Population
A population is defined as all members of any well defined class of people, events, or objects. If someone wants to research all of the elements in research area, his/her research is called population research on census study.3 Population is the larger group to which a researcher wishes to generalize.4
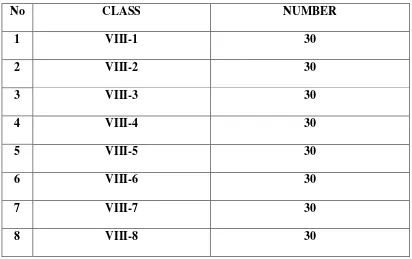
The population of the researcher are all the students at the eighth grade of SMPN 2 Palangka Raya, 240 students in seventh classes; VIII-1, VIII-2, VIII-3, VIII-4, VIII-5, VIII-6,VIII-7, VIII-8. Each class consists of 30 students.
Table 3.2 Number of students in SMPN 2 Palangka Raya
No CLASS NUMBER
1 VIII-1 30
2 VIII-2 30
3 VIII-3 30
4 VIII-4 30
5 VIII-5 30
6 VIII-6 30
7 VIII-7 30
8 VIII-8 30
3
Ibid, p.148 4
Total 240
2. Sample
Sample is a subset of individuals or case from within a population.5 Sample is a group selected from a population for observation in a study.6 In this study, the researcher takes the sample using cluster sampling technique, since the class is already established. Here, class VIII-1 will be as experimental class and VIII-2 will be as control class. They represents the population. Therefore, the study is called quasi experiment, since the researcher cannot randomize the subject.
E. Research Instruments
1. Test Type
The types of the test are to collect the data is in the form of writing test, especially writing paragraph by using basic questioning technique with picture and motivation. Since the research design of this study is factorial design, the writer gives pretest and posttest to the students.
a. Pretest is a preliminary test that has purpose to measure the students’ score in
writing before having treatment.
b. Posttest is a test given after a lesson or a period of instruction to determine what the students have learned. The purpose of posttest is to measure the students’ score in writing after the manipulation has been done by the
researcher.
5
David Nunan, Research Method in Language Learning, Cambridge: Cambridge University Press, 1992, p. 232.
6
The test consist of the instruction and statement the subjects addressed in their writing and the alternative topics to be chosen. In this sense, the students are assigned to choose one of topics that interest but experiment class chooses the topics based on the basic questioning technique with picture and the control class is without basic questioning technique with picture. They will ask to develop the topic into a text containing about 50-70 words. The allocated time to do each writing test is 70 minutes.
2. Test construction
The construction is based on the objective of the study. The study is aimed at finding the effect of basic questioning technique with picture and motivation towards students’ writing skill of recount text at SMPN 2 Palangka Raya. To
investigate the effect of basic questioning technique with picture and motivation towards students’ writing skill of recount text, the subjects are assigned to write
recount text, the result of two test are investigated using statistical analysis and the outcomes are compared to see the effect of using basic questioning technique with picture and motivation towards student’ score in control group (non
experimental).
To gain the appropriate writing test for the aim of this study, the researcher does some steps: (a). planning the writing test, (b),preparing the writing test, (c) trying out (pre test) the test and analyzing the result, and (d).carrying out the test. a. Planning the writing test
researcher decides the appropriate type of test. The test type and test objectives are very close. The test objectives cannot be achieved without having appropriate test type. Then, the researcher cares for the adequacy of the content. The test content should match with test types and objectives. Lastly, the time allocation for the test administration plans as well as the instrument try out.
b. Preparing the writing test
The writing test is used to elicit the data covering direction and instructions of what the subjects have to do. To make the instruction clear and understood by the students, the instruction is accompanied with several alternative topics. The topics are the ones the students familiar and can develop into composition.
To construct the test directions, the researcher takes into account the guidelines applied by Sabarun in Clouse as follows: (a) the question should be clear; (b) the question should be brief; (c) the instruction should be definite; (d) avoid questions requiring yes or no answer; (e) average students should be able to write average answer to the questions; (f) the vocabulary used and the concepts expressed in the topic should not be too difficult for the ordinary students to understand immediately; and (g) the instruction should provide an organizing principle for composition.7
The writing instructions are designed to measure the students’ writing ability.
The students’ ability is scored on the basis of the marking scheme that contains
some features or component of writing such as content, organization, sentences structure, and grammar, usage and mechanics of the students’ writing.
7
c. Test try out
In order to prove the test is suitable to the students who are the sample of this study, the writer will be conducting a try out test. Then the writer chooses student in the some school but different class try out the test. The try out test will be conducted to SMPN 2 Palangka Raya. VIII-1 will be as the try out class with 30 students. If the result is valid it means that the test item as the instrumentation of this study is suitable to be given.
3. Questionaire
The writer conducted questionaire test to gain information about students intrinsic motivation that suitable with problems of the study. The questionaire used rating scale,which respondent just gave a signal to their answer consist of five choice. There were Very Agree (point:5), Agree (point:4), Neutral (point:3), Disagree (point:2), Very Disagree (point:1). The test conducted to Experiment class and Control class before going to pre-test. Before conducting the pre- test, the researcher divided the subject into two categories : high and low motivation groups based on motivation test as presented in appendix 7. The subject categorized in high motivation and low motivation. It can said high motivation if the students got > 40% on motivation and low motivation if they got < 40 %.8 (See on appendix 7).
8
4. Test Validity and Reliability
a. Test Validity
The validity of a test is the extent to which it measures what is supposed to measure and nothing else. Every test, whether it is a short, informal classroom test or a public examination, should be a valid the constructor can make it. The test must aim to provide a true measure of a particular skill that it is intended to measure, to the extent that is measures external knowledge and other skills at the same time, it will not be a valid test.9
1) Face Validity
Face validity is an estimate of whether a test appears to measure a certain criterion; it does not guarantee that the test actually measures phenomena in that domain. Then, in term of the face validity, the test assigns the students to write a paragraph about 50-70 words.
For face validity of the test items as follow:
1) The test used written test in writing test instruction. 2) The evaluation by written test based on scoring system. 3) Kind of the written test was writing recount text. 4) The Language of items used English
5) The written test was suitable with syllabus of English writing for eight grade at first year students at SMPN 2 Palangka Raya.
9
2) Content Validity
This kind of validity depends on a careful analysis of the language being tested and of the particular course objective. Content validity can be checked by examining the agreement between the objective of the course and the test items used.10 Related to writing test, the content validity can be checked by examining the agreement between the objectives of the course and the test are use to measure the objectives.
b. Instrument Reliability
Reliability is a necessary of any good test: for to be valid at all, a test must first be reliable as a measuring instrument. To measure the reliability of the whole test can be estimated by using the formula of Alpha method11:
11 : Reliability of instrument
S1 : The number of score variant of each item.
John Brian.Heaton, Writing English Language Test, New York: Longman, 1990, p.162.
The measurement of instrument try out reliability is known that the whole numbers of test items are reliable and can be used as the instrument of the study.
Table 3.3
Inter-Rater Coefficient Correlation and Interpretation
Correlation Coefficient Interpretation
.90 to 1.00 or -.90 to -1.00 Very high positive or negative correlation .70 to .89 or -.70- to -.89 High positive or negative correlation .50 to .69 or -.50 to -.69 Moderate positive or negative correlation .30 to .49 or -.30 to -.49 Low positive or negative correlation .00 to .29 or -.00 to -.29 Little if any correlation
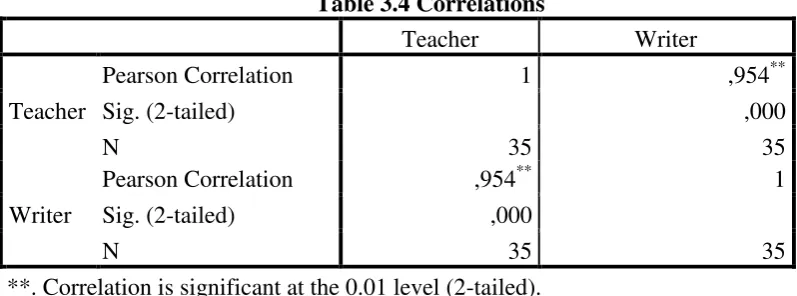
Table 3.4 Correlations
Teacher Writer
Teacher
Pearson Correlation 1 ,954**
Sig. (2-tailed) ,000
N 35 35
Writer
Pearson Correlation ,954** 1
Sig. (2-tailed) ,000
N 35 35
**. Correlation is significant at the 0.01 level (2-tailed).
Based on the calculation above used SPSS program, the r was 0.954. Then it was consulted with r table of Product Moment with df= 35-2= 33, the
level of significance 5% so r table = 0.3494. Because r=0.954>r table= 0.3494, it
could be concluded that the try out was reliable.
F. Data Collection
The data for this study collects through two group pre-test and post-test design. The pretest conducted in the first meeting of the research to both groups. Both of tests are about writing a paragraph. The test administered at the same time that is about 80 minutes. In experimental groups, using basic questioning technique with picture (X1) and motivation (X2) on the students’ writing. The
posttest conducted in the final meeting of the research. The test administered at the same time that 70 minutes, the same given topic and the same length of time.
Before conducting the pre- test, the researcher divided the subject into two categories : high and low motivation groups based on motivation test as presented in appendix 7. The subject categorized in high motivation and low motivation. It can said high motivation if the students got > 40% on motivation and low motivation if they got < 40 %.12 (See on appendix 7)
G. Techniques of Data Analysis
a. Normality Test
It is used to know the normality of the data that is going to be analyzed whether both groups have normal distribution or not.
Chi square is used here13
=
Notice:
= Chi square
12
Wawan Setiawan, Upaya Meningkatkan Motivasi Belajar, http://wawan. setiawan. ardcorp.Education.blogspot.com/2013/01/upaya-meningkatkan-motivasi- belajar. Html, Accesed on August, 2014.
13
= frequency from observation = expected frequency
Calculation result of is compared with x table by 5% degree of significance. If is lower than x table so the distribution list is normal. The data is said to be normal if the P value is higher than 0,05.
b. Homogeneity Test
Is used to know whether experimental group and control group, that are decided, come from population that has relatively same variant or not. The formula is:14
F =
Notice:
F : Frequence
The hypotheses in homogeneity:
Fvalue ≤ Ftable, means both of variants are homogeneity.
Fvalue > Ftable, both of variants are homogeneity.
If calculation result of F is lower than F table by 5% degree of significance so Ho is accepted, it means both groups have same variant. The data
is said to be homogeneity if the P value is higher than 0,05. c. Two-way Analysis of Variance
The problem of the study:
14
1. Is the basic questioning technique with picture effective to the students’ writing skill of recount text at the eighth grade of SMPN 2 Palangka Raya?
2. Is the students’ motivation effective to the students’ writing skill of
recount text at the eight grade of SMPN 2 Palangka Raya?
3. Are the basic questioning technique with picture and motivation effective
to the students’ writing skill of recount text at the eighth grade of SMPN 2
Palangka Raya?
To answer the research problems above, the researcher applies the ANOVA statistical calculation. The steps are as follows:15
a. The total sum of squares
SSt= ∑X2t– ∑
Where
SSt = sum of square total ∑X2
= each score squared, then summed
(∑Xt)2 = all the scores summed first, then this sum squared
N = number of scores b. The sum of squares between groups16
SSb = ∑ + ∑ - ∑
c. The sum of squares within groups
SSw = SSt - SSb
15
Donald Ary, et.al, Introduction to Research, p.180
16
d. The between-columns sum of squares
SSbc = ∑ +
∑ -
∑
e. The between-rows sum of squares
SSbr = ∑ +
∑ -
∑
f. The sum of squares interaction
SSint = SSb – (SSbc + SSbr)
g. Determine the number of degrees of freedom associated with each source of variation. They are found as follows:17
df for between-columns sum of squares = C − 1
df for between-rows sum of squares = R − 1
df for interaction = (C − 1)(R − 1)
df for between-groups sum of squares = G − 1
df for within-groups sum of squares = N −G df for total sum of squares = N − 1
where:
C = number of columns
R = number of rows
G = number of groups
N = number of subjects in all groups
17
h. The mean square values by dividing each sum of squares by its associated number of degrees of freedom.
i. Compute the F ratios for the main and the interaction effects by dividing the between-groups mean squares by the within-groups mean square for each of the three components.
H. Data Analysis
The writer do some ways in the data analysis procedures, they are as follows: 1. Collecting the data of the test result.
2. Transcribing the students’ score based on the scoring system.
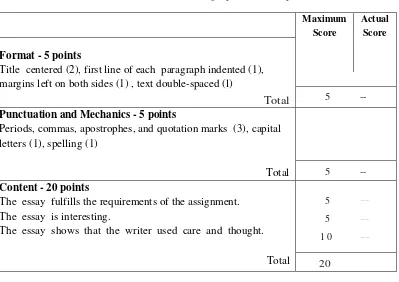
Table 3.5 Scoring System: Essays18
Title centered (2), first line of each paragraph indented (1), margins left on both sides (1) , text double-spaced (l)
Total 5
--Punctuation and Mechanics - 5 points
Periods, commas, apostrophes, and quotation marks (3), capital letters (1), spelling (1)
Total 5 --Content - 20 points
The essay fulfills the requirements of the assignment. The essay is interesting.
The essay shows that the writer used care and thought.
Organization - 45 points
-The essay follows the outline, and it has an introduction, a body, and a conclusion.
-Introductory Paragraph: The introductory paragraph begins with several general sentences and ends with a thesis statement.
Body
-Each paragraph of the body discusses a new point and begins with a clear topic sentence.
-Each paragraph has specific supporting material: facts,
examples, quotations, paraphrased or summarized information, and so on.
-Each paragraph has unity. -Each paragraph has coherence.
-Transitions are used to link paragraphs.
-Concluding Paragraph: The concluding paragraph summarizes the main points or paraphrases the thesis statement, begins with a conclusion signal, and leaves the reader with the writer's final thoughts on the topic.
Grammar and Sentence Structure - 25 points
Estimate a grammar and sentence structure score.
25
Grand Total 1 00
After conducting the test, the researcher gave score to the writing test papers of the students. The researcher used test to measure the writing ability covering format, punctuation and mechanic, content, organization, grammar and sentence structure. In giving score of writing test, the researcher processes the
result of the students’ tests. The writer gave score for each component of writing
as follows:
1) Format: the lowest score is 1 and the highest score is 30
2) Puntuation and mechanic: the lowest score is 1 and the highest score is 5 3) Content: the lowest score is 1 and the highest score is 20
5) Grammar and sentence structure: the lowest score is 1 and the highest score is 25 points.
3. Tabulating the score into distribution of frequency of score table.
4. Calculating the data by using two-way analysis of variance to answer the problem of the study. Analyzing the data by statistic technique of ANOVA using statistical computerized program named SPSS version 13.
5. Interpreting the finding.
6. Lastly, a discussion the results to clarify the findings.
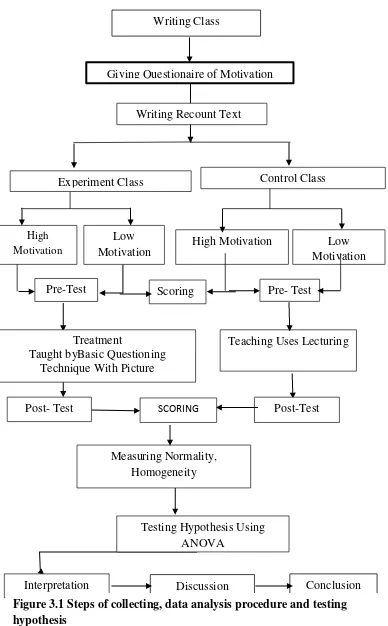
To sum up, the steps in collecting, analyzing, and hypothesis testing can describe below. In the first step, the subject were divided into two category levels of motivation are high and low. The subject gave questionaire of motivation. Then, the students gave Pre- Test that they selected the topic for recount text. The subjects were divided into two groups; experimental group and control group. Experiment group was assigned to write a recount text using basic questioning technique with picture and control group write without treatment. Next step, the
students’ writing both using basic questioning technique with picture or without
Teaching Uses Lecturing Writing Class
Control Class
Pre- Test
Pre-Test Scoring
Low Motivation Low
Motivation High
Motivation
Experiment Class
Writing Recount Text
Testing Hypothesis Using ANOVA
High Motivation
Measuring Normality, Homogeneity
Post-Test SCORING
Post- Test
Conclusion Discussion
Interpretation Treatment
Taught byBasic Questioning Technique With Picture
Figure 3.1 Steps of collecting, data analysis procedure and testing hypothesis