FINAL REPORT
An Assessment of Lessons Learnt from the “Green Coast Project”
in Nanggroe Aceh Darussalam (NAD) Province and Nias Island, INDONESIA (Period 2005-2008)
Authors : Iwan Tri Cahyo Wibisono Ita Sualia
Contributor & Editors : I Nyoman N. Suryadiputra Dipa Rais
Design & Layout : Triana
Cover Photographs : Wetlands International - IP Documentation
This report is available at:
Wetlands International – Indonesia Programme Jl. A. Yani No. 53 Bogor 16161
Jawa Barat – INDONESIA Tel. 0251 8312189 Fax. 0251 8325755
E-mail: [email protected]
or
WWF-Indonesia
Aceh Programme Office
Balee Panda: Jl. Tengku HM Daud Beureuh no. 177A Lampriet, Banda Aceh 23126
Ph. 0651 635189 / 635190 Fax. 0651 635192
E-mail: [email protected]
Reference:
Preface
Tsunami yang terjadi di penghujung tahun 2004 telah menyebabkan lebih dari 200.000 korban jiwa dan menghancurkan ekosistem pesisir di Propinsi Nanggroe Aceh Darussalam (NAD) dan Pulau Nias. Selain itu, bencana ini juga bertanggung jawab atas hancurnya mata pencaharian penduduk yang tinggal di wilayah pesisir. Sehubungan akan kejadian tersebut, Wetlands International Indonesia Programme (WIIP) telah bekerjasama dengan WWF Indonesia dalam menyelenggarakan suatu proyek rehabilitasi pesisir yang dikaitkan dengan penciptaan alternatif mata pencaharian atau disebut proyek “Green Coast”. Berbeda dengan proyek-proyek lainnya yang pada umumnya lebih mengarah pada berbagai pembangunan infrastruktur dan tindak darurat, Green Coast (GC) justru lebih mengarah pada upaya-upaya perbaikan ekosistem pesisir dan pemberdayaan ekonomi masyarakat yang terkena dampak Tsunami. Melalui pendekatan “Bio-rights”, Green Coast memberikan kesempatan yang luas kepada masyarakat korban Tsunami (melalui kelompok atau difasilitasi oleh LSM lokal) untuk bersama-sama merealisasikan rehabilitasi ekosistem pesisi, sementara di sisi yang lain mereka juga memperoleh kesempatan untuk memperbaiki mata pencahariannya melalui pemberdayaan ekonomi. Untuk menunjang pelaksanaan kegiatan di lapangan, proyek juga melakukan upaya-upaya khusus dalam ranah kebijakan (policy), monitoring dan evaluasi, peningkatan kapasitas (capacity building) dan peningkatan kesadaran lingkungan (awareness raising).
Dalam pelaksanannya di lapangan, proyek dilakukan melalui dua tahap yaitu GC fase 1 (Juli 2005 – Maret 2007) dan GC fase 2 (April 2007 – Maret 2009). Setelah hampir empat tahun berjalan, proyek telah berhasil merehabilitasi sekitar seribu hektar wilayah pesisir dengan sekitar dua juta tanaman bakau (mangrove) dan tanaman pantai (beach plants). Tingginya prosentase tumbuh dari kegiatan rehabilitasi pesisir (rata-rata sekitar 65% - 85%) menunjukkan bahwa kegiatan ini terlaksana dengan baik. Dari aspek yang lain, proyek juga telah berhasil mendorong masyarakat untuk membuka peluang-peluang ekonomi dan merintis kembali kegiatan mata pencahariannya.
mengatasinya. Beberapa kendala umum yang dijumpai antara lain kurangnya kesadaran masyarakat atas lingkungan, kurang matangnya perencanaan dalam kegiatan ekonomi, kurang optimalnya pemeliharaan tanaman rehabilitasi, dan konflik kepentingan. Terlepas dari hal-hal tersebut, proyek mendapatkan suatu pengalaman dan pembelajaran yang sangat penting dalam menunjang program-program serupa di masa mendatang.
.Kajian pembelajaran ini secara khusus digali dari berbagai informasi dan data-data lapangan yang terkait selama proyek berlangsung. Dengan demikian, hasil dari kajian ini diharapkan dapat menyajikan informasi yang memadai mengenai realisasi proyek
Terlepas dari berbagai kekurangan dan keterbatasannya, proyek berharap bahwa hasil dari kajian ini dapat bermanfaat bagi pihak lain, baik pemerintah maupun non pemerintah, terutama yang berkepentingan dengan program-program serupa.
Penyusun,
Glossary and Abbreviation
ADB: Asian Development Bank
BAPPEDA: Badan Perencanaan dan Pembangunan Daerah (Regional Planing
Board)
BAPEDALDA: Badan Pengendalian Dampak Lingkungan Daerah (Regional
Environmental Impact Management Agency)
BKSDA: Balai Konservasi Sumberdaya Alam (Natural Resources Conservation
Agency)
BP-DAS: Balai Pengelola Daerah Aliran Sungai (Watershed Management
Authority)
BRR Aceh-Nias: Badan Rehabilitasi & Rekonstruksi Aceh Nias The Agency for Reconstruction and Rehabilitation for Aceh Nias
CBO: Community Based Organization
DAS: Watershed
Dephut: Departemen Kehutanan (Forestry Departement)
DKP: Departemen Kelautan dan Perikanan (Marine and Fisheries Departement)
GC: Green Coast
IPB: Institut Pertanian Bogor (Bogor Agricultural University)
IUCN: International Union for Conservation of Nature and Natural Resources Kab.: Kabupaten (district)
Kec.: Kecamatan (sub district) KK: Kepala Keluarga (house holds)
LIPI: Lembaga Ilmu Pengetahuan Indonesia (Indonesian Institute of Sciences)
LSM: Lembaga Swadaya Masyarakat (Non Government Organization/ NGO)
Monev: Monitoring and evaluation
NAD: Nanggroe Aceh Darussalam NGO: Non Government Organization
Panglima Laot: traditional leader for maritime affair in Aceh Province
PHKA: Perlindungan Hutan dan Konservasi Alam (Forest Protection and Nature Conservation)
PPI: Pelabuhan Pendaratan Ikan (Fish Landing Place)
Prov.: Province
SD: Sekolah Dasar (elementary school)
SDM: Sumber Daya Manusia (human resources)
SGM: Small Grant Manager
SMA: Sekolah Menengah Atas (Senior High School) SMP: Sekolah Menengah Pertama (Junior High School)
Sea defense: Consultant from Netherland for reservoar construction in Teluk Pusong Lhokseumawe
Tk I: Provincial Level
Tk II: District Level
TPI: Fish Auction Place
UNSYIAH: University of Syiahkuala
WALHI: Wahana Lingkungan Hidup
WIIP: Wetlands International Indonesia Programme
Table of Contents
Page
Preface ... iii
Glossary and Abbreviation... v
Table of Contents... vii
List of Tables... ix
List of Pictures... x
List of Boxes... xiv
List of Annexes... xiv
1. Introduction... 1
1.1. Background ... 1
1.2. A closer look at Green Coast ... 2
1.3. Aims and objectives of the assessment of lessons learnt ... 6
2. Realization and achievements of Green Coast 1... 7
2.1. Comprehensive assessment (August – December 2005) ... 8
2.2. Community based rehabilitation of coastal ecosystems and Livelihoods through small grants ... 12
3. Realization and achievements of Green Coast 2... 27
3.1. Environmental and social- economy assessment ... 28
4. Policy Development in Green Coast... 45
4.1. Strategy and approach to criticising policy development ... 45
4.2. Formation and development of the kuala network ... 47
4.3. Achievements of the policy component ... 48
5. Other Activities Supporting Green Coast... 53
5.1. Monitoring and evaluation ... 53
5.2. Communication and coordination ... 54
5.3. Capacity Building ... 56
5.4. Awareness Raising ... 57
6. Important Findings and Lessons from the Field ... 61
6.1. Findings and facts in the field ... 61
6.2. Lessons learnt from experience in the field ... 91
7. Constraints and Limiting Factors... 99
8. Recommendations and Suggestions... 121
8.1. Anagement of ecosystem rehabilitation and livelihood Recovery ... 121
8.2. Policy advocacy and sustainable coastal management ... 124
8.3. Sustainability of the project (exit strategy) ... 126
LIST OF TABLES
Table 1. Summary of proposal selection process; numbers submitted and
numbers approved in Green Coast 1 ... 14
Table 2. Distribution and allocation of funds for each stretch ... 15
Table 3. Summary of activities realised under Green Coast 1... 16
Table 4. Mangrove species planted during Green Coast 1 ... 18
Table 5. Species of beach plants commonly planted on the beach ... 19
Table 6. Percentage survival rates from rehabilitation activities during GC 1 ... 20
Table 7. Percentage of GC partners applying each type of business capital management ... 23
Table 8. Livelihoods developed by Green Coast 1 ... 24
Table 9. Local partners for Green Coast Phase 2 ... 30
Table 10. Summary of activities realised under Green Coast 2 (per September 2008)... 34
Table 11. Mangrove species planted during Green Coast 2 ... 35
Table 12. Beach plant species planted in the field ... 37
Table 13. Percentage survival rates from rehabilitation activities during GC 2 ... 38
Table 14. Business capital management by groups in Green Coast 2 ... 40
Table 15. Types and numbers of economic activities in Green Coast 2 ... 42
Table 16. Silvofishery ponds in Aceh facilitated by Green Coast ... 69
Table 17. Oven-dry mass for each part of the tree (gram) ... 77
Table 18. Strengths and weaknesses of working together with local partners ... 81
Table 19. Activities constituting synergy between Green Coast and other parties in NAD Province ... 90
LIST OF PICTURES
Picture 1. Bio-rights programme was first developed by WI-IP at the Pesantren village, Pemalang District, Central Java in 1998. The programme has combined the re-greening of the ponds dikes and the beach (left) with livelihoods such as goat farming (right) ... 3 Picture 2. Sites for comprehensive assessment for “Green Coast” ... 8 Picture 3. Changes to the coastal landscape in NAD province and Nias as
a result of the earthquake and Tsunami ... 10 Picture 4. Flow chart showing the proposal selection mechanism from
submission to approval ... 13 Picture 5. Map showing distribution of activities under Green Coast phase 1
(area of red circles indicates number and volume of activities in each region) and the table (right) showing the total amount of fund
distributed in each region (in iDR) ... 14 Picture 6. Percentage allocation of funds for each stretch ... 15 Gambar 7. Mangrove planting achieved (area, number of seedlings) during
the period of GC 1 ... 17 Picture 8. Beach plant planting achieved (area, number of seedlings) during the
period of GC 1 ... 18 Picture 9. Percentages for choices of livelihoods developed in GC 1 ... 24 Picture 10. Fruit cracker production (left) and Souvenir shop (right) at Sultan
Iskandar Muda airport (Banda Aceh) by the Tibang women’s group,
facilitated by YAGASU ... 25 Picture 11. Provision of motorboat in Kahju village, facilitated by Yayasan LEBAH
foundation (left) and Duck farming in Lham Ujong village ... 25 Picture 12. Sites for Environmental and Social-Economy assessment for
“Green Coast” phase 2 ... 29 Picture 13. Map showing distribution of activities under Green Coast phase 2 ... 32 Picture14. Percentage allocation of funds in Green Coast 2 ... 33 Picture 15. Mangrove planting achieved (area, number of seedlings) during
Green Coast 2 ... 34 Picture 16. Percentage of seedlings of each species planted during Green
Coast 2 ... 35 Picture 17. Sandy beach rehabilitation achieved (area, number of seedlings)
Picture 19. Goat farming managed jointly by the group in Suak Nie
(Aceh Barat) ... 41
Picture 20. Percentages for choices of livelihoods developed in GC 2 ... 42
Picture 21. Strategy and approach to policy development and advocacy in Green Coast ... 46
Picture 22. Flow chart showing the process of policy development through legal drafting ... 46
Picture 23. Front page of Website KuALA-Green Coast (http:// www.KUALA.com) ... 48
Picture 24. Policy documents produced through Green Coast ... 49
Picture 25. The process of calculating plant survival rate ... 54
Picture 26. Discussion between Green Coast and sea defence consultant, facilitated by BRR ... 55
Picture 27. Training in institutional management in Banda Aceh ... 57
Picture 28. Various awareness products produced by Green Coast ... 59
Picture 29. Environmental campaign at Desa Riting and Desa Kahju ... 60
Picture 30. Environmental exhibition in Banda Aceh ... 60
Picture 31. Various competitions as part of Indonesian Independence Day celebrations ... 60
Picture 32. Rehabilitation planned and achieved under Green Coast (in hectares) ... 64
Picture 33. Planting along water channels ... 66
Picture 34. Enrichment planting along tributaries ... 66
Picture 35. Condition of mangroves in tambak ponds ... 67
Picture 36. Planting in belts in tambak ponds ... 68
Picture 37. Comparison of areas covered by silvofishery and non silvofishery in mangrove rehabilitation under the Green Coast project... 68
Picture 38. Pie chart showing the percentage survival rate for each species ... 70
Picture 39. 3D visualisation of a plot measuring 20 m x 50 m on a site planted by Yayasan Lebah (powered by SLIM-ICRAF) ... 71
Picture 42. Satus of sandy beach land rehabilitated in Green Coast 2, given in
percentages ... 74
Picture 43. Flow chart showing alternatives in the decision making mechanism ... 75
Picture 44. Pie chart showing methods of obtaining mangrove seedlings ... 75
Picture 45. Pie chart showing methods of obtaining beach plant seedlings ... 76
Picture 46. Breakdown of livelihoods developed under Green Coast (GC1 and GC 2) ... 78
Picture 47. Comparison of business capital management models in GC 1 and GC 2 ... 83
Picture 48. Jackfruit crisps home industry by the Women’s Group – Desa Tibang ... 84
Picture 49. Cake-making – a business popular among members of the women’s group (using GC revolving fund) ... 85
Picture 50. Silvofishery ponds for milkfish culture (left), crab cage culture (right) ... 86
Picture 51. Milkfish harvest, from polyculture of milkfish with jumbo tiger prawns (left), Women sorting harvested prawns (right) ... 87
Picture 52. Small-scale business making tempe, carried out by a group member in Desa Kedue Unga village ... 88
Picture 53. Six planting systems employed by the community, in the tambak ponds -desa Lham Ujong village ... 91
Picture 54. Appearance of the yellow cotyledon characteristic of a mature propagule ... 92
Picture 55. Soaked propagul ... 93
Picture 56. Gradation in growth from edge to middle of mudflat ... 94
Picture 57. Left: Gently sloping embankment (prone to attack from livestock), Right : Steep sided embankment (relatively safe from attack by livestock) ... 95
Picture 58. Mud skippers indicate a muddy substrate; a good sign for planting mangrove ... 95
Picture 59. Barnacles; indicator that the site is not suitable for planting mangrove ... 96
Picture 60. Colony of shoreline purslane; indicator of sandy substrate with high salinity ... 96
Picture 62. Villagers helping to fill polybags with mineral soil as a media
for mangrove seedlings ... 98
Picture 63. Terrestrial nursery with artificial water logging ... 98
Picture 64. Mangrove planted on an unsuitable site ... 105
Gambar 65. Beach plants planted on beaches that are labile and subject to ocean tides ... 105
Picture 66. Swamp defragmented by highway construction ... 106
Picture 67. Mangrove stand fallen victim to road construction at desa Kedue Unga village ... 107
Picture 68. Mangrove forest completely cut down (left), mangrove trunks made into stakes (centre) and use of mangrove poles for ditch props and foundations ... 108
Picture 69. Timber felling around the swamp for sale to the fish landing quay construction project ... 108
Picture 70. River blocked to facilitate access by land ... 109
Picture 71. Tambak pond construction has sacrificed hundreds of mangrove trees planted around the lagoon ... 110
Picture 72. Almost completed embankment sea defence on mudflats at Desa Kedeu Aceh village -Lhokseumawe ... 111
Picture 73. Mangrove sacrificed in repairs to trenches in Jambo Timu village, Lhoksumawe ... 112
Picture 74. Livestock and caterpillars; Common pests found disturbing beach plants ... 115
Picture 75. Barnacle attack on mangrove ... 113
Picture 76. Caterpillar attack kills mangrove ... 113
Picture 77. Filamentous algae disturbing mangrove growth ... 114
Picture 78. Accretion in desa Iboih village – Sabang ... 115
Picture 79. Accretion in Bahonawono village – Nias ... 115
Picture 80. Abrasion in desa Kahju village... 116
Picture 81. Burning that killed dozens of plants in Desa Kedua Unga village ... 117
LIST OF BOXES
Box 1. What is Bio-rights ... 3
Box 2. The Gender Aspect in Green Coast ... 43
Box 3. Estimated carbon gained by Sea-Pine trees planted by Green Coast project in Desa Kajhu, Aceh Besar ... 77
Box 4. GC in the eyes of the community ... 87
LIST OF ANNEXES Annex 1. Recommendation of Several Demo Sites for Coastal Ecosystem Rehabilitation after Tsunami ... 131
Annex 2. List of Proposed Demo Site for Coastal Rehabilitation, in Aceh and Nias ... 134
Annex 3. Comprehensive Evaluation of Local Partners Small Grant (SG) ... 145
Annex 4. Village Regulation of Coastal Area Management at Krueng Tunong Village, Number 11.14.05.03.2022/338/2008 ... 149
Annex 5a. Form Regular Monitoring and Evaluation for Livelihood Activities ... 150
Annex 5b. Form of Regular Monitoring and Evaluation ... 153
Introduction
1
1.1. BACKGROUND
The Tsunami disaster of 26 December 2004 swept away everything along 800km of the coast of Nangroe Aceh Darusalam, causing the deaths and loss of 167 thousand people, while more than 500 thousanad others lost their homes and livelihoods. By December 2005, as many as 124 international NGOs, 430 national NGOs, tens of donor and UN organizations, a variety of Government institutions and military institutions had been recorded, together with the community, to be working on rebuilding Aceh (BRR,2005).
The first step in the reconstruction effort focused mostly on the emergency response, particularly with regard to fulfilling the victims’ need for basic items such as food, clean water and general infrastructure. As conditions in the field began to improve, the emergency gradually subsided and work moved to other sectors, such as the rehabilitation of the coastal areas impacted by the Tsunami. This was undertaken by a variety of organizations, both government and non-government, through activities such as the planting of mangrove and other beach plants.
Since the start of the project, GC has facilitated 60 local NGOs and Community Based Organizations (CBO; Kelompok Swadaya Masyarakat) to train and assist Tsunami victims in rehabilitating the coastal ecosystem and at the same time restoring or creating alternative livelihoods in Aceh and Nias. In order to achieve active participation by the community, the local inhabitants were involved directly in the planning, preparation, planting and nursing of the seedlings. By March 2009 no fewer than 893 ha of Aceh’s and Nias’ coastland had been rehabilitated through the planting of mangroves (1.6 million seedlings) and beach plants (250,000 seedlings), and the conservation of coral reef.
The community’s active participation in this rehabilitation effort was rewarded in the form of collateral-free, interest-free “loans” of business capital to the CBOs involved. This fund could then be used to build alternative livelihoods. All the conditions (the CBO’s rights and obligations) pertaining to the provision of the business capital tied to rehabilitation success are contained in a work contract witnessed by community leaders. In principle, the purpose of this contract is to motivate the community to maintain the highest possible survival rate of the seedlings planted in the rehabilitation activity (above a target threshold of 75%). If this target was not met, then the business loan already given would have to be repaid (proporsioannaly with the number of survival rate/SR of trees). Conversely, if the target was achieved or surpassed, then the “loan” would be converted into a grant. This approach –known as biorights approach-proved to be very successful, as reflected by the high survival rate.
Implementation of Green Coast activities in Aceh-Nias was assisted by an Advisory Committee (AC) comprised of one representative each from BRR, Dinas Kehutanan (Forestry Service), Bapedalda (Regional Environmental Impact Management Agency), Panglima Laot Provinsi and an adviser on social and gender issues. The Advisory Committee took part in the selection of proposals submitted to the project by the various local NGOs and CBOs, and supplied input/guidance towards improving activities in the field.
During almost four years of implementation in the field, this project faced a variety of constraints. Aside from these constraints, the project acquired much valuable experience and many valuable lessons. On this basis, an assessment is needed to identify the various experiences and lessons which can inform those parties concerned with implementing coastal rehabilitation in Indonesia.
1.2. A CLOSER LOOK AT GREEN COAST
Figure 1. Bio-rights programme was first developed by WI-IP at the Pesantren village, Pemalang District, Central Java in 1998. The programme has combined the re-greening of
the ponds dikes and the beach (left) with livelihoods such as goat farming (right)
Box 1: What is Bio-rights?
Bio-rights is an innovative financing mechanism targeted at reconciling poverty alleviation and environmental conservation. Through provision of micro-credits for sustainable development, the approach supports local communities to refrain from unsustainable practices and to actively involve in conservation and rehabilitation of the environment. Micro-credits are converted into definitive payments upon successful delivery of conservation services after termination of a contracting period. Being an integration of market-driven instruments and more traditional conservation and development measures, Bio-rights offers a novel approach in which global stakeholders pay local communities for the provision of ecosystem services such as carbon sequestration, fresh water supply and biodiversity. As such, the approach unites the conservation and development aspirations of NGOs, governments, private sector and local communities alike. Projects in the field have demonstrated that Bio-rights can serve as a powerful tool towards addressing the major environmental challenges of our age including climate change and biodiversity loss. In the light of major efforts in relation to REDD (Reducing Emissions from Deforestation and Degradation) development and the Millennium Development Goals (MDGs), Bio-rights offers huge potential for translating global objectives into concrete action.
Unlike many other coastal rehabilitation projects in Nanggroe Aceh Darussalam (NAD) province, this project adopts one principle, which is that the rehabilitation and management of coastal ecosystems should actively involve the community in enriching the biodiversity and improving/building the livelihoods of coastal communities. There are three inter-related main components in its management, which are: 1) Environment and social-economy
Assessment, 2) Community Based Rehabilitation of Coastal Ecosystems and
Livelihoods through the Small Grant Facility, and 3) Policy Development. These are explained in more detail below.
a. Environment and social-economy Assessment
The Environment and social-economy assessment is a technical assessment of various aspects of the Tsunami’s impact relevant to the coastal ecosystem rehabilitation to be done. Specifically, it encompasses an evaluation of the Tsunami’s impact on the environment, identification of the types of wetland impacted, assessment and analysis of the potential/ prospects for the ecosystem rehabilitation programme. Besides this, the assessment also collects other information concerning the constraints and limiting factors related to the implementation of coastal rehabilitation. As the community is both the target and the main actor, this assessment also covers economic, social and cultural matters. Thus, the pattern of empowerment and the form of community partnership in the programme can be determined appropriately. The role of women (gender issues) also receives attention in the assessment. The themes discussed focus on the role of women in ecosystem management, preferred types of livelihoods, and roles in decision making.
The assessment team comprised an ecologist, economist, rehabilitation specialist, sylviculture specialist, soil scientist, biodiversity specialist, and limnologist. Besides carrying out a comprehensive technical assessment, the team also recommended various options for undertaking coastal rehabilitation and livelihood improvement.
In detail, this assessment provides basic information on many issues: What was the condition of the environment before the Tsunami? At which sites has the coastal ecosystem been destroyed or damaged? What do the people affected by its impact need? What is the local community’s attitude towards coastal ecosysytem rehabilitation? What are the community’s rights in coastal rehabilitation (what benefit can the community get from coastal rehabilitation)? Is it possible to rehabilitate or start up livelihoods? What options can be provided in coastal rehabilitaion? How can livelihoods be restored without damaging nature or the environment?
Conducting an assessment also means talking with the community and discussing rehabilitation activities with local decision makers. What do they need? How can their knowledge of coastal rehabilitation be utilised? What are their ideas about the recovery of livelihoods? How can they benefit from coastal rehabilitation?
b. Community Based Rehabilitation of Coastal Ecosystems and Livelihoods through the Small Grant Facility
As the Tsunami not only devastated coastal ecosystems but also ruined people’s livelihoods, GC took the approach that community involvement and empowerment was the key to success in the rehabilitation of coastal ecosystems and livelihoods. The implementation and management of this were carried out by WI-IP.
The “bio-rights” approach to the community based rehabilitation of coastal ecosystems and recovery of livelihoods was applied through the facilitation of small grants. Coastal rehabilitation was combined with economic empowerment. With this approach, the community received business capital to start or revive a livelihood. In return, they had to give their services to the environment by undertaking coastal rehabilitation. [Explanation regarding Bio-Rights can be read in the “ Eijk, P. van & R. Kumar, 2008. Bio-rights in theory and practice. A financing mechanism for poverty alleviation and environmental conservation. Wetlands International, Wageningen, the Netherlands].
The mechanism for this was to provide capital loans to those members of the community prepared to take part in rehabilitating the coastal ecosystem. If their efforts were judged successful, in that at least 75% of the trees were still living after one year, then the loan would be converted into a grant. If fewer than 75% survived, then part of the loan would have to be repaid, equivalent to the proportion of trees that had died. This approach also raised the community’s sense of responsibility towards the rehabilitation work they were doing.
c. Policy Development
One of the missions within this component was to convince and encourage the government, donor institutions, the private sector and various other parties involved in carrying out environmentally friendly reconstruction. The rebuilding of Aceh is expected to bring as much benefit as possible to the coastal communities. More, it can also provide momentum for rebuilding better than before. Of course, this can only be done if rebuilding is carried out conscientiously, takes into account all related aspects and is supported by clear, appropriate policies. In this context, development and guidance on policy is needed.
Development and guidance (facilitation, giving input and support throughout the process of formulation) were needed in order to direct policy towards environmentally friendly or “green” reconstruction. This component specifically influenced policy on coastal resources management at district, provincial and national levels.
Activities connected with policy were implemented by WWF in coordination with WI-IP and other relevant parties. In certain matters, WI-IP provided technical assistance to support the development of policy.
Besides the three main components above, the project also included measures to support activities in the field. Monitoring and evaluation (monev) was conducted periodically by project management with the assistance of a technical monev team to monitor developments and the implementation of the project in the field. To improve the capabilities and technical capacities needed by the community and the local partner (NGO) for the rehabilitation work and for economic empowerment, the project provided training, exchange visits and comparative studies to coastal areas in Aceh (even to Java) packaged within a Capacity Building component. Another target was to raise community awareness through the Awareness Raising component. A range of awareness materials such as leaflets, posters, booklets were produced and an environmental campaign conducted. The Communication and Networking component dealt specifically with coordination and communication between project management and their partners in the field, as well as parties outside the project.
1.3. AIMS AND OBJECTIVES OF THE ASSESSMENT OF LESSONS LEARNT
The aims and objectives of assessing lessons learnt from the implementation of this project are as follows:
1. To supply sufficient general information concerning the project, including its concept, approach, aims, objectives and target.
2. To obtain data and information related to implementation throughout the duration of the project
3. To document the processes applied during implementation in the field
4. To identify the stakeholders and their individual roles in project implementation in the field
5. To identify the constraints, challenges and obstacles in project implementation
6. To summarise experience acquired during project implementation both from management and from the local partner in the field
7. To summarise valuable lessons obtained during project implementation
Realization and Achievements of
Green Coast 1
2
At the start of Green Coast project phase 1 (GC 1: July 2005 – March 2007), a comprehensive (bio-physic & social -economy) assessment was carried out by the assessment team along the coasts of Aceh and Nias Island that had been impacted by the Tsunami. Its purpose was to bring to light a variety of data and information from the field as a basis upon which to develop options that could be applied in the project. This comprehensive assessment was one of the main components of GC 1.
The information and options derived from this assessment formed the basic wherewithal for proceeding to the next component “the rehabilitation of coastal ecosystems and livelihoods through small grants”. In this regard, a unique approach was taken, subsequently termed “Bio-right”. This approach enabled the community (through groups or facilitated by a local NGO) to participate in ecosystem rehabilitation and at the same time have the opportunity to rebuild their livelihood through the “small grant” facility. A detailed explanation of the Bio-right approach is given in a separate chapter.
(SIMEULUE)
(NIAS)
(ACEH BARAT & NAGAN RAYA)
(PIDIE) (ACEH BESAR & BANDA ACEH)
(LHOK SEUMAWE& ACEH UTARA)
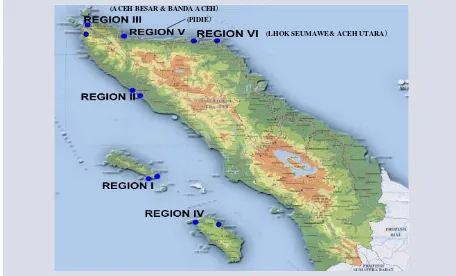
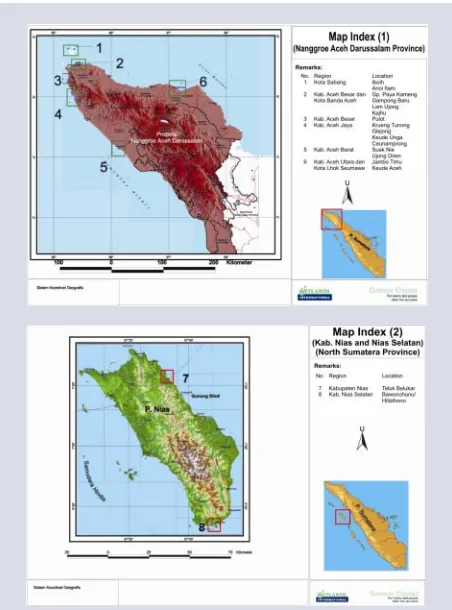
Figure 2. Sites for comprehensive assessment for “Green Coast” 2.1. COMPREHENSIVE ASSESSMENT (AUGUST – DECEMBER 2005)
The assessment was made in the area impacted by the Tsunami disaster, which covered most of the coast of NAD (east, north and west coasts), Simeleue island and Nias island in North Sumatera province. For the purposes of the assessment, this was divided into six (6) regions, as follows:
• Region I: the villages (Desa) Alus-alus and Labuhan Bakti in the Teupah Selatan
Sub-district of Simeulue District
• Region II: Desa Cot Rambong, Kuala Trang and Kuala Tuha in Kuala Sub-district of
Nagan Raya District, Desa Pucok Lueng and Lhok Bubon in Samatiga Sub-district, all in Aceh Barat District
• Region III: Desa Lham Dingin and Desa Tibang in the Syiah Kuala Sub-district of Banda
Aceh urban district; Desa Neheun and Desa Lham Nga in the Darussalam Sub-district of Aceh Besar District.
• Region IV: Desa Moawö, Desa Siheneasi and Desa Lahewa in Lahewa Sub-district,
and Desa Onolimbu in Sub-district Boawolato Sub-district, all in Nias District.
• Region V: Desa Pasi Rawa and Desa Pasi Peukan Baro in Kota Sigli Sub-district and
Desa Kupula in Simpang Tiga Sub-district, all in Pidie District.
• Region VI: two (2) districts/urban districts, which are: Kota Lhokseumawe urban
This assessment took four (4) months from August to December 2005 and was done in 4 stages as follows:
• Stage I, from 30 August to 27 September 2005, encompassing regions I to IV
• Stage II, from 22 December 2005 to 6 January 2006, to recheck and make an
addi-tional survey of the lagoon in Regions II and III
• Stage III, 24-25 September 2005, conducted by the CPSG (Campus Professional and
Scientific Group) team for the sites within region V, Kabupaten Pidie district
• Stage IV, 19-22 December 2005, covering Region VI (conducted by the Survey Team
from Unsyah, with technical support from WI-IP) for the sites in Kota Lhokseumawe urban district and Kabupaten Aceh Utara district.
In this assessment, the team collected a variety of data and field findings, and researched the potentials and other information relevant to the project. Based on the results of this assessment, the team submitted their input and recommendations to the project manager for the purpose of accomplishing activities in the field. Below are several important points made as a result of the comprehensive assessment:
a. Identification of wetlands impacted by the Tsunami
A large part of NAD’s wetlands were severely damaged. In Banda Aceh and Aceh Besar, almost all the coastal ponds (tambak) were so badly ruined that they could not be made to function again. The mangrove forest in that area suffered the same fate. On NAD’s west coast, the wetlands impacted by the Tsunami were lagoons, swamp forests, rice-fields and peat land/forest.
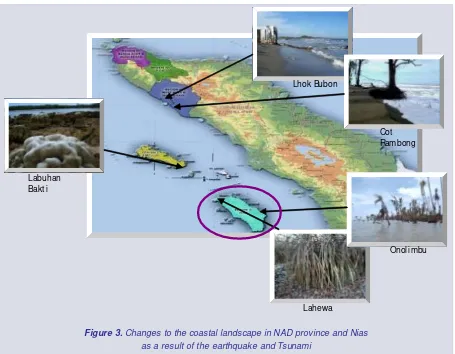
b. Changes to the coastal landscape
Figure 3. Changes to the coastal landscape in NAD province and Nias as a result of the earthquake and Tsunami
Onolimbu
Lahewa Labuhan
Bakt i
Cot Rambong Lhok Bubon
The main issues arising from these changes to the coastal landscape changes are as follow:
• The loss of mainland also means the loss of people’s land, and the process of
acquir-ing a new site as a replacement is not easy. This issue received full attention as it was a problem that GC would have to face.
• As regards land availability, this loss of terrain also means a reduction in the amount of
potential land for rehabilitation as well as livelihood development activities.
• Uplifting has increased the area of raised coastland. Field observation shows that this
appearance of new lands has potential to cause conflict of interests considering that there is as yet no clarification of its ownership status or use. This is also a matter re-quiring attention in order to prevent future problems.
• From the viewpoint of pedogenesis, this newly emerged land is still at an early stage
c. Identification of rehabilitation options for sites impacted by the Tsunami
In this assessment, the team identified a variety of prospective sites for rehabilitation with mangrove or beach plants. In Banda Aceh, Aceh Besar, Aceh Jaya, Nagan Raya and Aceh Barat, the coasts had been especially severely devastated by the direct impact of the Tsunami, whereas in Lhokseumawe and Bireun the impact had been much lighter. In Nias and Simeulue islands, however, the Tsunami had not been felt so much. On these two islands, it was land subsidence and uplifting that had caused the most damage to the coast. To identify options and sites for rehabilitation, the team carried out an in depth analysis and evaluation of the land’s carrying capacity at several locations impacted by the Tsunami. Based on this evaluation, the team identified the following options for rehabilitation:
• • • •
• Planting mangrove
This aimed to repair the mangrove forest degraded by the Tsunami, as well as several other areas suited to mangrove. The activity would comprise intensive planting and enrichment planting. Intensive planting was the alternative for rehabilitating truly devastated areas (where most of the vegetation had been lost or killed) the condition of whose substrate and hydrology was, nevertheless, suitable for mangrove. Thus, mangrove would once again grow in these areas. Enrichment planting was intended for locations where damage had been light and part of the mangrove stand still remained but biodiversity was poor.
Prospective sites for planting mangrove were:
{ Degraded mangrove lands
{ Ruined and abandoned tambak pond lands
{ Riversides
{ Along water channels/canals
{ Mudflat areas and river estuaries
• • • •
• Rehabilitation of sandy beaches
Rehabilitation of sandy beaches was by planting species of beach plants wherever possible. Nevertheless, not all parts of the beach possessed good prospects for rehabilitation. Particular sites to avoid included sandbanks and beaches periodically submerged by seawater. Rehabilitation is best done on beaches that are stable. Two types of location recommended for rehabilitation were:
{ Pes-capreae formations indicated by pioneer vegetation cover such as
Katang-Katang (Ipomea Pes-capreae) and Kacang Laut (Canavalia marina).
{ Barringtonia formations characterised by more diverse cover, not just pioneer herbs
{ Regreening around the village includes roadsides, empty public lands, and gar-dens. Species to be planted should be Multi Purpose Tree Species (MPTS) or others such as Candlenut/Kemiri (Aleurites moluccana), Belimbing Wuluh (Averhoea bilimbi) and Mango (Mangifera indica). Besides these, planting can also be directed towards species with specific aesthetic and shading functions such as Mahoni (Swietenia mahagony) and Ara (Ficus spp).
d. Options for economic activities
During the field survey, the team made an inventory of the range of economic activities pursued by the community prior to the Tsunami and evaluated the Tsunami’s impact on various types of livelihood. By combining livelihood history, prevalent conditions in the field, constraints and opportunities in the future, the team then formulated several options or recommendations for the types of livelihood that could be developed, including: fish farming, fish capture, small businesses (fish trading, etc.), animal husbandry, poultry farming, and small enterprises. Nevertheless, decisions on the choice of livelihood must be in accordance with the community’s needs, capabilities and willlingness.
2.2. COMMUNITY BASED REHABILITATION OF COASTAL ECOSYSTEMS AND LIVELIHOODS THROUGH SMALL GRANTS
The GC 1 project, which was the first phase, required several months for socialisation and coordination with stakeholders in Aceh, which included identifying and achieving cooperation with potential local partners. More thorough socialisation was carried out to ensure that the prospective local partners truly understood the Bio-right concept. Project management took this opportunity to give them (local NGOs, CBOs, and the public) the chance to develop proposals for activities which combined coastal rehabilitation and livelihoods with the Bio-right approach. The following are some of the main criteria required in proposals developed by local partners.
• The proposed site should be Tsunami-damaged coastal wetland in the NAD-Nias region
• The ecosystem rehabilitation activity proposed must combine ecosystem rehabilitation
with livelihood building
• The project does not fund ecosystem rehabilitation done through physical construction
• The project does not fund livelihood building whose implementation is not
environmen-tally friendly and is based directly on natural resources
• The institution has good credibility and strong motivation in community empowernment
• The maximum time limit for the proposed activity is one and a half years with a
Figure 4. Flow chart showing the proposal selection mechanism from submission to approval
The proposal selection process was in three stages: 1) submission of proposals to the GC project management; 2) evaluation of proposals; and 3) decision making. To ensure transparency and professionalism in the selection of proposals, the project formed an advisory committee made up of representatives from elements/institutions/organisations concerned with reconstruction and rehabilitation in NAD, who were: BRR, Panglima Laot of Aceh Province, national NGO (WALHI), Regional Environmental Impact Control Board (Bapedalda), Provincial Forestry Agency and adviser from women and gender organization.
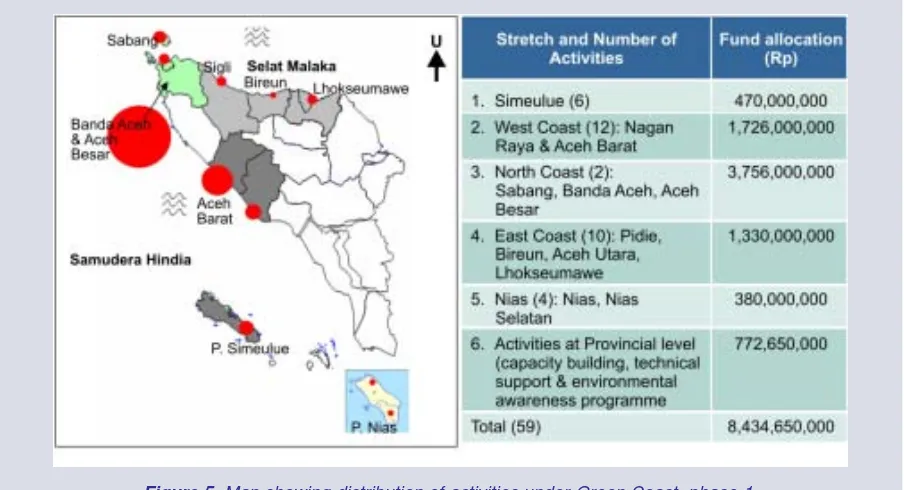
Figure 5. Map showing distribution of activities under Green Coast phase 1
(area of red circles indicates number and volume of activities in each region) and the table (right) showing the total amount of fund distributed in each region (in iDR)
a. Realisation and achievements of GC 1 – an overview
The largest volume of activities was on the north coast of Aceh, where there were 22 activities with a total allocation of IDR 3,756,000,000. Ranking second and third by volume were Aceh’s west coast (12 activities, fund allocation IDR 1,726,000,000) and east coast (10 activities, fund allocation IDR 1,330,000,000). On Pulau Simuelue island there were 6 activities with total fund allocation of IDR 470,000,000. The smallest volume was on Nias island with 4 activities and an allocation of IDR 380,000,000.
Wave 1 Wave 2 Wave 3 Wave 4 TOTAL Submitted Approved Submitted Approved Submitted Approved Submitted Approved Submitted Approved
Type A 15 9 2 1 8 4 0 - 25 14
(< IDR 5 million)
Tipe B 9 6 29 21 12 6 8 8 58 41
(IDR 50<X< 150 million)
Tipe C 0 0 12 2 7 1 1 1 20 4
(IDR 150<X< 500 million)
TOTAL 24 15 43 24 27 11 7 9 103 59
Category
The total fund distributed by GC 1 in field activities was IDR 8.43 billion. Of this, IDR 5.11 billion was used to realise the coastal rehabilitation programme, and IDR 2.56 billion to run the economic empowerment programmes. The remaining IDR 0.77 billlion was used to support capacity building and awareness raising activities.
The funds were distributed to the local partners in each stretch to achieve the target set. The size of the fund in each stretch was strongly influenced by the number of local partners involved and the condition/potential of the coast to be rehabilitated. As shown in Table 2, the funding required for ecosystem rehabilitation was greater than for livelihood activities.
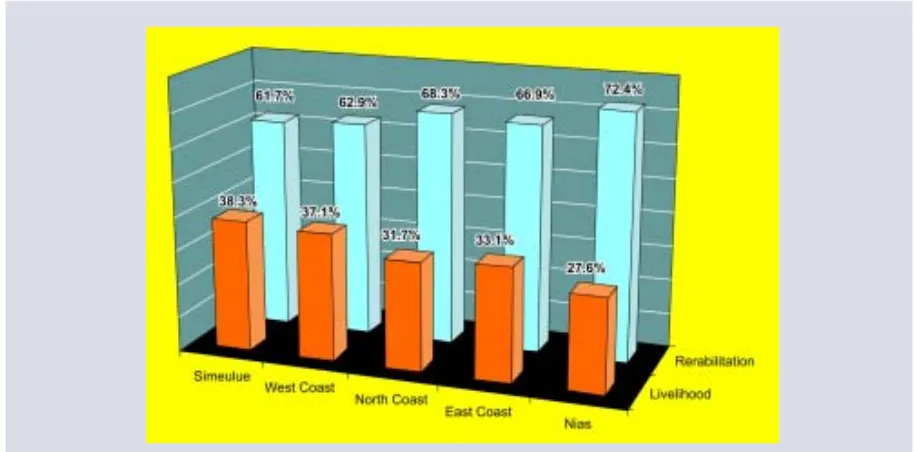
From the table above, it can be seen that the rehabilitation component required a larger portion of the funds compared to livelihood. The north coast absorbed the most funds (total IDR 3.75 billions) for both ecosystem rehabilitation (IDR 2.56 billion) and livelihood building (IDR 1.9 billion), while Nias absorbed the least: total IDR 0.38 billion with IDR 0.275 billion for rehabilitation and IDR 0.105 billion for livelihood building. The diagram below compares the budget for livelihood and rehabilitation activities for each stretch, in percentages.
Total (million rupah)
1. Simeulue 470 180 290
2. West Coast (Aceh Barat, Nagan Raya) 1.726 640 1.086 3. North Coast (Banda Aceh, Sabang, Aceh Besar) 3.756 1.191 2.565 4. East Coast (Pidie, Bireun, Aceh Utara, Lhoksemawe) 1.330 440 890
5. Nias 380 105 275
Other: Capacity building and environmental awareness 772 - -raising programmes
Total 8.434 2.556 5.106
Table 2. Distribution and allocation of funds for each stretch
The allocation is larger for ecosystem rehabilitation than for livelihood building because of the outlay required at each stage of rehabilitation, such as the costs of supplying seedlings, purchasing materials, transportation, labour, planting, fencing the plants and nursing them. For livelihood building, the allocated funds were managed directly by the group, through an internal mechanism thus enabling the members to manage the funds themselves for their own economic activity.
To support implementation in the field, the project management undertook coordination at provincial and district levels by supplying routine information on activity developments to BRR, provincial government (Pemda Tingkat I), district government (Pemda Tingkat II) and relevant government offices, in particular the district Regional Environmental Impact Management Agency (Bappedalda Kabupaten/Kota). Project management also asked the local partners to coordinate/ communicate in a similar way with the regional government in their own work area.
b. Realisation and achievements of coastal ecosystem rehabilitation activities
•
Volume of activitiesThe main form of coastal rehabilitation undertaken in the field was the planting of mangrove (see table 4) and beach plants (see table 5) like Coconut (Cocos nucifera), Sea-pine (Casuarina equisetifolia), Nyamplung (Callophyllum inophyllum) and Ketapang (Terminalia cattapa). Other forms of rehabilitation were also found, such as the designation of Marine Protected Areas (Daerah Perlindungan Laut) and facilitation of the drawing up of Rural Regulations (Peraturan Desa) to protect coastal areas.
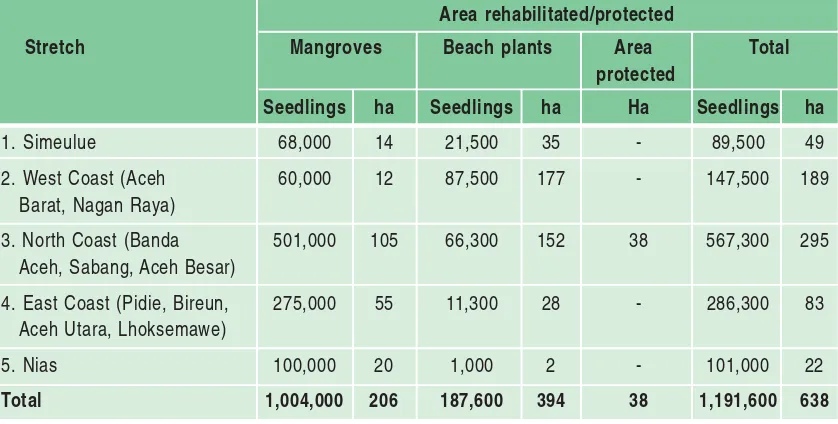
From the 59 activities implemented in Aceh and Nias during the period of GC 1, overall the project succeeded in rehabilitating a total area of 638 hectares. Of this, 206 hectares were planted with 1,004,000 mangrove seedlings and 394 hectares with 187,600 seedlings of other assorted species. In addition to planting, the local partner in Sabang also developed a policy that gave protection to 38 hectares of marine and coastal ecosystems.
Table 3. Summary of activities realised under Green Coast 1 Area rehabilitated/protected
Stretch Mangroves Beach plants Area Total
protected
Seedlings ha Seedlings ha Ha Seedlings ha
1. Simeulue 68,000 14 21,500 35 - 89,500 49 2. West Coast (Aceh 60,000 12 87,500 177 - 147,500 189 Barat, Nagan Raya)
3. North Coast (Banda 501,000 105 66,300 152 38 567,300 295 Aceh, Sabang, Aceh Besar)
4. East Coast (Pidie, Bireun, 275,000 55 11,300 28 - 286,300 83 Aceh Utara, Lhoksemawe)
5. Nias 100,000 20 1,000 2 - 101,000 22
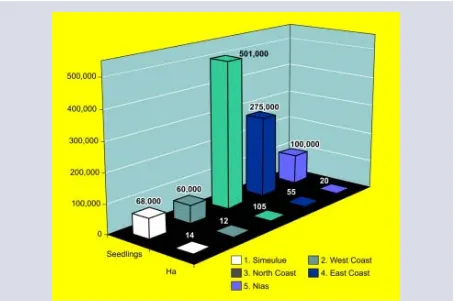
Details of mangrove planting
The largest planting of mangrove in GC 1 was on the north coast of Aceh, where 105 hectares were planted with 501,000 mangrove seedlings, constituting almost half of the total project volume for this activity. On Aceh’s east coast, 55 hectares were planted with 275,000 seedlings. On Nias island, the local partner succeeded in planting 100,000 mangrove seedlings on an area of 20 hectares. On Simuelue island and the west coast of Aceh respectively, planting was successfully carried out on 14 hectares (68,000 seedlings) and 12 hectares (60,000 seedlings).
The data above indicates a strong/close relationship between the volume of mangrove planting and the availability of land as well as the environmental carrying capacity in each region. The volume on Aceh’s north and east coasts is higher because both sites possess muddy shores and extensive tambak pond lands. In contrast, Aceh’s west coast is dominated by wide sandy shores and only a very small area is suitable for mangrove.
Most of the mangroves planted were of the species Rhizophora mucronata. This species was chosen because:
The propagules are easy to obtain
It is cheap
It is easy to handle
The chances of it growing successfully (survival rate) are high
A few local partners and villagers also had experience of planting two other species of Rhizophora (Rh. apiculata and Rh. stylosa) and some other species of mangrove such as Bruguiera gymnorrizha, Ceriops spp., Avicennia spp, Xylocarpus spp, and Sonneratia spp, even though this had been in very limited numbers. The following Table lists species of mangrove planted in the field during GC 1.
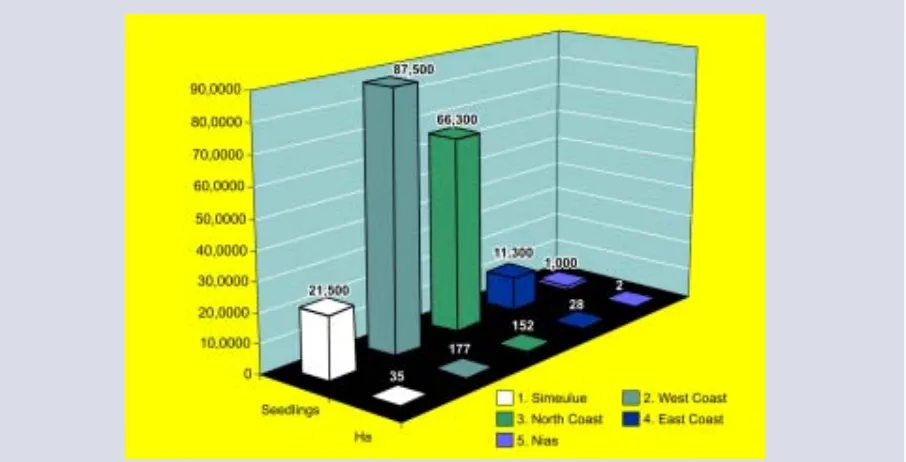
Planting of beach plants
The largest volume of sandy beach rehabilitation achieved was on the west coast of Aceh, where 177 hectares were planted with 75,500 seedlings. On the north coast, 152 hectares were planted with 66,300 seedlings. On Simeulue island, the local partner succeeded in planting 21,500 seedlings over an area of 35 hectares. On Aceh’s east coast and Nias island respectively, planting was achieved on 28 hectares (11,300 seedlings) and 2 hectares (1,000 seedlings). In general, these beach plants were spaced well apart at a distance of 3m x 5m or 5m x 5m.
Figure 8. Beach plant planting achieved (area, number of seedlings) during the period of GC 1 Table 4. Mangrove species planted during Green Coast 1
No Local name Scientific name Family Abundance
1 Bakau kecil Rhizophora apiculata Rhizophoraceae ++ 2 Bakau kecil (banci) Rhizophora stylosa Rhizophoraceae +++ 3 Bakau besar Rhizophora mucronata Rhizophoraceae +++++ 4 Tancang Bruguiera gymnorrhiza Rhizophoraceae + 5 Bogem Sonneratia sp Sonneratiaceae + 6 Api-api Avicennia sp Avicenniaceae + 7 Buta-buta Excoecaria agallocha Euphorbiacae +
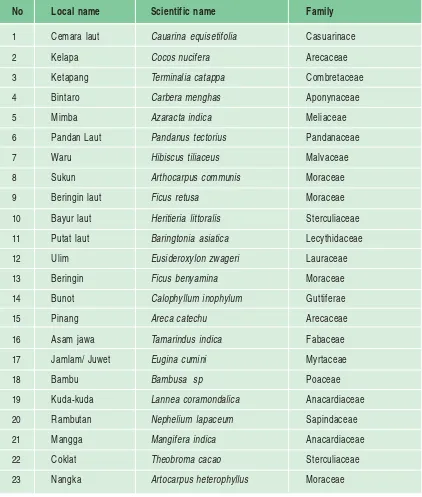
The species most frequently chosen by the local partners for sandy beach rehabilitation was the sea-pine Cemara Laut (Casuarina equisetifolia) because of its high resistance to open beach conditions, even in quite extreme conditions. Ketapang (Terminalia cattapa) and Nyamplung (Callophylum inophyllum) were also widely planted because of their pioneer characteristics, ranking as second choice after Cemara Laut. In addition to these species, the local people are very familiar with Kuda-Kuda (Lannea caromondalica) as it is easy to grow from simple stem cuttings
No Local name Scientific name Family
1 Cemara laut Cauarina equisetifolia Casuarinace
2 Kelapa Cocos nucifera Arecaceae
3 Ketapang Terminalia catappa Combretaceae
4 Bintaro Carbera menghas Aponynaceae
5 Mimba Azaracta indica Meliaceae
6 Pandan Laut Pandanus tectorius Pandanaceae
7 Waru Hibiscus tiliaceus Malvaceae
8 Sukun Arthocarpus communis Moraceae
9 Beringin laut Ficus retusa Moraceae
10 Bayur laut Heritieria littoralis Sterculiaceae
11 Putat laut Baringtonia asiatica Lecythidaceae
12 Ulim Eusideroxylon zwageri Lauraceae
13 Beringin Ficus benyamina Moraceae
14 Bunot Calophyllum inophylum Guttiferae
15 Pinang Areca catechu Arecaceae
16 Asam jawa Tamarindus indica Fabaceae
17 Jamlam/ Juwet Eugina cumini Myrtaceae
18 Bambu Bambusa sp Poaceae
19 Kuda-kuda Lannea coramondalica Anacardiaceae
20 Rambutan Nephelium lapaceum Sapindaceae
21 Mangga Mangifera indica Anacardiaceae
22 Coklat Theobroma cacao Sterculiaceae
23 Nangka Artocarpus heterophyllus Moraceae
• •• •
• Plant survival rate
The success of the rehabilitation activities in this project is indicated by the percentage growing (survival rate) in the field during the project period. This figure compares the number of surviving seedlings with the total number planted in the field. This percentage was calculated after counts were taken of the plants during monitoring and evaluation.
From field observations, it can be seen that the percentage survival rate varied from one location to another, ranging from 30% to 99%. Collective data analysis indicated that the overall average survival rate for mangrove seedlings was relatively high at 74.3%, with a slightly lower rate of 73.3% for beach plants. These values were calculated by the technical team on the basis of Monev conducted at the end of the GC 1 project, in February 2007. The table below lists the percentage survival rates derived from the technical team’s monitoring.
% Survival
No Stretch /Local partners Beach
plants
A Simeulue
1 Yayasan Bangkit Simeulue (YBS), Simeulue - 70 2 Kelompok Tani Alafan Bahari, Simeulue - 70 3 Kelompok Tani Pantai Sibinuang - 70 4 Yayasan Manjago Vano, Simeulue 70
5 Yayasan Simeulue Lestari - 20
6 Kelompok Tani Penghijauan Pantai Samotalindungi 70
B West Coast
7 Pusat Pengembangan Potensi Pesisir dan Lautan, P4L, Meulaboh - 75 8 Forum Komunikasi Generasi Muda Aceh Barat, FK-GEMAB, Meulaboh - 75 9 Yayasan Peduli Lingkungan, YPL, Meulaboh - 90 10 Yayasan Pekat Indonesia (Pekat), Nagan Raya - 75 11 Lembaga Ekonomi Masyarakat (LEM) Maju Bersama , Aceh Barat - 95 12 Lembaga Ekonomi Masyarakat (LEM), Suak Seukee, Aceh Barat - 75 13 Lembaga Ekonomi Masyarakat (LEM) Ingin Makmur, Aceh Barat - 90 14 Aceh Partnership Foundation, APF, Banda Aceh - 75 15 Yayasan Pembela Petani dan Nelayan (PAPAN), Meulaboh 20 20 16 JIKMTs Kecamatan Kuala Kabupupaten Nagan Raya - 92 17 LEM Karya Mandiri Desa Suak Panteubreuh Kec. Samatiga Kab. Aceh Barat - 95 18 LEM Karya Tabina Desa Kampong Cot Kecamatan Samatiga - 95
Kabupaten Aceh Barat
19 Yayasan Gajah Sumatera (YaGaSu), Banda Aceh 90
-Table 6. Percentage survival rates from rehabilitation activities during GC 1
% Survival
No Stretch/ /Local partners Beach
plants
C North Coast
20 UKM MIPRO Fakultas Kedokteran Hewan Unsyiah 50 75
21 Yayasan Gajah Sumatera (YaGaSu), Banda Aceh 90
-22 KSM TUANKU, Banda Aceh - 90
23 Yayasan Karya Bersama (Yasma), Banda Aceh 80 80 24 Yayasan Hijau Semesta (YHS), Banda Aceh 70 70 25 Pemerintah Desa Kajhu, Aceh Besar 75 95 26 Yayasan HIKMAH, Kuta Alam Banda Aceh 0
-27 Yayasan Lahan Ekosistem Basah (Lebah) 99 80 28 Kelompok Masyarakat Kecamatan Pulo Aceh Kabupaten Aceh Besar - -29 Lembaga Hukum Adat Laot/ Panglima Laot Aceh 60 60 30 Lembaga Hukum Adat Laot/ Panglima Laot Aceh 60 60 31 KM Dusun UjungBlang Desa Lam Ujung Kecamatan Baitusasalam 80 -32 KM Dusun Deungah Desa Lam Ujung Kecamatan Baitusasalam 90
-33 LPPMA, Banda Aceh 90 75
34 WI-IP, Aceh Nias Representative Office 80 80 35 Fasilitator Dusun Ule Jalan Desa Lam Ujong Kecamatan Baitussalam” 90 -36 Fasilitator Dusun Ujung Blang Desa Lam Ujong Kecamatan Baitussalam 90
-37 Lhok Nga Community Group - 60
38 Yayasan Peduli Sabang, Sabang 70 50
39 Yayasan PUGAR - 72
40 Aceh Coral Conservation, Sabang -
-D East Coast
41 Campus Professional and Scientific Group (CPSG), Banda Aceh 80 80
42 Citra Desa, CDI, Sigli 80 0
43 Kelompok Masyarakat Kecamatan Muara Tiga Pidie, Pidie 0
-44 Jaringan Aliansi Ekonomi Pendidikan dan Lingkungan Hidup (JADUP), Bireun 17 80 45 Lembaga Informasi Masyarakat Independent (LIMID), Lhokseumawe 90 -46 Lembaga Informasi Masyarakat Independent (LIMID) 90 -47 Lembaga Pembela Lingkungan Hidup (LPLHa), Lhoksemawe 75 -48 Lembaga Pembelaan Lingkungan dan Hak Azasi Manusia (LPLHa) 75 -49 Aceh Partnership Foundation (APF) 75 -50 Yayasan Gajah Sumfedra, Banda Aceh (YaGaSu) 50
-51 Yayasan Holi’ Ana’a, Nias 50
-E Nias
52 Lembaga Pengelola Sumberdaya Terumbu Karang (LPS-TK) Muawo, Nias 70 -53 Lembaga Pengelola Sumberdaya Terumbu Karang (LPS-TK) Sawo, Nias 70 -54 Lembaga Pengembangan Pesisir, Pulau-pulau Kecil dan Laut, Nias 70
-Notes:
c. Realisation and achievements of livelihood recovery activities
Prior to the Tsunami, the coastal people had pursued a wide variety of livelihoods, from marine-based activities such as capture fishery, intertidal activities such as net-fishing, shellfish harvesting, aquaculture tambak ponds, agriculture and salt production, to land-based activities like agriculture in the foothills and the gathering of wood and non-timber natural resources (e.g. rattan). This variety of livelihoods was closely linked to the variety of natural conditions and topography of NAD’s coast, from the ocean to the sloping coastline, to the hills behind the settlements. This combination of landscapes is clearly seen in the Sub-district Jaya sub-district of Kabupaten Aceh Jaya sub-district and in the area around Pelabuhan Malahayati harbour in Kabupaten Aceh Besar district.
Due to this variety in the coastal topography, local conditions and seasonal variation, the coastal communities of Aceh tend not to be tied to just one type of livelihood. In general, each family has one primary livelihood plus other additional income generating activities. According to the findings of the economic assessment, fishing at sea was the main economic activity for most of Aceh’s coastal communities, while agriculture and animal husbandry were additional to this. At family level there was division of labour. The husband usually went to sea and his wife managed the fields and/or livestock. At certain times in the farming cycle, the husband played a major role in land clearing, planting and harvesting. The combination of tambak aquaculture and sea-fishing was rare, because aquaculture requires an intensive allocation of time. A promising daily source of additional income for tambak fish farmers was the harvesting of mangrove crabs and wild shrimps.
GC 1 has facilitated several activities to rebuild livelihoods. According to the results from analysis and routine monitoring during the project, the activities carried out by all the local partners during phase 1 of the project have benefited at least 43,000 people in the regions covered by the project. The types of economic activity developed were matched to the needs of each region; examples include horticulture in Aceh Barat, marine fishing in Simeulue, Banda Aceh and Aceh Besar, fresh and brackish water fisheries in Banda Aceh, Aceh Besar, the east coast and Nias, and cattle and goat farming in almost all regions.
• Capital Management and Type of Business
The allocation of funds from the total contract budget was in the following proportions: maximum 30% for rehabilitation activity, minimum 40% for livelihood and maximum 30% for institutional management. The exception was for type C, where the proportion for institutional management was maximum 25% and livelihood 45%. As regards activity development, the management of business capital varied from one group to another. This was based on the agreement reached between the group and the facilitator. Four models of business capital management were identified as being in use by project partners:
Model 1 : The business capital is managed by individuals and does not revolve
Model 2 : The business capital is managed jointly by the individuals within the group and does not revolve.
Model 3 : The business capital is managed by individuals and revolves to non
group members.
Model 4 : The business capital is divided into two types of management,
combin-ing models 2 and 3.
Monitoring in the field revealed that the most common form of capital management was jointly managed by the individuals within the group (Model 2) and the fund was non-revolving (46%). This model was commonly practised by CBOs in Simeulue who developed cattle farming together and purchased a sampan boat plus motor, CBOs in Aceh Barat who developed cattle and goat farming directly by the group, and a women’s Tsunami victims group mentored by Yagasu (Yayasan Gajah Sumatera). 32% of partners applied model 1, in which business capital is managed by individuals and not rotated. Only a few rotated the business capital (Model 3); these included activities facilitated by the local NGO LPPMA and the foundation Yayasan LEBAH. The table below shows the proportion of Green Coast partners applying each model of business capital management.
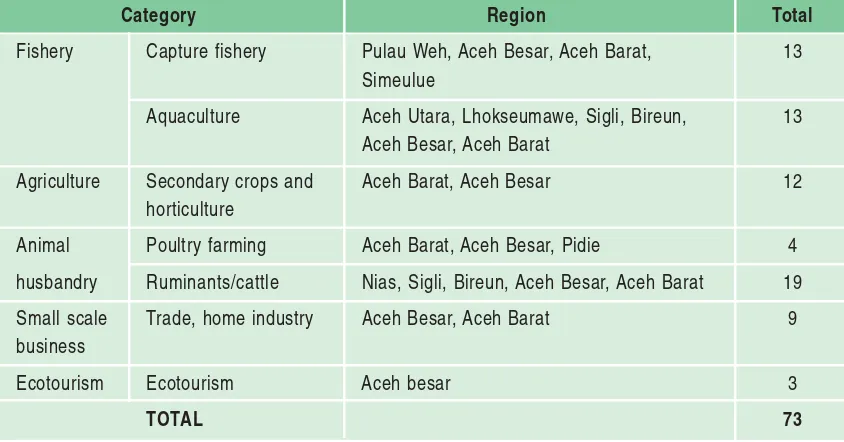
Through monitoring, the team identified 73 unit economic activities facilitated through the Small Grant Facility. These were divided into five main categories: 1) fisheries, covering capture fishery and aquaculture, 2) Agriculture, covering horticulture and secondary crops, 3) animal husbandry, comprising poultry and ruminants, 4) small scale business such as trading, sewing, tempe production, and 5) ecotourism. The table below presents the types of activity and their percentage developed by Green Coast partners in the field.
Table 7. Percentage of GC partners applying each type of business capital management
Model of Business Capital Management Number Percentage
Model 1 19 32
Model 2 27 46
Model 3 6 10
Model 4 2 3
Not developed livelihood activities 5 9
Figure 9. Percentages for choices of livelihoods developed in GC 1
From table 8 above and figure 9 below, we can see that the livelihood most commonly developed by these communities was the farming of mammals (26%), comprising goats, cows, buffalo and pigs. Next came capture fishery and aquaculture (18% each). Capture fishery is fishing in the open sea, while aquaculture is fishery on land as in the culture of shrimps and milkfish in ponds. Agriculture and small scale business ranked third and fourth at 16% and 12 % respectively. The most commonly chosen type of agriculture was the growing of secondary crops and horticulture, while the most popular small scale businesses were trading, dressmaking and the production of tempe soybean cakes. The smallest percentages were for poultry farming (5%) and ecotourism (4%).
Table 8. Livelihoods developed by Green Coast 1
Category Region Total
Fishery Capture fishery Pulau Weh, Aceh Besar, Aceh Barat, 13 Simeulue
Aquaculture Aceh Utara, Lhokseumawe, Sigli, Bireun, 13 Aceh Besar, Aceh Barat
Agriculture Secondary crops and Aceh Barat, Aceh Besar 12 horticulture
Animal Poultry farming Aceh Barat, Aceh Besar, Pidie 4 husbandry Ruminants/cattle Nias, Sigli, Bireun, Aceh Besar, Aceh Barat 19 Small scale Trade, home industry Aceh Besar, Aceh Barat 9 business
Ecotourism Ecotourism Aceh besar 3
Figure 10. Fruit cracker production(left) and Souvenir shop (right) at Sultan Iskandar Muda airport (Banda Aceh) by the Tibang women’s group, facilitated by YAGASU
Realization and Achievements of
Green Coast 2
3
In April 2007, Oxfam/NOVIB approved additional funding to extend the Green Coast activities in Aceh until December 2008. This extension was termed Green Coast phase 2 (GC 2). With subsequent developments this was further extended until March 2009. Besides enhancing performance and quality of activities in the field, GC 2 also focused on the formation of a number of demo sites which, it is hoped, will demonstrate a number of options and alternatives for integrated, sustainable management of coastal ecosystems (see annex 1 and 2). This also has the mission to reduce/overcome further coastal degradation. As in phase 1, the activities in phase 2 in Aceh Province and Nias island have been implemented together by WI-IP and WWF Indonesia. In this phase, the project wishes to achieve three particular targets, which are:
• To improve the resilience of coastal ecosystems and the sustainability of community
livelihoods in Aceh through the formation of 16 demo sites (however only 11 sites were appropriate as demosites) in the coastal areas of Aceh and Nias. This is intended to provide tangible benefit to the local communities through the rehabilitation of livelihoods and coastal ecosystems. The rehabilitation activities are also hoped to enhance the func-tion of the buffer zone in coastal areas.
• o prevent further environmental degradation as an impact of the rehabilitation and
recon-struction would also colour the implementation of phase 2. Input would also be given to technical design and activity development to avoid any negative impact from reha-bilitation and reconstruction activity in NAD province and Nias island.
• To disseminate documents on the experience and lessons learnt and Best Management
Practice from the rehabilitation activities carried out in the Green Coast project.
The strategies and approach employed in the implementation of GC 2 in the field were similar to those in phase 1. Guided by previous experience, several improvements were made in phase 2.
3.1. ENVIRONMENTAL AND SOCIAL- ECONOMY ASSESSMENT
In phase 1, the survey had been conducted over a wide area with top priority being given to assessing the impact of the Tsunami. The Environmental and Social-Economy assessment in phase 2 was focused more on current conditions and was related to the plans for implementing phase 2 of the project. Most of the sites surveyed were sites actually intended for project activity, particularly ecosystem rehabilitation. As there was no partner on Pulau Simeulue, the phase 2 comprehensive assessment was not conducted on this island. The assessment was therefore centred on four regions, as follows:
• Region I West coast of NAD : Pulot village in Leupung Sub-district of Aceh Besar
dis-trict, Suak Nie village in Johan Pahlawan Sub-disdis-trict, Ujong Drien village in Meurebo Sub-district both are in Aceh Barat district, four villages in Aceh Jaya district Sub dis-trict of Jaya (Gle Jong, Ceunamprong, Keude Unga and Kreung Tunong)
• Region II North coast of NAD : Kajhu and Lam Ujong village in Baitussalam
Sub-dis-trict, Gampong Baru and Paya Kameng village in Masjid Raya Sub-disSub-dis-trict, all in Aceh Besar district
• Region III Weh Island (Sabang urban district): Anoi Itam village in Sukajaya
Sub-dis-trict, Iboih village in Sukakarya sub-disSub-dis-trict, all in Sabang urban district
• Region IV Nias Island : Teluk Belukar village in Gunung Sitoli Utara Sub-district, Nias
district, and two villages (Bawonahono and Hilizihono) in Teluk Dalam Sub-district, of Nias Selatan district
3.2. COMMUNITY BASED REHABILITATION OF COASTAL ECOSYSTEMS AND LIVELIHOODS THROUGH THE SMALL GRANT FACILITY
This time, GC 2 did not need to allocate time specifically for socialisation of the concept and approach used. Throughout GC 1, these had become widely known by Aceh’s coastal communities and by other stakeholders. Several parties had openly given a positive response to the strategy, approach and concept of GC which, they judged, could answer the challenges and constraints faced by the people and the environment.
Table 9. Local partners for Green Coast Phase 2
Project Code
East 1 Kedue Aceh Village, Muara Dua, Lhokseumawe LIMID, LPLHA ID2-B-09-01
Coast Municipalapity
2 Jambo Timur Village, Blang Mangat Sub-district, APF ID2-B-09-02 Lhokseumawe Municipalapity
North 3 Gampong Paya Kameng, Masjid Raya Sub-district, LPPMA ID2-A-02-03
Coast Aceh Besar
4 Sabang/Weh Island PUGAR, YPS, ACC ID2-B-02-04 5 Kajhu Village, Baitussalam Sub-district, LEBAH ID2-C02-05
Aceh Besar
6 Lam Ujong Village, Baitussalam Sub-district, ID2-B-02-06
Aceh Besar WI-IP
7 Gampong Baru Village, Masjid Raya Sub-district , CBO (facilitated ID2-B-02-07
Aceh Besar by WI-IP)*
8 Pulot Lagoon, Laupung Sub-district , Aceh Besar CBO (facilitated ID2-B-02-07 by WI-IP) ID2-A-02-08
West 9 Lagoon Krueng Tunong, Jaya Sub-district , Mitra Bahari ** ID2-C-03-09
Coast Aceh Jaya District
10 Kedue Unga Village, Jaya Sub-district, Aceh Jaya District Mitra Bahari ** ID2-C-03-10 11 Ceunamprong, Jaya Sub-district, Aceh Jaya District Mitra Bahari ** ID2-B-03-11 12 Gle Jong Village, Jaya Sub-district, Aceh Jaya District Mitra Bahari ** ID2-B-03-12 13 Suak Raya Village, Johan Pahlawan Sub-district , FK-GEMAB ID2-B-04-13
Aceh Barat
14 Ujong Drien Village, Meurebo Sub-district , P4L ID2-B-04-14 Aceh Barat
Nias 15 Teluk Belukar Village, Gunungsitoli Utara Sub-district WI-IP & ID2-C-10-15
Nias Wahana Lestari
16 Bawonahono and Hilizihono Village, Teluk Dalam P4KL ID2-B-10-16 Sub-district, Nias Selatan
Notes : *) new partners in GC 2 (not involved under GC-1) **) Yayasan Mitra Bahari is an NGO based in Pemalang-Central Java, the individuals involvement of this NGO as facilitators in the GC project in Aceh were due to their success story in implementing Bio-rights in Indonesia. This NGO was not invoved under the GC1.