Abstract—Computer Mediated Communication (CMC) platforms are incorporated in e-learning systems to actualize effective learning activities. Visualization techniques are been used to communicate the unstructured complex dataset of learners’ activities in the log files to the actors. The effectiveness of this approach as bases for teaching-learning support and learning analytics however relies on the commitment of the teacher. The teacher being human can become overwhelmed when the enrolment is large and/or when the Internet access is a problem. This paper presents a technique for capturing the teacher’s knowledge for monitoring learners’ activities in Neuro-fuzzy model for online automatic monitoring. The model intelligently provides inbuilt competence assessment and promptly takes decisions. The IEEE-LTSA is modified to reflect the initiative. Similarly, the integration of the model in an architecture based on Actuator- Indicator Models was demonstrated.
Index Terms—Actuator-indicator model, learning activities, log file visualization and neuro-fuzzy model.
I. INTRODUCTION
Most Learning Management Systems (LMS) adopt Socio – Constructivism Pedagogy as an approach to implement learning activities. Learning activities in [1] is a triple containing the contents, the actors and the corresponding interactions. Realizing the importance of interactions, LMS such as BlackBoard, LAMS and Moodle among others, incorporate Computer Mediated Communication (CMC) Platforms such as Forum, Chat and Wiki in the list of Resources/Activities for instruction design. CMC plays complementary roles for the unidirectional content-centric models in the IEEE-LTSA standard. They also compensate the lack of face to face interactions in e-learning systems [2]. LMS maintain activities log files for storing users‟ traces. The existing built-in students tracking functionalities in most LMS are largely far from being satisfactory [3]-[5].
Presentation or visualization techniques such as charts, graphs, gauges and maps [6] are being used to enhance the usability of log file data. These approaches as demonstrated in [7] and [8], extracts and presents LMS information in dashboard like interface. Dashboard methods were however criticized for timeliness, accuracy and usefulness by [9]. Statistical data in tabular format was proposed as alternative indicator in [10]. These efforts are meant to elicit the
Manuscript received June 30, 2013; revised August 3, 2013.
E. O. Omidiora, S. O. Olabiyisi, and O. O. Okediran are with the Department of Computer Science and Engineering, Ladoke Akintola University of Technnology, Ogbomosho, Nigeria. (e-mail: [email protected], [email protected], [email protected]).
R. M. Isiaka is with the Kwara State University, Malete, Nigeria (e-mail: [email protected]).
potentials of log file data as bases for teaching/learning competence assessment, learning analytics and support [11]. Furthermore, learning activities monitoring is essential because it can be used as a measure of formal experiences acquired in a subject area. Formal experience according to [12] is the only basis for expected formal knowledge.
The quality of support possible in visualization approach relies on the commitments of the teacher to personally view, assess and take decisions. The teacher‟s commitments and efficiency are functions of the size of class enrolments, availability and quality of Internet access. The teacher would be overwhelmed if the class enrolment is very large and/or when the internet access is a challenge.
The crux of this paper is to presents a technique for capturing the teacher‟s knowledge for monitoring learners‟ activities in Neuro-fuzzy model. The model intelligently provides inbuilt competence assessment and promptly takes appropriate decisions. A four-layer feed forward Neuro-fuzzy model is used to handle the response section of the Actuator- Indicator Models which formed the bases for the system architecture.
Actuator-Indicator Models is a generic system architecture developed by [13]. It provides guidelines for implementing learning assessment and learning support services. The original model according to [11] has been extended. The extension was done with the concept of motivational research; it has been applied to different areas of Technology Enhanced Learning (TEL). The four functional layers of the architecture are sensor layer, semantic layer, control layer and indicator layer. The architecture for activity- based learner model in [11] was also based on the Actuator-Indicator Models.
Section II of this paper discusses the modifications made to IEEE-LTSA to accommodate CMC based interactivity and competence analysis before the summative evaluation. Section III demonstrates the implementation of the Actuator- Indicator Models using a four-layer Neuro-fuzzy model. Section IV explains the detail design of the Neuro-fuzzy model. Section V is the conclusion where planned future research on the subject matter was mentioned.
II. ADAPTABILITY OF IEEE-LTSA MODEL
The IEEE-LTSA articulates the functional components for a standard e-learning system and thereby provides a very clear fundamental architecture for e-learning system. However, it is a content-centric model with unidirectional flow of information to the learner. The model in its original form would not be adequate for activity driven e-learning system. To reflect the activity driven and the diagnostic evaluation initiatives, the IEEE-LTSA is modified as shown
Learner Activities Evaluation Model: A Neuro-Fuzzy
Approach
E. O. Omidiora, S. O. Olabiyisi, O. O. Okediran, and R. M. Isiaka
International Journal of e-Education, e-Business, e-Management and e-Learning, Vol. 3, No. 5, October 2013
421
in Fig. 1. The figure indicates adoption of three processes (Delivery, Learner and Summative Evaluation) and the Actor process is adapted as the Diagnostic Evaluation process. The two stores (Learning resources and Learner records) are adapted as Local Lesson Repository and Learner Profiles respectively. Lesson in this context refer to packaged learning design or a unit of learning. Some of the flows in IEEE-LTSA were also adapted to reflect the new initiative. Prominent is the two sided arrow multimedia information flow, which indicates flow of information to and from the learner. Furthermore, the learner's behaviour is being tracked by the Diagnostic Evaluation Process. At this point, the learner's performance is compared with the tutors thresholds and conditions specified in the Neuro-Fuzzy models. If the learner has performed satisfactorily, the system will classify the learner as „ready‟ and grant privilege for summative evaluation to the learner. Otherwise, the learner will be redirected to repeat the class. Simultaneously, the initiated learners profile at the point of registration will be updated through learner's activities log.
Fig. 1. Adapted IEEE-L TSA model for learner activity monitoring.
III. NEURO-FUZZY, ACTUATOR- INDICATOR MODELS INTEGRATION
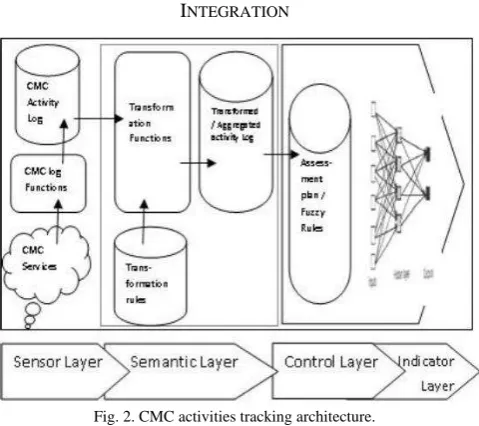
Fig. 2. CMC activities tracking architecture.
The detail process required for monitoring learner activities on a CMC via LMS can be captured in the four
layers of the Actuator-Indicator Models. The four layers can be categorizes into Monitoring/Assessment and Response parts. The former comprises of the sensor and semantic layers while the later part is made up of the control and indicator layers. Fig. 2 extends the architecture in [11] by implementing the response part (control and indicator layers) using a four-layer feed forward Neuro-fuzzy model.
The responsibility of sensor layer in Fig. 2 above is to capture and store all user information and behaviour into the Activity – log table in a predefined format. Little or no work will be required to implement this layer. This is because most CMC already have inbuilt mechanism for handling the Function of sensor layer. The semantic layer however will transforms the complex log file dataset to a more structured and meaningful equivalent dataset. This process requires specification of the transformation rules by the teacher to serve as heuristics for generating dataset that meets the intended goal. The control and indicator layer are implemented using the synergy of the training capability of Neural Networks and Fuzzy Logic mechanism. However, depending on the learning goal, the teacher would need to specify the assessment plans and the fuzzy rule on which the network would be trained.
THE NEURO- MODEL FOR LEARNERS ACTIVITY MONITORING
As a case study, tracking and measuring quality of learners‟ activities is considered. The goal is envisioned to be realistic if it is captured as Exploration and Concentration. These two features are 'low bandwidth' features, in that they do not readily make required amount of information available. To this end, features must be built deliberately into the learning resources that could be used to track the two attributes during the learning process. Actualizing this model require building the Fuzzy parameter and further fuzzification of the Neural Networks. Details of the two stages involved are discussed as follows.
A. The Fuzzification
The four steps approach adopted at this stage are defining the input / output values, defining fuzzy sets for input values and defining fuzzy rules. The fourth step is the construction and training of the developed Neuro-Fuzzy model as discussed in part B below.
Summarily, the input is described as:
N = 2 = {N1, N2} = {Exploration, Concentration}, where
N1 (Exploration) = {B1, B2} = {total time spent reading,
content completion status} and
N2 (Concentration) = {B3, B4} = {the attention level,
diagnosis assessment remarks}.
Model Term set where T(B1) = {total time spent reading 1f1 = 3
linguistic values,
T(B2) = {content completion status 2f2 = 2
linguistic values,
T(B3) = {the attention level 3f3 = 3
linguistic values and
T(B4) = {diagnosis assessmentremarks} = {U, S} = B4f4 =
2 linguistic values.
International Journal of e-Education, e-Business, e-Management and e-Learning, Vol. 3, No. 5, October 2013
422
F
IV. UZZY
Hence, the model‟s term set
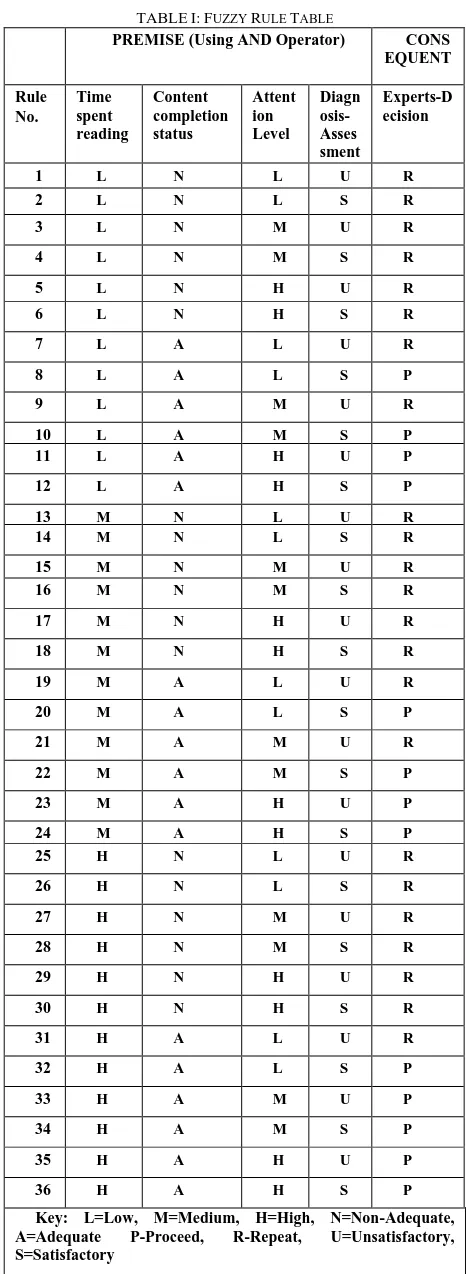
All the possible combinations of the basic linguistic variable are visualized in Decision Tree. From it, all the premises are harmonized to form a Fuzzy Rule table. An expert is consulted to fix the consequents. Table I summarizes the Fuzzy rules.
B. The Fussed Neural Network
The approach for this model is a connectionist network in the Hybrid/Fussed Neuro-Fuzzy System. It is a fuzzed neural network built on four layer model of Input, Fuzzification, Premise and Output layers. The principles used for each stage of the model are the number of cells in the input layer is equal to the number of input values, the number of cells in the fuzzification layer is equal to the number of fuzzy set, the number of cells in the premise layer is equal to the number of rules and the number of cell in the output layer is equal to the number of classification. Below in Fig. 3 is network.
The model is four-layer feedforward network architecture. The output of layer1 can be given as
(1) The Fuzzification layer (L2) has node for every categories of expert's description and classification for each of the variables. Sigmoid transfer function is used for determine each node
(2)
where x is the crisp input and An is the linguistic label.
The Membership function for
(3)
The output of every node is the membership degree of the input to each of the fuzzy set. A fixed connection weight of one (1) exists between layer 1 and layer 2. Layer 2 feeds layer 3; layer (L3) calculates the activation of premises of the fuzzy rules. It uses Minimum type t-norm to implement AND operators in each of the units. Each unit in this layer corresponds to a fuzzy rule in the system. The connection weights between layer3 and layer4 are changed or adjusted by training the network using least mean squares algorithm, given as
(4)
Fig. 3. The neuro-fuzzy model for student exploration and concentration.
TABLEI:FUZZY RULE TABLE
PREMISE (Using AND Operator) CONS
EQUENT
Rule No.
Time spent reading
Content completion status
Attent ion Level
Diagn osis-Asses sment
Experts-D ecision
1 L N L U R
2 L N L S R
3 L N M U R
4 L N M S R
5 L N H U R
6 L N H S R
7 L A L U R
8 L A L S P
9 L A M U R
10 L A M S P
11 L A H U P
12 L A H S P
13 M N L U R
14 M N L S R
15 M N M U R
16 M N M S R
17 M N H U R
18 M N H S R
19 M A L U R
20 M A L S P
21 M A M U R
22 M A M S P
23 M A H U P
24 M A H S P
25 H N L U R
26 H N L S R
27 H N M U R
28 H N M S R
29 H N H U R
30 H N H S R
31 H A L U R
32 H A L S P
33 H A M U P
34 H A M S P
35 H A H U P
36 H A H S P
Key: L=Low, M=Medium, H=High, N=Non-Adequate,
A=Adequate P-Proceed, R-Repeat, U=Unsatisfactory,
S=Satisfactory
V. CONCLUSION
The Neuro-Fuzzy model is being simulated in MATLAB 7.0 Toolbox environment. After it has been adjudged to be satisfactory, it will be integrated into Moodle LMS for implementation. A lesson will be constructed; transformation rule and assessment plan will be set. Finally, students will be International Journal of e-Education, e-Business, e-Management and e-Learning, Vol. 3, No. 5, October 2013
423
enrolled and their activities automatically monitored. The hope is that, the proposed approach will alleviate the problems of timeliness, accuracy and reliance on the commitment of the human teacher associated with visualization approaches.
REFERENCES
[1] P. Karampiperis and D. Sampson, "Towards next generation activity-based learning systems," presented at 5th IEEE International Conference on advanced Learning Technologies, Kaohsiung, Taiwan, 2005.
[2] M. May and S. George, “Using learning tracking data to support student‟s self monitoring,” in Proc. 3rd
International Conference on Computer Supported Education, France, pp.46-55, 2011.
[3] R. Hijon and R. Carlos, “E-learning platforms analysis and development of students tracking functionality,” in Proc. the 18th World Conference on Educational Multimedia, Hypermedia & Telecommunications, pp. 2823-2828, 2006.
[4] M. Z. Nor Azan and S. Y. Wong, “Learning activities management system,” in Proc. International Conference on Electrical Engineering and Informatics, Institut Teknologi Bandung, Indonesia, pp. 488-491, 2007
[5] C. John, S. Judy, and T. Grant, “WAT- a tool for classifying learning activities from a log file,” presented at 9th Australasian Computing Education Conference, Ballarat, Victoria, Australia, 2007.
[6] R. S. Baker and A. M. de Carvalho, “labeling student behaviour faster and more precisely with text replays,” in Proc. 1st international Conference on Educational Data Mining, pp. 38-47, 2008.
[7] K. E. Arnold. Signals: Applying academic analysis. Educause Quarterly. [Online]. 33(1). Available: http://www.educause.edu/ EDUCAUSE+Quarterly
[8] H. Zhang and K. Almeroth, “Moodog: Tracking students‟ online
learning activities,” in Proc. World Conference on Educational
Multimedia, Hypermedia and Telecommunications, Chesapeake, VA: AACE, pp. 4415-4422, 2007.
[9] S. Few. Dashboard confusion revisited. Visual Business intelligence
Newsletter. [Online]. Available:
http://www.Perceptualedge.com/0322-07, 2007.
[10] M. May, S. George, and P. Prevot, “Analysing, and visualisizing
learner‟s activities on discussion forum,” IASTED International
Conference on Web-based Education (WBE 2007), Chamonix, France, pp. 649-656, 2007
[11] B. Florian, C. Glahn, H. Drachsler, M. Specht, and R. Fabregat,
“Activity-based learner-models for learner monitoring and
recommendations in moodle,” Towards Ubiquitous Learning: Lecture
Notes in Computer Science, vol. 6964, pp. 111-124, 2011.
[12] Z. Sun and G. Finnie. Experience management in knowledge management. Information Technology papers. [Online]. Available: http://epublications.bond.edu.au/ infotech_pubs/103, 2005.
[13] A. Zimmermann, M. Specht, and A. Lorenz, “Personalization and
context management,” User Modeling and User-Adapted Interaction,
vol. 15, pp. 275-302, 2005.
E. O. Omidiora
Department of Computer Science and Engineering, Ladoke Akintola University of Technology, Ogbomoso, Nigeria. He graduated with B.Sc. Computer Engineering (1991) from Obafemi Awolowo University, Ile-Ife, Nigeria. He bagged M.Sc. Computer Science from University of Lagos, Nigeria (1998) and Ph.D Computer Science from Ladoke Akintola University of Technology (2006). He has published in reputable journals and learned conferences. His research interests include: The study of Biometric Systems, Computational Complexity measures and Soft Computing. He belongs to the following professional bodies: Full Member, Computer Professionals (Registration) Council of Nigeria; Corporate Member, Nigeria Society of Engineers; Register Engineer, COREN.
S. O. Olabiyisi received B. Tech., M. Tech and Ph.D degrees in Mathematics from Ladoke Akintola University of Technology, Ogbomoso, Nigeria, in 1999, 2002 and 2006 respectively. He also received M.Sc. degree in Computer Science from University of Ibadan, Ibadan, Nigeria in 2003. He is currently an Associate Professor in the Department of Computer Science and Engineering, Ladoke Akintola University of Technology, Ogbomoso, Nigeria. He has published in reputable journals and learned conferences. Dr Olabiyisi is a member of Computer Professional (Registration) Council of Nigeria (CPN). His research interests are in Computational Mathematics, Computational Complexity, Theoretical Computer Science, Simulation and Performance Evaluation.
R.M. Isiaka is a PhD Student in the Department of Computer Science and Engineering, Ladoke Akintola University of Technnology, Ogbomosho, Nigeria. He is a lecturer in the Department of Computer, Library and Information Science, Kwara State University, Malete, Ilorin, Nigeria. His research interests include Soft Computing, Adaptive E-learning, Learning Analytics, Database Management and Information Security. He is a member of both Computer Professionals (Registration) Council of Nigeria (MCPN) and Nigeria Computer Society (NCS).
International Journal of e-Education, e-Business, e-Management and e-Learning, Vol. 3, No. 5, October 2013
424
is currently a professor in the