Rinabi Tanamal Tony Antonio
Abstrak
Facing MEA or AEC, small medium business in these ASEAN countries member are now facing competition among itself. The Organisations need to adopt new technologies where resources are limited, limited on knowledge, so organisation need to be innovative and creative or they will perish if nothing to be improved. This study emphasize on the importance of SME (Small Medium Enterprise) in Surabaya city region and the analyses combining the TAM Model, TOE Framework as well as two sample test on 246 respondent especially on using The Internet Technology. The conclusions created further study on environment context and other technology adoption by SME.
Kata Kunci :Small Medium Business, MEA, TOE Framework, TAM Model, Two sample T Test, Internet Technology Adoption.
1. Introduction
Nowaday an IT (Information Technology) performs significantly on improving ability for an enterprises to survive in the highly competitive global marketplace. As the use of Technology increase may also be followed by the Growth of Internet User. Following the easy access, faster, and cheaper Internet, Small Medium Businesses begin to utilize it. From previous study it says SMEs play a vital role in the community of Asean countries, accounting for 89-99% of all enterprises in the Member States, creating 52-97% of employment, contributing 23-58% of GDP, contributing 10 - 30% of total exports (OECD, 2012). However, the adoption of Technology has not always been so successful to date, and indeed there are many examples of failure or partial failure (Avgerou & Walsham, 2000), therefore important for the researcher to conduct TAM or TOE analysis for calculating any risk involved on before implementing new Technology.
Looking at current condition in Surabaya city and the neighbour city Located in Indonesia East Java, the Small Medium Business is booming and its contribute to eliminate unemployment. Many changes are needed to be made so the business can be compete against global economy. One way to increase its value are by using new Technology. Small Medium Business may increase its global competitiveness by using IT in order to be more reliable and standardised.
Following the pressure on facing MEA, an idea from ASEAN countries to accelerate Growth of its member countries. The Economic Growth, Social Progress and Cultural Development by collaborately more effective through new and simpler policy that benefit their people while maintaining peace and Order. The ASEAN Economy Community (AEC) are the member countries; including Indonesia. Indonesian President, Joko Widodo, stated that Indonesia is open to both regional and global economies opportunities1, in which since 2015 Indonesia has entered the AEC to focus of politics and security, social culture and economy2.
2. Literature Study
Two main literature studies are used in this research so the technology adoption can be preview before implementation are TOE and TAM. The TOE Context expanded for: Technological context, Organisational context, and the context of the Environment pressure.
In Technology context, Zhu in 2004 explains any technology which can be adopted in organisation. These include technology within and outside the organisation and any technologies which are available on market.
While in 2011 Ghobakhloo explained Organisational context means the understanding any measurement such as organisational size, CEO understanding in IT, The quality of Human resources, The Financial Commitment and Complexity if Managerial structure.
Last one is Environmental context which is the arena in which an Organisation conducts its business its industry, competitors, and dealings with government (Tornatzky and Fleischer 1990, pp. 152 154).
2.1. Selected Technology Acceptance Model (TAM)
Technology Acceptance Model (TAM) is broadly accepted model for understanding the adoption and usage process of IT. The model explains the variance of behavioral intention (BI) of users related to the adoption and usage of IT across a broad context (Hong et al., 2006 ). TAM is used to predict user s IT acceptance (Au and Zafar, 2008 ) and usage on the job and to explain the determinants of the acceptance (Davis, 1986 ). TAM explains the relationship among the user s IT acceptance, adoption, and afterwards the user s BI of IT usage (Autry et al., 2010 ).
Perceived Usefulness (PU)defined by Kuan and Chau (2001) as the degree which a SME believes that using information technology (IT) is useful. Another definition of PU by Davis (1989) is the prospective user s subjective probability that using a specific application system will increase his or her job performance within an organizational context .
Perceived Ease of Use (PEOU) defined by Davis in Pearson and Grandon (2013) as the degree a SME believes that IT is easy to use. According to Davis (1989), PEOU is the degree to which the prospective user expects the target system to be free of effort . According to Gangwar, Date, and Ramaswamy (2013), PEOU and PU are the main construct of TAM model. Only when users believe that using a particular technology can improve their business, they are willing to adopt the technology, thus usefulness is the key indicator of technology adoption.
Familiarity (FAM)measures the degree to which a SME is familiar to the implementation of IT (Kim, Ferrin, and Rao, 2008).
Perceived Risk (PR) is defined as the risks emerged from the consumer s point of view towards uncertainty and consequences of bearing the risk when purchasing a product (Downling & Staeling, 1994). Perceived Risk measures the degree to which a SME understand the risk of implementing IT (Kim, Ferrin, and Rao, 2008, Tarpey and Peter, 1975). Furthermore, the level of a consumer s Perceived Risk in highly influenced by previous experiences (Rendra, 2011).
Owner ICT Knowledge (ICTK) defined by Ghobakhloo (2011) as the extent of ICT knowledge of the SMEs. According to Fink (1998) , knowledge regarding information system is one of the traits that influences IT adoption in SMEs. However, SMEs are currently facing significant risks and problem when adopting IT due to lack of ICT knowledge (Caldeira and Ward, 2003; Igbaria et al., 1997).
pressure is supported to positively affect on adoption intentions (Gangwar, Date, and Ramaswamy, 2013)
A prior study, A research entitled E-commerce technology adoption: a Malaysian grocery SME retail sector by Kurnia et al. (2015), systematically examined the influence of organizational, industrial, and national readiness and environmental pressure on the adoption of diverse EC technologies by SMEs in developing countries. This research is a quantitative research done by conducting survey of Malaysian retail SME s within the grocery sector. SME selection is based on the researcher s personal contact or its association with the local Malaysian university. Organization that is defined as Malaysian SME has less than 50 full-time employees or revenue less than RM 5 million. The findings reveal that organizational readiness, national readiness and environmental pressure do influence the EC adoption in developing countries such as Malaysia while the influence of industry readiness is shown to be insignificant (Kurnia et al., 2015). This research findings highlight collaboration between industry partners and local government to promote EC technologies adoption by communicating the benefits of the adoption to the SMEs. Additional factors that may also influence the adoption of EC in developing countries were not included but should be considered for future researches are: technology complexity, compatibility, and risks as part of the perceived benefits, and trusts between trading partners.
3. Design and Research Methodology
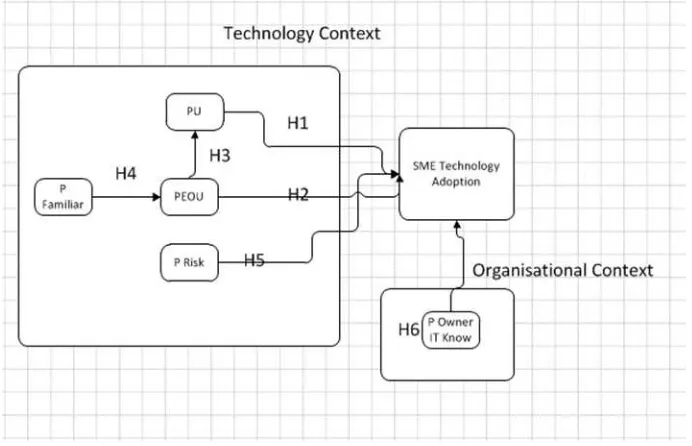
Therefore combining the TOE and TAM model, several Hypothesis are used to get an answer. In this research, the focus mainly on Technology and Organisational Context which is:
Table 1. Research Hypothesis
Hypot hesis
Research Hypothesis Reference
H1 Perceived Usefulness of technology significantly affect positively towards technology adoption in SMEs.
Kuan & Chau (2001)
H2 Perceive Ease of Use significantly affect positively towards technology adoption in SMEs.
Davis stated in Pearson & Grandon (2013)
H3 Perceive Ease of Use significantly affect positively towards Perceived Usefulness of technology.
Davis (1989)
H4 Perceived Familiarity significantly affect positively towards Perceive Ease of Use of technology.
Kim, Ferrin & Rao (2008)
H5 Perceived Risk Use significantly affect positively towards technology adoption in SMEs.
Kim, Ferrin & Rao (2008), Schiffman & Kanuk (2008), Tarpey & Peter (1975) H6 Owners ICT Knowledge Use significantly affect
positively towards technology adoption in SMEs.
Ghobakhloo (2011)
The Respondent sample are using descriptive statistic. Consist of 246 People from different city. Questionares are given during FGD (Focus Grup Discussion) and Visiting several organisation in different city. The Questionares are the explain in different table consist of personal characteristic, city of resident, Industry and IT Experiences.
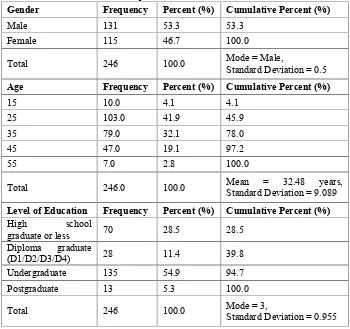
Table 2. Respondents' Personal Characteristic
Gender Frequency Percent (%) Cumulative Percent (%)
Male 131 53.3 53.3
Female 115 46.7 100.0
Total 246 100.0 Mode = Male,
Standard Deviation = 0.5
Age Frequency Percent (%) Cumulative Percent (%)
15 10.0 4.1 4.1
Level of Education Frequency Percent (%) Cumulative Percent (%)
High school
graduate or less 70 28.5 28.5
Based on Table 2, the male respondents were 53.3% (131 males) out of total 246 respondents, while the female respondents were 46.7% (115 females). The majority age of the respondents was 25 years old (41.9%), followed by 35 years old (32.1%). Mainly at these ages people starting their businesses. While The age group of 45 years old (19.1%) has smaller figure than the previous two age groups. This grup busy with work and have less spare time to fill the questionare. On the contrary, the age group of 15 years old (4.1%) and 55 years old (2.8%) were low because it is seldom for teenagers and middle-aged man to start their own business.
The highest respondents level of education falls into undergraduates category (54.9%). Followed by high school graduates (28.5%). It may happens because respondents who fall into the high school category can also still be pursuing their undergraduate degree and engaging their own start-up businesses. The diploma had 11.4% out of the respondents and last one were the postgraduate which had the least percentage (5.3%).
In Indonesia, having a diploma degree (D1, D2, D3 or D4) is not common among business owners and most are pursuing undergraduate degree. While postgraduate degree is often considered as not too important in order for someone to own a business. Only a few people who would like to learn more for their own benefits will pursue postgraduate degree and some other people who aim managerial position to work for big companies also pursuing postgraduate degree.
Table 3. Respondents' City of Residence
Total 246.0 100.0
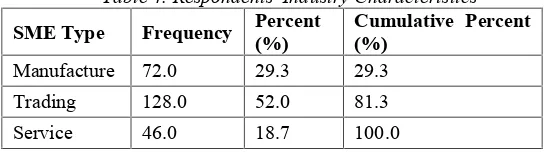
According to table 4. Majority of 128 respondents (52%) are in trading business; followed by 72 respondents (29.3%) are in manufacture business, then 46 respondents (18.7) are in service business. Trading business are common business practice in Indonesia because it is easier compared to other categories. Compare to manufacturing business need more capital invested, human resources, materials for production and other resources. 136 respondents (55.3%) do not have work experience, while 110 respondents (44.7%) have work experience. All of the respondents are business owners. It is common that business owners do not have prior work experience outside their own business. Most people are determined to directly start their own business or continue their family business after they finish their study. In addition, a majority of 212 respondents (86.2%) out of 248 respondents have ever failed in doing business, while only 34 respondents (13.8%) never fail in doing business.
Total 246.0 100.0
Mode = yes,
Standard Deviation = 0.483
IT
Experience Frequency
Percent (%)
Cumulative Percent (%)
< 1 year 45.0 18.3 18.3
1 to < 3
years 81.0 32.9 51.2
3 to < 6
years 76.0 30.9 82.1
6 years 44.0 17.9 100.0
Total 246.0 100.0
Mean = 42.85,
Standard Deviation = 30.212
178 respondents (72.4%) do not have any website, while 68 respondents (27.6%) have website. Regardless owning website or not, there 156 respondents (63.4%) have online sales, while only 90 respondents (36.6%) do not. Even though most have online sales, the numbers of respondents who do not have online sales is quite significant. There are quite a number of people who are still not familiar with online sales and some might be afraid to do online sales. Due to Online fraud people are resistant on buying online.
Furthermore, a majority of 81 respondents (32.9%) have approximately 1 to less than 3 years of IT experience, followed by 76 respondents (30.9%) have longer IT experience of 3 to less than 6 years. The rest either have less than 1 year (18.3%) of IT experience or longest IT experience of equal to or more than 6 years (17.9%). In average, the IT experience for 248 respondents is 42.85% which are in between the second and third category, more or less 3 years of IT experience
4. Analysis and Discussion
On the analysis, the researchers use two sample t test to determine whether any significant difference in sample according to:
A. In terms of ITC knowledge, is there significant difference between males and females?
= In terms of ITC knowledge, there is no significant difference between male and female
Independent Samples Test
1.726 244 0.086 0.10136 0.05873
-0.01432 0.21705
Equal variances not assumed
1.741 243.999 0.083 0.10136 0.05823
-0.01333 0.21605
p-value = 0.086 > 0.05, thus fail to reject H_0. Therefore, in terms of ITC knowledge there is no significant difference between males and females.
B. Is it true? The older the age, the higher the level of education
= There is no correlation between age and level of education
= There is correlation between age and level of education
p-value according to Pearson, Kendall s tau_b, and Spearman s rho are 0.460, 0.382, and 0.390 respectively which are more than 0.05 significance, thus fail to reject H_0. Therefore, there is no correlation between age and level of education, and we cannot say that the higher the age, the higher the level of education.
C. Whether all age groups have different means on IT experience?
= All age groups have no different means on IT experience
= All age groups have different means on IT experience
ANOVA
IT Experience
Sum of Squares df Mean Square F Sig.
Between Groups 9011.308 4 2252.827 2.530 .041
Within Groups 214621.424 241 890.545
Total 223632.732 245
p-value 0.0.41 is less than 0.05 significance, thus reject H_0. Therefore, all age groups have different means on IT experience.
D. Is It True the more IT experience, the higher the perceived usefulness of implementing IT?
= In terms of IT experience, there is no difference in the mean of less than 1 year IT experience and equal to or more than 6 years IT experience
= In terms of IT experience, there is a difference in the mean of less than 1 year IT experience and equal to or more than 6 years IT experience
Group Statistics
IT Experience N Mean Std. Deviation Std. Error Mean
A_PU 6 45 3.8889 .41463 .06181
96 44 4.1364 .45192 .06813
Independent Samples Test
t-test for Equality of Means
t df
Sig. (2-tailed)
Mean Difference
Std. Error Difference
95% Confidence
Interval of the Difference
Lower Upper
A_PU Equal variances
Equal variances difference in the mean of less than 1 year IT experience and equal to or more than 6 years IT experience.
= There is no correlation between perceived usefulness and IT experience
= There is correlation between perceived usefulness and IT experience
E. The more ICT knowledge, the higher the perceived usefulness in implementing IT.
= There is no correlation between perceived usefulness and ICT knowledge
= There is correlation between perceived usefulness and ICT knowledge
F. TAM Model Correlation
A_PU A_PEOU A_PR A_FAM A_ICTK A_ITU
A_PU Pearson Correlation 1 .304** .269** .124 .157* .307**
Sig. (2-tailed) .000 .000 .053 .013 .000
N 246 246 246 246 246 246
A_PEOU Pearson Correlation .304** 1 .341** .305** .306** .129*
Sig. (2-tailed) .000 .000 .000 .000 .043
N 246 246 246 246 246 246
A_PR Pearson Correlation .269** .341** 1 .298** .196** .074
Sig. (2-tailed) .000 .000 .000 .002 .248
N 246 246 246 246 246 246
A_FAM Pearson Correlation .124 .305** .298** 1 .253** -.036
Sig. (2-tailed) .053 .000 .000 .000 .576
N 246 246 246 246 246 246
A_ICTK Pearson Correlation .157* .306** .196** .253** 1 .037
Sig. (2-tailed) .013 .000 .002 .000 .560
N 246 246 246 246 246 246
Sig. (2-tailed) .003 .000 .235 .557 .000 .083
N 246 246 246 246 246 246
A_ITU Pearson Correlation .307** .129* .074 -.036 .037 1
Sig. (2-tailed) .000 .043 .248 .576 .560
N 246 246 246 246 246 246
ICT knowledge has slight positive contribution to PEOU with correlation coefficient of 0.306 and significance of 0.000 which is less than 0.05.
PU has moderate contribution to EFI, with correlation coefficient of 0.431 and is significant.
ICT knowledge only has a slight positive contribution to perceived risk with correlation coefficient of 0196 and is significant. Having ICT knowledge should have provided more understanding on perceived risk.
Familiarity and ICT knowledge do not affect the intention to use IT, which is proven insignificant (0.576 and 0.560 are more than 0.05 significance). Familiarity and ICT knowledge should have affected the intention to use IT. Having more knowledge leads to familiarity of using IT and vice versa, proven significant (0.000 is less than 0.05 significance) and correlation coefficient of 0.298, which should lead to aspire to implement IT to improve one s business.
5. Conclusion
This research concludes that by using TAM, TOE and two sample t test on 246 Small Medium Business in Surabaya city and Surrounding Neighbour city sample the answer are following: Using Two sample test, in term of ITC knowledge there is no significant difference between males and females. There is no correlation between age and level of education, is not means that the higher the age, the higher the level of education. All age groups have different means on IT experience. There is a difference mean of less than 1 year IT experience and equal to or more than 6 years IT experience. There is correlation between perceived usefulness and IT experience. More IT experience slightly contribute to understanding that implementing IT for SME is useful. There is correlation between perceived usefulness and ICT knowledge. More ICT knowledge slightly contributes to understanding that implementing IT for SME is useful
Using TAM analysis, ICT knowledge has slight positive contribution to PEOU. ICT knowledge only has a slight positive contribution to perceived risk. Familiarity and ICT knowledge do not affect the intention to use IT. Perceived risk also has no affect on intention to use IT
By accomodating these analysis suggest that we can improving the ICT Knowledge and familiarity of Technology to boost Technology adoption. Further study may include adding other Organisational Context and Environmental Context and set another focus group discusion for another Technological application such as ERP or CRM.
Acknowledgement
Publication of this article and research can be realized with the help of a grant from the Ministry of Research Technology and Higher Education of the Republic of Indonesia
References
Avgerou, C., & Walsham, G. (Eds.). (2000). Information technology in context: Implementing systems in the developing world. Brookfield, VT: Ashgate Publishing.
Ghobakhloo, M., Arias-Aranda, D. & Benitez-Amado, J., (2011), Adoption of e- commerce applications in SMEs. Industrial Management & Data Systems, 111(8), pp.1238 1269.
Kuan, K.K.Y. & Chau, P.Y.K., (2001), A perception-based model for EDI adoption in small businesses using a technology organization environment framework. Information &
Management, 38(8), pp.507 521. Available at:
http://linkinghub.elsevier.com/retrieve/pii/S0378720601000738.
Kurnia, S., Choudrie, J., Mahbubur, R. M., Alzougool, B. (2015). E-commerce technology adoption: a Malaysian grocery SME retail sector study. Journal of Business Research,68(9), 1906 1918
OECD (2012). ASEAN SME Policy Index 2014 Towards Competitive and Innovative ASEAN SMEs, Published by Economic Research Institute for ASEAN and East Asia (ERIA).
Tornatzky, L.G. & Fleischer, M., (1990), The Process of Technological Innovation, Lexington, MA.: Lexington Books.