Relationships between lightning activity and various
thundercloud parameters: satellite and
modelling studies
M.B. Baker
a, A.M. Blyth
b, H.J. Christian
c, J. Latham
d,),
K.L. Miller
d, A.M. Gadian
da
Geophys AK-50, UniÕersity of Washington, Seattle, WA 98195, USA
b
Physics Department, NMIMT, Socorro, NM 87801, USA c
ES43, NASArMSFC, HuntsÕille, AL 35812, USA
d
Physics Department, UMIST, Manchester, M60 1QD, UK
Abstract
w
The lightning frequency model developed by Baker et al. Baker, M.B., Christian, H.J., Latham, J., 1995. A computational study of the relationships linking lightning frequency and other
x
thundercloud parameters, Q. J. R. Meteorol. Soc., 121, 1525–1548 has been refined and extended, in an effort to provide a more realistic framework from which to examine
computation-Ž
ally the relationships that might exist between lightning frequency f which is now being routinely Ž .. measured from a satellite, using the NASArMSFC Optical Transient Detector OTD and a variety of cloud physical parameters. Specifically, superior or more comprehensive representations
Ž . Ž . Ž .
were utilised of: 1 glaciation via the Hallett–Mossop H–M process; 2 the updraught structure
Ž . Ž .
of the model cloud; 3 the liquid-water-content structure of the model cloud; 4 the role of the Ž .
reversal temperature Trev in influencing lightning characteristics; 5 the critical breakdown field Ž .
for lightning initiation; and 6 the electrical characteristics of the ice crystal anvil of the model cloud. Although our extended studies yielded some new insights into the problem, the basic pattern of relationships between f and the other parameters was very close to that reported by
Ž .
Baker et al. 1995 . The more elaborate treatment of Trev restricted somewhat the range of conditions under which reverse-polarity lightning could be produced if the cloud glaciated via H–M, but confirmed the earlier conclusion that such lightning would not occur if the glaciation was of the Fletcher type. The computations yielded preliminary support for the hypothesis that satellite measurements of f might be used to determine values of the ice-content of cumulonimbus
)
Corresponding author. MMM Division, NCAR, Department of Physics, P.O. Box 3000, Boulder, CO 80307-3000, USA. Tel.:q1-303-497-8892; e-mail: [email protected]
0169-8095r99r$ - see front matterq1999 Elsevier Science B.V. All rights reserved. Ž .
anvils: a parameter of climatological importance. The successful launch and continuing
satisfac-w
tory functioning of the OTD Christian, H.J., Goodman, S., 1992. Global observations of lightning from space, Proc. 9th Int. Conf. on Atmospheric Electricity, St. Petersburg, pp. 316–321;
Ž .
Christian, H.J., Blakesee, R.J., Goodman, S.J., 1992. Lightning imaging sensor LIS for the earth
x
observing system. NASA Tech. Memorandum, 4350 make it possible—with a high degree of precision—to measure lightning location, occurrence time and frequency f over extensive areas of the Earth’s surface. Measured global distributions of lightning and associated lightning stroke radiance demonstrate that: lightning activity is particularly pronounced over the tropics, much greater over land than over the oceans, and exhibits great seasonal variability; lightning radiance tends to be greater over the oceans, less when lightning activity is high, and greater in the Northern Hemisphere winter than summer.q1999 Elsevier Science B.V. All rights reserved.
Keywords: Lightning; Satellites; Ice crystals; Thunderstorm activity
1. Introduction
As a first step in the possible exploitation of satellite-borne lightning measurements ŽChristian and Goodman, 1992; Christian et al., 1992 made with the NASA. rMSFC
Ž . Ž .
Optical Transient Detector OTD , Baker et al. 1995 developed a crude model of multiple lightning activity in thunderclouds, with a view to examining the hypothesis Žsupported by the research of Chauzy et al., 1985; Goodman et al., 1988; Goodman and
.
Buechler, 1990; Orville, 1990; Williams et al., 1990; and others that quantitatively definable relationships exist between lightning frequency f and thundercloud parameters
Ž . Ž . Ž .
such as precipitation rate P , updraught speed w , radar reflectivity Z , cloud-width ŽW , etc. If such relationships are established, then measurements made with the OTD. Žor its successor, the Lightning Imaging Sensor LIS , to be launched in the near futureŽ . . can be used to derive values of P, w, Z and other parameters; and the instrument could thus have significant forecasting or now-casting importance.
This preliminary work yielded the conclusion that over a wide range of conditions f, Ž
was roughly proportional to the first power of the parameters Z and W and also the ice .
crystal and graupel pellet concentrations ; and, in some circumstances, to around the sixth power of w. The relationship between f and P depended critically on the extent to which the value of w determined the location of the ‘balance level’ in the thundercloud, i.e., the altitude at which the precipitation started to fall towards the ground.
We reiterate here a point stressed by Baker et al., that their ‘model’ cannot be regarded as a quantitatively adequate thunderstorm electrification model, but as rather a vehicle enabling sensitivity tests to be conducted into the possible relationships between
Ž
f which models have not computed hitherto, because of the complexity and unknown .
Ž .
model in which explicit cloud microphysics is retained is helpful in identifying the separate sensitivities of f to the individual cloud parameters.
However, there are several unnecessarily simplistic features of the model of Baker et
Ž .
al. 1995 which was deemed desirable to eliminate, in order to enhance our level of confidence in its predictions. The associated refinements and extensions are described in Section 2, and their influence on the results of the sensitivity tests are described in Section 3.
In Section 4, we examine the possibility that a definable relationship might exist between f and I, the ice-content of the thundercloud—in which case OTD or LIS measurements of f could in principle be used to measure I, which is a parameter of climatological significance.
Ž Section 5 consists of the presentation and discussion of specimen OTD data for
.
summer and winter months on global distributions of lightning frequency and lightning stroke radiance.
In Section 6, we present a discussion of various points arising from this work; and in particular an attempt to define research problems in this area which need urgently to be addressed.
2. Refinements to the model
The exclusive charging mechanism assumed to be operating in the 1-dimensional,
Ž .
multiple lightning activity model of Baker et al. 1995 is the non-inductive mechanism ŽReynolds et al., 1957; Takahashi, 1978; Jayaratne et al., 1983; Baker et al., 1987.
Ž . Ž
which involves rebounding collisions between heavier graupel pellets growing
princi-. Ž . Ž .
pally by riming and lighter ice crystals growing by vapour diffusion . Gravitational separation of these two types of hydrometeor inside the thundercloud gives rise to the development of a vertical electric dipole. The mathematical expressions for the charge transferred per interaction were simplified versions of those employed in thunderstorm
Ž .
electrification modelling calculations by Norville et al. 1991 , which were themselves distilled from a series of papers describing laboratory experiments by Saunders et al. at UMIST. This mechanism is not necessarily the primary one involved in thunderstorm
Ž .
electrification see, for example, Vonnegut and Latham, 1983 : but it is believed by the authors, on the basis of accumulated field evidence, to be so.
The laboratory experiments cited above indicate that the sign of the charge trans-ferred by the non-inductive process changes at the ‘reversal temperature’ T . Forrev T)Trev, the collisions between graupel pellets and ice crystals convey positive charge
to the graupel, and for T-Trev, the opposite is true. The precise value of Trev remains
Ž . Ž .
under dispute, and Baker et al. 1995 used a single, intermediate value y158C for all of their calculations. They took no account of reports that the value of Trev depends on that of the liquid-water-content L in the vicinity of the charging.
In the current work, we range values of Trev from 08C toy248C, which encompasses
Ž .
Ž . Ž .
Baker et al. 1995 used only one value 300 kVrm of critical breakdown field Ecrit in their computations. This figure is based on field measurements and laboratory studies Že.g., Crabb and Latham, 1974; Griffiths and Latham, 1974; Latham, 1981 . However,. the actual value of Ecrit in a particular situation may well depend upon the atmospheric pressure and hydrometeor characteristics in the region of breakdown. Accordingly, in the present work, Ecrit was ranged from 200 to 400 kVrm.
Two separate mechanisms of ice crystal production were utilised in the studies of
Ž .
Baker et al. 1995 . One was Fletcher-type or primary nucleation, which produces ice crystal concentration values which increased rapidly with altitude. The other was
Ž . Ž
secondary ice particle production via the Hallett–Mossop H–M process, Hallett and .
Mossop, 1974 , which involves ice splinter production during the accretional growth of
Ž .
graupel pellets within the H–M temperature band y3 to y88C . This latter process produces, in a dynamically simple model, ice crystal concentrations which are essen-tially independent of altitude at temperatures colder thany88C.
To a first approximation the rate of ice splinter production via H–M in a given region of thundercloud is proportional to the total riming rate in that region, which is itself dependent on the liquid-water-content and the numbers, sizes and velocities of graupel pellets falling through it. These factors were taken into account in the present work, together with the value of the number of ice crystals produced per unit mass of accreted rime reported by Hallett and Mossop, to compute the ice splinter production rate via H–M in all regions of the cloud. This is a superior procedure to that employed by Baker
Ž .
et al. 1995 , who simply prescribed a splinter production rate which was independent of the liquid water and graupel pellet characteristics.
Ž .
A weakness of the physical picture employed in the model of Baker et al. 1995 was that both the updraught speed w and the liquid-water-content L were assumed to be
Ž
independent of altitude within the charging zone defined as the region—extending upwards from either the 08C ory38C isotherms, depending on glaciation mechanism, to the balance level—within which graupel pellets, ice crystals and supercooled water
.
co-exist . In reality, both are generally altitudinally dependent in ways which will vary from cloud to cloud, as well as with time and location within a particular cloud. In the
Ž .
present work we move closer to observation by assuming: 1 that L at any level is a specified fraction of the adiabatic value L , the value of this fraction being constant atad
Ž .
all levels and times for each model cloud, but variable from cloud to cloud; 2 that w is constant below cloud-base, but increases with a fixed gradient throughout the charging zone. Values of LrLad ranging between 0.2 and 0.6 were employed in our calculations, and for most runs with altitudinally variable updraught we used a gradient of 0.02 Žmrs.rmb, which created an approximate doubling of w with a 308C reduction in temperature. An element of additional realism associated with the abovementioned treatment of the updraught speed is that variations in balance level associated with changes in updraught speed w are compressed within a narrower range than in the
Ž .
studies of Baker et al. 1995 .
Ž .
Baker et al. 1995 assumed that the ice crystal anvil constituting the uppermost region of the thundercloud, in which ice crystals and the charge they carried were stored, was of specified depth and of a width W equal to that of the remainder of the cloud. All
Ž
.
resided was assumed to accumulate indefinitely in this anvil. In order more fully to assess the influence of the anvil on lightning production and frequency, calculations of f were also made in the present study for two other representations of the anvil, which
Ž .
might be considered as opposite extrema: 1 the anvil dimensions were the same as in ŽBaker et al., 1995 , but instead of accumulating in the anvil the charge flowed through.
Ž . Ž
and then out of it, at a speed w; 2 the anvil retained the same depth as in Baker et al.,
. Ž
1995 but spread out laterally, thereby retaining indefinitely all the charge and ice .
crystals flowing upwards through the balance level.
3. Results obtained with the modified model
Ž .
Baker et al. 1995 found that the great bulk of the charging occurred at or just below Ž the balance level, where the ice crystal sizes in the charging zone were a maximum. For the non-inductive process the charge separated per collision increases rapidly with
.
increasing ice crystal size. Thus, if the balance level temperature Tbal is colder than the
Ž .
reversal temperature Trev the charging will be such as to convey the classical "
polarity to the model cloud, and lightning strokes to ground will preferentially bring down negative charge. However, if Tbal is warmer than Trev the charging will be of the
Ž .
opposite polarity and a non-classical . dipole will be produced, raising the possibility
of preferential positive lightning discharges to ground.
Ž .
A novel prediction emanating from the work of Baker et al. 1995 is that whereas Žwhen Tbal)Trev. the H–M glaciation process can produce reverse polarity lightning, the Fletcher-type process cannot, because breakdown fields can be achieved in this
Ž circumstance only when the ice crystal concentrations are unrealistically high one or
. two orders of magnitude greater than observed .
Ž .
However, as mentioned earlier, all the computations of Baker et al. 1995 were based on the assumption that Trevs y158C. If Trev is colder than this value, positive
Ž charging of graupel can occur to colder temperatures, with greater efficiency because
.
the ice crystal sizes are larger and thus, the likelihood that Fletcher-type glaciation can produce reverse polarity lightning is increased. This possibility was tested by reducing
Ž .
Trev toy248C, somewhat outside the range of values deemed feasible. No . lightning was produced for realistic ice crystal concentrations, even at this extremum value of T .rev
In the case of H–M glaciation, if Trev4Tbal, changing Trev has a negligible influence on f, because nearly all the charging is located close to the balance level, as mentioned earlier. However, when Trev is very close to Tbal, f is reduced because graupel are being charged both positively and negatively, with a consequent reduction in the rate of electric field growth. When Trev<Tbal the fields are of opposite polarity, but
Ž .
the values of f are the same for the same Tbal as when Trev4Tbal.
In summary, ranging Trev as outlined above makes no difference to the incapacity of the Fletcher-type glaciation process to produce lightning from reverse-polarity clouds. It
Ž
does not change the values of lightning frequency f except when Trev and Tbal are .
stressed that our modelling indicates that the great majority of lightning-producing
Ž .
clouds will have the classical " dipole, and therefore, the great majority of lightning
strokes to ground will bring down negative charge, as is observed.
For similar reasons to those described above, the incorporation of the reported dependence of L on Trev into the computations makes an insignificant difference to the broad patterns of relationship determined in these studies—which, at this preliminary stage of the development of our capacity to model multiple lightning activity, are the only ones that we can justify focusing attention on.
Changing the critical breakdown field Ecrit from the constant value of 300 kVrm
Ž .
assumed by Baker et al. 1995 to values ranging from 200 to 400 kVrm produced the predictable result that the lower the value of Ecrit, the shorter the time to produce the first lightning stroke, and the higher the values of f. f was found to be roughly linearly proportional to Ecrit, as illustrated in Table 1.
Ž .
As mentioned earlier, Baker et al. 1995 represented the H–M glaciation mechanism by generating ice crystals within the H–M band, and nowhere else in the cloud, and selecting a generation rate which gave an approximately altitudinally independent ice
Ž .
crystal concentration at temperatures colder than y88C which was consistent with field observation. In our current, more realistic treatment, outlined earlier, which takes account of predicted rime-production rates, the computed ice crystal concentrations were
Ž .
multiplied by a constant factor 41 to make them consistent with observations. The fact that this was necessary does not mean that H–M cannot explain ice crystal
Ž
development in thunderclouds. In fact, there is good evidence for example, Blyth and .
Latham, 1993 that it can dominate the glaciation process in cumulonimbus clouds. The need for our multiplicative factor merely underlines the fact that an adequate treatment of cloud glaciation via H–M requires a much better dynamical treatment than the current model affords, and may also, in some circumstances, require consideration of the
Ž .
contribution made to H–M glaciation by large drops e.g., Chisnell and Latham, 1976 .
Ž .
The current treatment of H–M is manifestly superior to that of Baker et al. 1995 because the strong link between rime accretion rate and ice particle production is not
Ž
ignored. However, taking account of the fact that the current work and that of Baker et .
al., 1995 is focused on the performance of reliable sensitivity tests, rather than the development of a quantitatively accurate model of multiple lightning activity, the abovementioned improvements to the treatment of H–M turn out to produce no significant differences in the general patterns of the relationships between f and other
Ž .
cloud parameters, from those identified by Baker et al. 1995 .
Table 1
Ž . Ž .
The variation of normalised lightning flash-rate frfo with breakdown field Ecrit kVrm and the normalised
Ž .
upward flux JrJo of ice crystals into the anvil
Ecrit 200 250 300 350 400
frfo 1 1.3 1.5 1.7 2.0
JrJo 1 2 5 10 20
Invocation of the same criterion for significant change resulting from improvements to our lightning frequency model, this time applied to the more realistic treatments Ždescribed in Section 2 of the vertical distributions within the model thundercloud of. the liquid-water-content L and the updraught speed w, yielded a similar conclusion to that presented in the preceding paragraph with respect to the treatment of H–M, i.e.,
Ž
although the modifications make some significant quantitative differences for example .
in the computed values of Tbal and f for specified circumstances, the predicted patterns of relationship between f and other cloud parameters are essentially the same as before. The extensions, described in Section 2, to the treatment of the anvil presented by
Ž .
Baker et al. 1995 yielded further confirmation of the important role played in lightning activity by the uppermost, ice-crystal laden regions of thunder-clouds. Our new work
Ž .
shows that when the anvil dimensions are the same as in Baker et al., 1995 , but the charge flows through it—from the time of exiting making no further contribution to the
Ž .
electric field within the cloud an implausible scenario, but instructive to consider — rather than accumulating within it, as described in Section 2, multiple lightning does not occur for realistic parameter values. This is obviously a consequence of the important contribution made, in actuality, by the charged ice crystal anvil to the development of breakdown fields.
If, on the other hand, as described in Section 2, the ice crystal anvil is allowed to expand laterally and retain all the crystals and charge entering it, the lightning frequency
Ž .
is higher than for the fixed anvil width Baker et al., 1995 . This is because, from elementary electrostatic theory, the wider the charged disc representing the anvil, the greater the contribution made by its charge to the axial electric field deep inside the
Ž .
thundercloud close to the balance level where the field is a maximum and dielectric breakdown eventually occurs.
Although the foregoing results illustrate the importance, in a comprehensive multiple lightning activity model, of having as realistic as possible a description of the ice crystal anvil, the patterns of relationship between f and other cloud parameters, which are revealed by our sensitivity tests and constitute the primary focus of the present work, are not significantly influenced by any plausible changes in our description of the anvil characteristics.
The abovementioned conclusion just presented vis-a-vis the impact of the anvil properties on the relationships between lightning frequency f and the cloud parameters P, w, Z, W, etc., has been shown to be valid for the other features of our model considered in this section. In other words, we conclude that despite its simplicities and
Ž .
crudities, the model presented by Baker et al. 1995 is adequate—at this stage of our understanding of multiple lightning activity—in terms of establishing the nature of these relationships. Nevertheless, the refinements considered in Section 2 and in this section should be helpful in the formulation of a more detailed treatment of our overall research problem. We look forward to a time when new understandings of the influence of lightning strokes on cloud properties and behaviour will provide justification for the utilization of more sophisticated cloud models.
revealed by the present, crude version of the model would not be changed as a consequence. We conclude, therefore, that it is sensible to defer such refinements until a superior model of multiple lightning activity is available.
4. Relationships between lightning activity and cloud ice content
In this section, we present some preliminary results concerned with possible relation-ships between lightning frequency f and total ice content I: and in particular the possibility that measurements of f might yield information on the ice crystal concentra-tions in the anvils of thunderclouds, a parameter of considerable climatological impor-tance.
It is well established that thunderstorms—more specifically thunderstorm anvils—are an important source of ice particles in the upper atmosphere, and that such particles exercise a considerable influence on the radiative balance of the atmosphere.
A simple non-dimensional analysis indicates that f might be roughly proportional to thunderstorm non-precipitating ice content, I. This analysis, of course, is not identifiably associated with a particular region of a thundercloud, although it is most likely, in reality, to relate closely to the highest levels of the charging zone, since this is where the great preponderance of the charging occurs. Accordingly, it was decided to use a recently refined version of our model to examine the relationships between f and I at
Ž . Ž .
three separate locations: 1 the top of the charging zone; 2 throughout the charging zone, the lower level of which is at either 08C or y38C, according to whether ice is assumed to be created by either the primary nucleation mechanism or the H–M process; Ž .3 the ice crystal anvil.
Ž .
In the case of 1 , our preliminary results indicate that for both glaciation mechanisms mentioned earlier, f increases roughly linearly with I, as predicted by the dimensional analysis, and illustrated in Table 1. Such a dependence is not surprising, since the
Ž
charging resulting from rebounding collisions between ice crystals and growing graupel .
pellets is principally concentrated near the balance level, and the charging rate per unit Ž
volume which will determine the rate at which breakdown fields can regenerate after a .
lightning flash depends on the numbers and sizes of ice crystals in this region. Ž .
Virtually identical results were obtained in the case of 2 , which is as expected, since both the ice content and the charging rate in the charging zone increase rapidly as the
Ž .
altitude increases towards the highest region the balance level . Ž .
In the case of 3 , the value of I increased steadily with time, whereas the value of f tended to be roughly time-independent. This result is not surprising since, on our simple model, in which the dimensions of the anvil are fixed, its ice content increases linearly with time, whereas—once the cloud is fully developed—that in the charging zone remains roughly constant throughout much of the active period of lightning production. Plots of f against J, the upward flux of ice crystals through the top of the charging zone into the ice crystal anvil of the model thundercloud, indicate a relationship between these two parameters which is close to linear.
Ž
It follows from the above considerations that a fixed mass M of ice in the form ofi .
preliminary computational work conducted to date suggests that a characteristic value for M is around 10i 6 kg. This figure, emanating from a simplistic model and with no direct observational evidence against which to test it, cannot be regarded as accurate. The same statement must be applied to the crude calculations that follow. Our primary concern at this stage is simply to illustrate how it is possible, in principle, to derive characteristics of ice crystal anvils from satellite measurements of lightning. Detailed global-scale measurements of anvil characteristics are urgently required.
Ž Taking the abovementioned value for M , and assuming a figure of 40i rs as
.
determined from OTD measurements for the global lightning frequency fglob, we deduce that the global flux Jglob of ice crystals upwards into thunderstorm anvils is about 4=107 kgrs.
An estimate of the global ice crystal content Mglob present in thunderstorm anvils can be determined by noting that the rate of creation of cirrus crystals by thunderstorm
Ž .
activity the product M fi glob must be equal to Mglobrtanv, where tanv is a characteristic time defining anvil dissipation. Taking tanvs104 s, and the abovementioned values of M and f , we obtain a global ice crystal thunderstorm anvil content M of 4=1011
i glob glob
kg.
Ž For an individual thunderstorm or a thunderstorm complex, the amount of ice as
.
crystals introduced into the anvils is given simply by the product M N , where Ni tot tot is the satellite-derived number of lightning strokes associated with the storm.
Much more data acquisition and analysis, together with computational improvement, are required in order to obtain more definitive and quantitative information on the question of the extent to which satellite measurements of lightning can provide estimates of large-scale and global upper level atmospheric ice crystal contents resulting from thundercloud activity. These first results, however, are encouraging, and if confirmed should be of climatological importance.
5. Specimen global lightning data obtained with the OTD
One reason for attempting to develop a model of multiple lightning activity, is that—as described earlier—it has recently become possible, via satellite-borne instru-ments, to observe lightning activity on a global scale. Therefore, should it transpire that systematic relationships exist between lightning frequency f and other cloud parameters, it may prove possible to determine values of these parameters from satellite measure-ments of f. The first such lightning sensor to be developed and flown was the OTD.
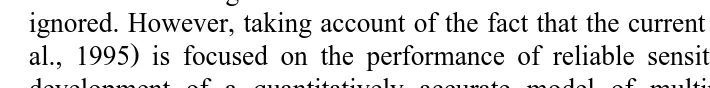
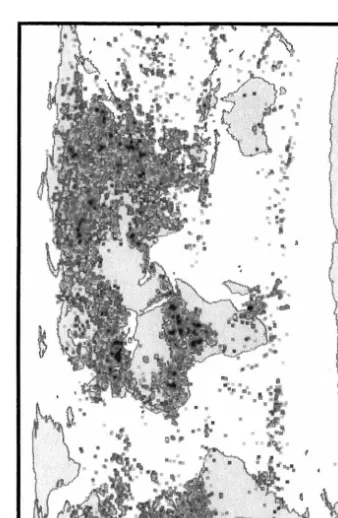
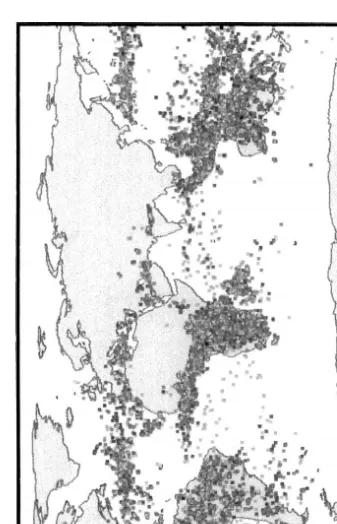
Figs. 1 and 2 present characteristic lightning flash data from the OTD device, illustrating global activity recorded in 1995 during the months of August and December, respectively, dominant features of which are seen to be the propensity of lightning to occur over the land rather than the sea, and the huge disparity between summer and winter lightning activity in both hemispheres. We note also the major contribution played by the tropics, especially Africa, to global lightning activity: and that lightning activity over the oceans, though much less than over land, is sometimes appreciable.
Fig.
1.
OTD
lightning
data
for
the
month
of
August
Fig.
2.
OTD
lightning
data
for
the
month
of
December
Fig.
3.
OTD
lightning
radiance
data
for
August
Fig.
4.
OTD
lightning
radiance
data
for
December
Ž .
of the integrated radiance B joules associated with each flash. It seems likely—though much further work is necessary for definitive information to be obtained—that charac-teristics of a lightning stroke, such as the amount of NOX created by it, or the total charge transfer associated with it, will increase with increasing B, so that the global pattern, for example, of NOX production will be more accurately represented by a global distribution of B rather than simply that of lightning activity.
In addressing these ideas, our current extremely limited knowledge permits us only to compare global distributions of B with those of lightning activity, to see if these are markedly different.
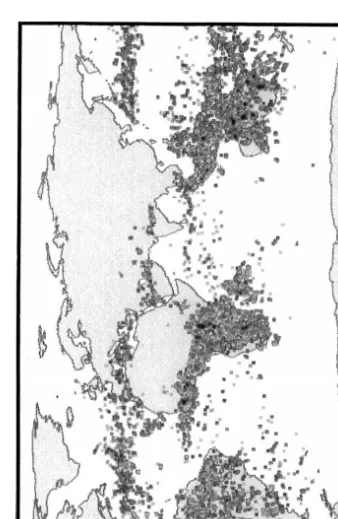
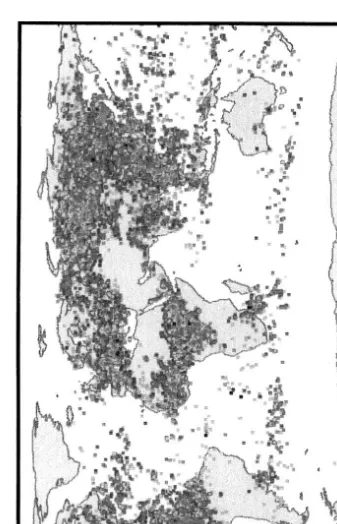
Figs. 3 and 4 present OTD-derived global distributions of B for the month of August 1995, using the same data as were utilised to produce Figs. 1 and 2, respectively.
Ž
Differences between them consolidated by examining pairs of such figures for other .
months indicate that the mean radiance per flash is higher over the oceans than over
Ž .
land, and in the Northern Hemisphere higher in the wintertime than in the summer, a
Ž .
finding consistent with measurements Brook, 1992 of seasonal variations in the transit time of lightning strokes from cloud to ground. Our analysis also indicates that stroke radiances are lower when flash-rates are higher.
Despite these differences, however, the over-riding conclusion from comparison of global distributions of lightning activity with those of lightning radiance, is that the patterns are very similar. It thus appears likely that lightning activity is a reasonable indicator of NOX production rate, and other characteristics and consequences of lightning.
Much more lightning data will be available to help address some of the questions raised herein with the scheduled launch in November 1997—as part of the Tropical
Ž .
Rainfall Measuring Mission TRMM —of the OTD’s successor, LIS, the NASArMSFC LIS. Greater understanding of the characteristics of lightning-producing storms through-out their lifetimes should be achieved via the planned installation of a lightning sensor on a satellite in geostationary orbit.
6. Discussion
The research described in the preceding sections indicates that despite its rudimentary
Ž .
nature, the multiple lightning activity model presented by Baker et al. 1995 is an adequate vehicle for the performance of the sensitivity tests designed to explore the relationships between lightning frequency f and other cloud parameters. Accordingly, we conclude that the work described herein confirms and does not anywhere refute the
Ž .
primary conclusions of Baker et al. 1995 ; namely that over a wide range of conditions f is roughly proportional to the first power of the parameters Z, W, ice crystal
Ž .
concentration, graupel pellet concentration, and in some circumstances to a
signifi-Ž .
work confirms our earlier conclusion that H–M glaciation is capable of producing
Ž .
inverted-polarity clouds which produce lightning, whereas the Fletcher-type primary glaciation is not.
The work presented herein provides some encouraging preliminary support for the hypothesis that satellite measurements of f might be used to determine values of the non-precipitating ice-content of thunderclouds, but more research into this question is required in order to reach definitive conclusions.
The present work underlines the need for attention to be devoted to several important needs andror issues associated with thunderstorm electrification, in order to reach the stage where, in our view, it would be feasible and therefore meaningful to attempt to produce a full-scale, three-dimensional model of multiple lightning activity. These needs are outlined below.
Ž .1 We require a full, quantitative understanding of the operative mechanism or mechanisms of thundercloud glaciation. In our opinion this requirement is of paramount importance.
Ž .2 We need to improve our understanding of ice crystal anvil characteristics, and
Ž .
their variation temporal and spatial during the life-history of thunderstorms.
Ž .3 We need to be able to predict the charge rearrangement inside a thunderstorm that follows a lightning event.
Ž .4 We need to be able to predict the hydrometeor changes and rearrangements inside a thunderstorm that follow a lightning event.
Ž .5 We need a superior understanding of the process or processes responsible for lightning initiation; and these need to be fully quantified.
Ž .6 We need an agreed, quantitative description and ideally, a complete physicalŽ .
understanding of the non-inductive charging mechanism, which now appears to be the dominant charging process operative in the great majority of thunderclouds.
Acknowledgements
JL is pleased to acknowledge support from the Universities Space Research
Associa-Ž . Ž .
tion US and the Meteorological Office UK .
References
Baker, B., Baker, M.B., Jayaratne, E.R., Latham, J., Saunders, C.P.R., 1987. The influence of diffusional growth rates on the charge transfer accompanying rebounding collisions between ice crystals and soft hailstones. Q. J. R. Meteorol. Soc. 113, 1193–1215.
Baker, M.B., Christian, H.J., Latham, J., 1995. A computational study of the relationships linking lightning frequency and other thundercloud parameters. Q. J. R. Meteorol. Soc. 121, 1525–1548.
Blyth, A.M., Latham, J., 1993. Development of ice and precipitation in New Mexican summertime cumulus clouds. Q. J. R. Meteorol. Soc. 119, 91–120.
Brook, M., 1992. Proc. Ninth Int. Conf. on Atmos. Elect. St. Petersburg, Russia.
Chisnell, R.F., Latham, J., 1976. Ice particle multiplication in cumulus clouds. Q. J. R. Meteorol. Soc. 102, 133–156.
Christian, H.J., Goodman, S., 1992. Global observations of lightning from space. Proc. 9th Int. Conf. on Atmospheric Electricity. St. Petersburg, pp. 316–321.
Christian, H.J., Blakesee, R.J., Goodman, S.J., 1992. Lightning imaging sensor for the earth observing system. NASA Tech. Memorandum 4350.
Crabb, J.A., Latham, J., 1974. Corona from colliding drops as a possible mechanism for the triggering of lightning. Q. J. R. Meteorol. Soc. 100, 191–202.
Goodman, S.J., Buechler, D.E., 1990. Lightning–rainfall relationships. Proc. AMS Conf. on Operational Precipitation Estimation and Prediction. Anaheim, CA, 1990.
Goodman, S.J., Beuchler, D.E., Wright, P.D., 1988. Lightning and precipitation history of a microburst-pro-ducing storm. Geophys. Res. Lett. 15, 1185–1188.
Griffiths, R.F., Latham, J., 1974. Electrical corona from ice hydrometeors. Q. J. R. Meteorol. Soc. 100, 163–180.
Hallett, J., Mossop, S.G., 1974. Production of secondary ice particles during the riming process. Nature 249, 26–28.
Jayaratne, R., Saunders, C.P.R., Hallett, J., 1983. Laboratory studies of the charging of soft hail during ice crystal interactions. Q. J. R. Meteorol. Soc. 103, 609–630.
Latham, J., 1981. The electrification of thunderstorms. The Symons Memorial Lecture 1979. Q. J. R. Meteorol. Soc. 107, 277–298.
Norville, K., Baker, M.B., Latham, J., 1991. A numerical study of thunderstorm electrification: model
Ž .
development and case study. J. Geophys. Res. 96 D4 , 7463–7481.
Orville, R.E., 1990. Winter lightning along the East Coast. Geophys. Res. Lett. 17, 713–715.
Reynolds, S.E., Brook, M., Gourley, M.F., 1957. Thunderstorm charge separation. J. Meteorol. 14, 163–178. Takahashi, T., 1978. Riming electrification as a charge generation mechanism in thunderstorms. J. Atmos. Sci.
35, 1536–1548.
Vonnegut, B., Latham, J., 1983. Comments on the paper, ‘The electrification of thunderstorms’. Q. J. R. Meteorol. Soc., 109–112.