AUTOMATED WETLAND DELINEATION FROM FREQUENCY AND
MULTI-POLARIZED SAR IMAGES IN HIGH TEMPORAL AND SPATIAL RESOLUTION
L. Moser a *, A. Schmitt b, A. Wendleder b a
GAF AG, Arnulfstrasse 199, 80634 Munich, Germany - [email protected], [email protected] (former at: German Aerospace Center (DLR), German Remote Sensing Data Center (DFD), Land Surface Department (LAX), Oberpfaffenhofen,
Wessling 82234, Germany) b
German Aerospace Center (DLR), German Remote Sensing Data Center (DFD), Land Surface Department (LAX), Oberpfaffenhofen, Wessling 82234, Germany - (andreas.schmitt, anna.wendleder)@dlr.de
Commission VI, WG VIII/4
KEY WORDS: Lac Bam, Multi-sensor, Polarimetry, SAR, Scattering mechanisms, Time series, Water, Wetlands
ABSTRACT:
Water scarcity is one of the main challenges posed by the changing climate. Especially in semi-arid regions where water reservoirs are filled during the very short rainy season, but have to store enough water for the extremely long dry season, the intelligent handling of water resources is vital. This study focusses on Lac Bam in Burkina Faso, which is the largest natural lake of the country and of high importance for the local inhabitants for irrigated farming, animal watering, and extraction of water for drinking and sanitation. With respect to the competition for water resources an independent area-wide monitoring system is essential for the acceptance of any decision maker. The following contribution introduces a weather and illumination independent monitoring system for the automated wetland delineation with a high temporal (about two weeks) and a high spatial sampling (about five meters). The similarities of the multispectral and multi-polarized SAR acquisitions by RADARSAT-2 and TerraSAR-X are studied as well as the differences. The results indicate that even basic approaches without pre-classification time series analysis or post-classification filtering are already enough to establish a monitoring system of prime importance for a whole region.
1. INTRODUCTION
It is well known that the global warming predicted for the coming decades goes along with an increasing severity of weather phenomena. While temperate regions will be more affected by heavy rains and some (minor) droughts, already semi-arid regions will suffer extremely from the changing climate. The transition from rainy to dry seasons (e.g.) is expected to vary much more than nowadays. Wetlands fulfil their function as fresh water reservoirs that are filled once a year and have to supply the inhabitants, agriculture, and industry until the next rainy season, and therefore, the sophisticated water management is indispensable. In return, this requires an up-to-date estimation of the water reserve, which raises serious problems.
The current standard is the installation of water gauges at selected locations, e.g. dams. Though this allows a near-real time measurement of the water level at a certain point, and consequently modelled water volumes, it provides no reliable information about the remaining water resource, particularly for wetlands like Lac Bam where siltation rates are so high that the lake floor topography is constantly changing (Moser et al., 2016). Therefore, area-wide measurements are needed for a better water resource estimation. Instead of installing and connecting a large number of water level loggers, remote sensing solutions might be a convenient alternative. Optical remote sensors share three main problems: First, they require cloud-free conditions and sufficient sun illumination. Second, they only report the reflectance directly on the illuminated surface, i.e., water covered by plants will be detected as green canopy (vegetation). Third, the turbid and sediment-rich water bodies show very high reflectance values in the visual part of the spectrum, similar to bare soil, and much higher than usual
reflectance in the near infrared part, which is favoured for water detection because almost all the radiation is absorbed, resulting in very low values over surface water.
Brisco, 2013, Betbeder et al., 2015). In summary, SAR represents the optimal sensor group for the regular remotely sensed monitoring of water bodies and wetlands.
One limiting factor is the availability of suitable space-borne SAR sensors with a high spatial, temporal, and polarimetric resolution. The polarimetric resolution determines the distinguishability of different scattering mechanisms. TerraSAR-X (TSX) supports dual-co-polarized measurements able to identify surface and double-bounce scattering, and dual-cross-polarized measurements that report the volume scattering. RADARSAT-2 (RS-2) only allows the dual-cross-polarized imaging. Fully polarized images were not of interest in this work, since the focus is on the exploitation of partial-polarimetric data. Because of the longer wavelength the dual-cross-polarized mode seems to be suitable to map the volume component. The shorter wavelength of TerraSAR-X in contrast is expected to better distinguish between surface and double-bounce. Therefore, a combination of this two sensors is chosen in this study. The temporal resolution is related to the repeat pass orbits, i.e. the time gap between two acquisitions from the same imaging geometry. TerraSAR-X provides repeat pass acquisitions in an eleven day period, and RADARSAT-2 requires twenty-four days. For this study we acquired images from two different RADARSAR-2 orbits (one in ascending and one in descending direction) in order to increase the sample rate to the one provided by TerraSAR-X. Last, the spatial resolution describes the distinguishability of two targets in close neighbourhood. In favour of the comparability a common pixel grid of five by five meter on the ground was chosen for both sensors which implies a slight oversampling in the case of RADARSAT-2 and a subsampling in the case of TerraSAR-X.
The research question followed in this contribution is whether the methodology developed on TerraSAR-X dual-co-polarized data in former studies (Moser et al., 2016) is directly transferable to C-band dual-cross-polarized SAR data from RADARSAT-2 with a lower spatial resolution. The supplementary C-band measurement might be used to construct a multi-frequency SAR image, which is quite new in space-borne SAR remote sensing, or just to fill temporal gaps in order to generate extremely dense time series. With view to the Sentinel-1 mission inter alia providing dual-cross-polarized C-band SAR data with a temporal sampling of six days only (after launch of the second satellite sensor), the time series aspect attracts much attention. Therefore, this study will perform a multitemporal classification on the full time series stack, and check each reasonable combination of sensor and polarization mode in order to estimate the expectable accuracy.
The focus of this paper is on, firstly, the interpretation of SAR scattering mechanisms in different types of flooded or floating vegetation using dual-polarimetric X- and C-band SAR data and secondly, the derivation of change classes applying a multitemporal classification on the full time series stack. The objective is to classify the following wetland classes and respective change classes: open water, flooded or floating vegetation in water, and irrigated fields from multi-polarized SAR imagery, based on the semi-arid wetland site Lac Bam in Burkina Faso. This study is unique due to the dense time series of multi-polarized SAR data in conjunction with a ground-truth field campaign that has been recently carried out. This campaign was specifically tailored towards areas that are prone to classification errors for flooded vegetation, tested in previous work using polarimetric SAR imagery (Moser et al., 2016). Results will contribute as preparation for possible applications using Sentinel-1 time series over African wetlands.
This paper is organized as follows: The next section introduces the study site in detail and gives an overview to the available data sets such as the images acquired by SAR sensors or the reference data gathered in field campaigns. Then, the methodology is presented consisting of the Kennaugh element framework (Schmitt et al., 2015) and multitemporal classification including SAR time series fusion. The results are shown, discussed and validated with respect to the available reference data in the fourth section of the paper. A brief summary and an outlook on ongoing studies conclude the paper.
2. STUDY SITE AND DATA 2.1 Area of Interest
Lac Bam, a Ramsar wetland of international importance, was chosen as a test site for this study. Lac Bam is the largest freshwater lake in Burkina Faso and of high significance for the local population, for biodiversity, and fulfils various ecosystem functions. The site is located at the transition between the Sahelian and Sudano Savannah climate of Burkina Faso, characterized by a rainy season between the summer months of June and September/October, and a long dry season where water availability is particularly important for different livelihoods (farming, pastoralism, fishing) as well as for domestic households. Large areas of Lac Bam contain different emerging or floating vegetation in water, mainly grasses, water lilies and trees (Moser et al., 2016). More than 1000 motor pumps extract water for the irrigation of fields for vegetable gardening during the long dry season. These fields are situated around the lake and change dynamically throughout the season as well as between the different years. Irrigated cultivations are part of the wetland by common nomenclatures defined for example by the Ramsar convention (Ramsar., 2016). They are very relevant to be monitored for water availability and food security issues. Lac Bam is only monitored in terms of water level at the dam in the South, but no area-wide water monitoring has been carried out to date, considering open water as well as waters including flooded or floating vegetation. Moser et al. (2014) used Lac Bam as one case study to monitor open water areas using optical medium resolution time series from MODIS. This work builds on the study recently published by Moser et al. (2016) which is the first attempt for an area-wide monitoring applied at Lac Bam.
2.2 Synthetic Aperture Radar Data
TerraSAR-X ascending
RADARSAT-2 ascending
RADARSAT-2 descending
18.10.2014 18.10.2014
29.10.2014 29.10.2014
09.11.2014 11.11.2014
20.11.2014 22.11.2014
01.12.2014 05.12.2014
12.12.2014 16.12.2014
23.12.2014
03-01.2015* 29.12.2014
14.01.2015 09.01.2015
25.01.2015 22.01.2015
05.02.2015 02.02.2015
16.02.2015 15.02.2015
27.02.2015 26.02.2015
10.03.2015 11.03.2015
21.03.2015 22.03.2015
01.04.2015 04.04.2015
12.04.2015 15.04.2015
23.04.2015 28.04.2015
04.05.2015 09.05.2015
15.05.2015 22.05.2015
* image was interpolated due to missing acquisition
Table 1. Synthetic aperture radar time series
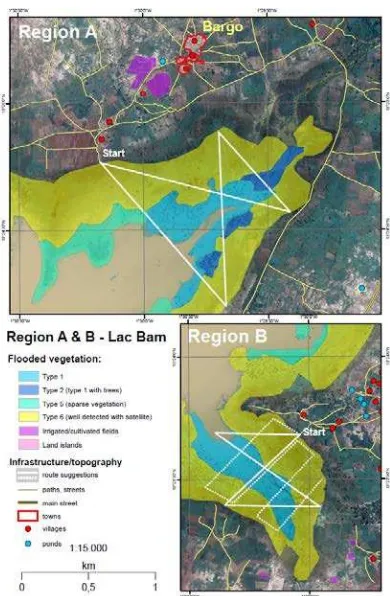
Figure 1. Map used for the field campaign in Region A and Region B which both feature flooded vegetation areas that are
well classified (yellow) and not detected (blue), using dual-polarimetric TerraSAR-X or RADARSAT-2 imagery
2.3 GPS and Photo Field Campaign
A field campaign at Lac Bam was carried out between 25 and 29 October 2015, with the main purpose to gather ground truth photo, GPS data, a description of the flooded vegetation and the water depth of regions that were not correctly classified by polarimetric SAR data. Field Data were collected for four regions, region A and B are displayed in Figure 1. Different vegetation types: well detected flooded vegetation, with and without containing trees (yellow) and not detected flooded vegetation, with an without containing trees (blue), and sparse vegetation (green) Every approximately 100 m photos and measurements were taken with a digital camera, a GPS camera, and a GPS device. The vegetation type, the distance between the photo point and the vegetation, the height and density of the vegetation, and the water depth has been estimated or measured at every photo spot.
3. METHODOLOGY 3.1 Partial-Polarimetric SAR Processing
Traditionally, the analysis of single-polarized and polarimetric data is completely different. In the case of single-polarized data, where only one intensity value per pixel is available, the strength of the backscattering as well as the local texture is studied. In contrast to that, the interpretation of polarimetric data focusses on so-called polarimetric decompositions that transform the measured complex values into physically interpretable measures. The decompositions always require fully-polarized “quadpol” images, i.e. four perpendicular polarizations at the same time. Consequently, the swath width and the azimuth resolution are significantly reduced when using quad-pol acquisitions modes. The trade of spatial resolution versus polarimetric information content leads to so-called “partial-polarimetric” or “multi-polarized” SAR images. In general, only two of four possible polarizations are measured: the combination HH-VV often is referred to as “dual-co-polarized”, both combinations HH-HV and VV-VH are named “cross-polarized”. The decompositions developed for dual-polarized SAR images are mostly restricted to one special polarization combination and with respect to model-based approaches, even to one special wavelength. The comparison of two different polarization combinations or even two different SAR sensors is thus inhibited.
A very basic scattering description was published recently that overcomes this drawback by the strict distinction between intensity and polarimetric information. The decomposition into normalized Kennaugh elements (Schmitt et al., 2015) is applicable to any SAR measurement in single, dual, or quad-polarized mode, or even acquired in one of the future hybrid-compact-pol modes. The main idea is to generate one total intensity layer and a variable number of channels holding the polarimetric information. In the case of dual-co-polarized images, the Kennaugh elements compose like this:
�0=
1 2{|���|
2+ |� ��|2}
�3=−��{������}
�4=1
2{|���|2−|���|2}
�7=��{������} (1)
the horizontal component to the vertical component. The phase shift induced by the imaged target is captured by K7.
Dual-cross-polarized data is described by the total intensity in K0 as well. The remaining polarimetric information unfolds to K1 as relation between co- and cross-polarized intensity, and two correlation measures K5 and K8, which are of minor importance for application in natural environments.
�0= |���|2+ |���|2
�1= |���|2−|���|2 �5=��{����∗��}
�8=��{����∗��} (2)
The Kennaugh elements in linear scale are then normalized by their total intensity or a synthetic reference in the case of K0 (calibration). The projection on a closed and uniform data range is very suitable for data storage or delivery because the radiometric sampling rate can be reduced considerably without losing too much information. When using typical classifiers from optical remote sensing applications like the maximum likelihood classification, the logarithmic scaling is preferred because of the normal-like distribution of the data. Therefore, the Kennaugh elements are converted to the unit decibel, which is most common in SAR remote sensing.
The coregistration is performed automatically by projecting the image on the same coordinate frame by the help of exact (post-processing) orbit data and an accurate elevation model. Therewith, the geometric and radiometric comparability is assured and synergies resulting from the multifrequency image stack (in C- and X-band) can be fully exploited. Figure 2 displays the Kennaugh elements for two selected images that have both been acquired on 18 October 2014:
Figure 2. Kennaugh elements deducted from (a) TerraSAR-X dual-co-pol HH-VV data: K0, K3, K4, and K7 (top row), and (b)
RADARSAT-2 dual-cross-pol HH-HV data: K0, K1, K5, K8 (bottom row). Both images were acquired on 18 October 2014.
3.2 Multitemporal Classification
An analysis chain as developed in Moser et al. (2016) for TerraSAR-X time series is transferred onto the RADARSAT-2 time series, and used for both sensors – TSX and RS-2 – comparatively and in conjunction. A supervised classification approach was chosen using a pixel-based maximum likelihood algorithm, which is a well traceable and a basic approach that needs only a short time frame for computation. Each pixel is
classified according to the highest probability value to belong to a certain class. No post-classification filtering or processing was performed. First, the classification was applied on every image in the time series, deriving the three wetland classes open water (W), flooded/floating vegetation (V), irrigated cultivation (F), and land/non-wetland (L). To derive change classes and delineate the wetland extent throughout the season a multitemporal classification was applied with the following change classes of interest: permanent open water (W), water to land (W–L), flooded vegetation to land (V–L), flooded vegetation to irrigated fields (V–F) (with land in the transition between), the dynamic class of rapidly changing irrigated fields (F–L/L–F), and the two land classes land/permanent vegetation (L1), and land/soils and rocks (L2).
A training and validation dataset (AOIs) were generated based on four optical data at four different time steps: a very high resolution (VHR) WorldView-2 and GeoEye-1 image, as well as two high resolution (HR) RapidEye images. The AOIs were randomly separated into training and validation data, with the same number of AOIs and area size (to the extent possible) for each class. The same AOIs were used for the four different time steps and were constructed for two different purposes: (1) for classifying each image with the four classes W, V, F and L; (2) for the multitemporal classification resulting in the above-mentioned seven change classes. Additionally, photos and GPS points from the field campaigns in October 2013 and October 2015 were very helpful for the definition and interpretation of the reference data. Seven change classes were derived from the four optical images at different times throughout the year, out of which five relevant wetland classes are validated in Table 2.
The design of the study aimed to exploit different combinations of Kennaugh elements, polarizations (co-pol and dual-cross-pol), and wavelengths (C-band and X-band) – separately and in synergy – for a multitemporal classification applied on the full time series of the geocoded, calibrated, and multi-scale multi-looking filtered Kennaugh elements. A weighting matrix to enhance the influence of the Kennaugh element K0 for the class permanent open water was applied on the covariance matrix prior to classification, due to instability of the water class in the other polarimetric channels. Other than that, no further pre-processing or spatial or temporal post-classification filtering was performed.
4. RESULTS AND DISCUSSION
4.1 Interpretation of Polarimetric SAR Scattering Mechanisms
Photos and GPS points have been measured in the field in four regions that were difficult to classify using polarimetric SAR (Region A and B are indicated in Figure 1). Figure 3 shows four photographs from the field campaign representing (a) flooded grasses seen from the shoreline that were well classified using TSX, (b) flooded grasses, here on a picture taken from the lake towards the shoreline, (c) dense water lilies that were not classified with both X- and C-band, and (d) sparse flooded vegetation in shallow waters, with visibility through to the ground in the optical VHR reference satellite images, that were only classified with TerraSAR-X as areas of flooded vegetation, but not with RADARSAT-2.
a)
Figure 3. Ground truth photos taken during the October 2015 field campaign: (a) flooded grasses seen from the shoreline, (b)
flooded grasses from the lake towards the shoreline, (c) dense water lilies, and (d) sparse flooded vegetation in shallow waters,
photos by R. Ouedraogo and L. Moser
Figure 4 shows a supervised classification with the three wetland classes: water (blue), flooded vegetation (green) and irrigated fields (red) that was performed on one Kennaugh element image of both, TSX and RS-2 (compare Figure 2), acquired at the same day (18 October 2014). This should result in the same information, however, from Figure 4 it becomes apparent that flooded vegetation can be well delineated applying the classification on the TSX image, which is not at all the case for RS-2. Also irrigated cultivations are detected using TSX, but using RS-2 the classes flooded vegetation and irrigated cultivation are inter-mixed and further extended to non-wetland areas. This represents a pixel-based result on the 5 m grid scale to which TSX has been sampled (with slight undersampling), as well as RS-2 (with slight oversampling). No further post-classification filtering has been applied. Mispost-classifications outside the wetland area occur for both sensors, which is expected due to the fact that there are a lot of trees, shrubs and dwellings that can be accounted for high backscatter, particularly at the end of the rainy season where there is still a lot of natural green vegetation.
Figure 4. Supervised classification applied on the Kennaugh elements of (a) TerraSAR-X and (b) RADARSAT-2, both from
18 October 2014. The classes are: open water (blue), flooded vegetation (green), irrigated cultivation (red) and non-wetland (beige). Region A, B, and C contain floating vegetation that was
not classified by either of the two sensors.
The regions studied in the field campaign in in October 2015 – Region A and B, as marked in Figure 1 and Figure 4 – were not detected as flooded vegetation with both sensors, and flooded
vegetation in Region C was only detected using TerraSAR-X. The assumption is that no strong double-bounce or difference between HH and VV occurs in X-band, and no strong volume scattering occurs in C-band, since the vegetation is mainly floating on the water surface and is very dense, so that the SAR radiation cannot trespass the canopy, and scatter from the water surface into the vegetation, and back to the sensor.
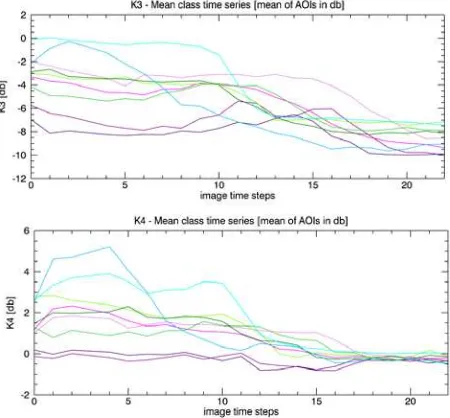
As shown in Figure 5, the temporal development of each class was observed in terms of the temporal profile of AOIs, plotted over the time series, in order to define change classes and compare the change of the scattering mechanisms over one season. The mean of the AOIs was plotted for K3 and K4 from TerraSAR-X for different flooded and floating vegetation types: water lilies in purple, grasses in pink, grasses with flooded trees in green, and shallow flooded soil/fields in turquoise.
Figure 5. Temporal development of flooded vegetation classes
Despite the fact that the single image classification did not have the same success for TerraSAR-X HH-VV and RADARSAT-2 HH-HV images, adding a temporal component presents new opportunities and again highlights the importance of time series for wetland remote sensing (see Figure 6): A multitemporal red-green-blue (RGB) stack of K0 for TSX (sum of HH and VV intensity), and K0 for RS-2 (sum of HH and HV intensity) appears promising for detecting temporal changes from both sensors. Both, TSX (X-band) and RS-2 (C-band) are able to capture similar dynamics – in this case considering only the intensity (K0) – however, under the condition that the temporal change is considered. The starting point of the time series (18 October 2014 for TSX and RS-2) is visualized as red channel, resulting in some flooded vegetation on the wetland’s outer boundaries and in the north of Lac Bam being coloured in bright red, and most of the background image being coloured in dark red, due to still present natural vegetation at the end of the rainy season. An image in the middle of the dry season (25 January 2015 for TSX and 22 January 2015 for RS-2) is displayed as green channel, which causes areas of both, flooded vegetation and irrigated cultivation, appear in light green. An image representing the end of the dry season (15 May 2015 for TSX, 9 May 2015 for RS-2) is assigned to the blue channel, showing areas where open water retreated at the end of the dry season in dark blue. Rocky and urban areas that are characterized by strong backscatter throughout the whole year appear in light blue to grey and white.
C C
a)
c)
d)
b)
Figure 6. Multitemporal red-green-blue (RGB) stack of K0 for (a) TerraSAR X: 18 Oct. 2014, 25 Jan. 2015, 15 May 2015; and
(b) RADARSAT-2: 18 Oct. 2014, 22 Jan. 2015, 09 May 2015
4.2 Multitemporal Classification
Different experiments have been conducted using the same training dataset for different classification results. Both for RADARSAT-2 and TerraSAR-X a classification was carried out, using: (1) all four Kennaugh elements, (2) combinations of the most significant Kennaugh elements, and (3) only the sum of intensities K0. For RADARSAT-2 only the difference between ascending and descending orbit was explored using as classification input (4) all four Kennaugh elements of only images acquired in ascending orbit, and (5) images acquired in descending orbit. After fusion of the multi-frequency time series of both sensors (TSX + RS-2) the classification was performed with: (6) all four Kennaugh elements of both sensors, (7) the most significant Kennaugh elements of both sensors, and (8) only K0 of both sensors.
Figure 7 shows the two best multitemporal classification results: For TerraSAR-X this was the combination of Kennaugh element K0, K3 and K4, for RADARSAT-2 the combination of K0 and K1. For a combined X-band and C-band time series the fusion of the before mentioned two combinations yielded the best results. Permanent open water (W) displayed in blue, the change class water to land (W–L) in light blue, flooded vegetation to land (V–L) in light green, flooded vegetation to irrigated fields (V–F) (with land in the transition between) in green, the dynamic class of rapidly changing irrigated fields (F– L/L–F) in red, and the two land classes land/permanent vegetation (L1) in dark green, and land/soils and rocks (L2) in beige.
Figure 7. Multitemporal classification results for (a) TerraSAR-X (K0–K3–K4), and (b) RADARSAT-2 (K0–K1)
Though classification using the same classes (water, flooded vegetation, irrigated fields and non-wetland) on a single dual-pol image was only successful for TerraSAR-X but not RADARSAT-2, the multitemporal classification proofs that using the full time series stack a classification is possible, and the same information can be extracted from X-band dual-co-polarimetric as well as C-band dual-cross-dual-co-polarimetric channels, as well as a combination of the two sensors.
4.3 Classification Accuracy Assessment
The validation dataset was created based on the same four optical VHR and HR data as the training set, see Chapter 3.2). The same number of AOIs per class – with approximately the same size – was used for validation. No AOIs were excluded, and no post-classification filtering was applied, in order to guarantee that the direct output of the pixel-based multitemporal classification of the Kennaugh element time series stacks is validated. Hence, the validation results refer to the whole monitoring system, including acquisition, data processing, and automated interpretation.
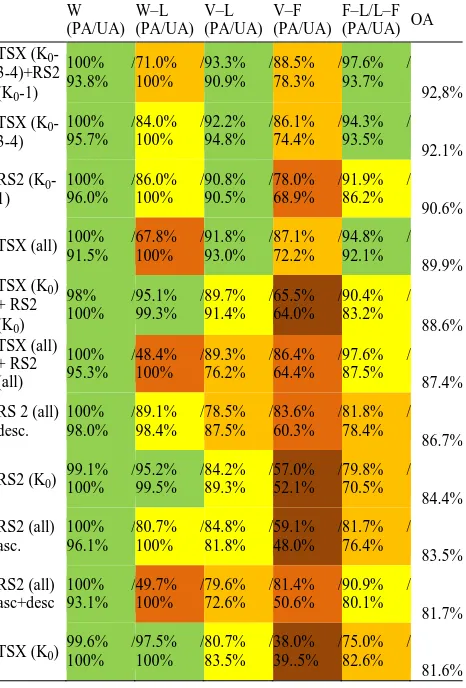
Table 2 shows the results of the accuracy assessment in terms of Producer’s Accuracy (PA) and User’s Accuracy (UA) for the five relevant wetland change classes, and the Overall Accuracy (OA) of the entire classification that includes also further land classes. Combinations of different Kennaugh elements, polarizations (dual-co-pol and dual-cross-pol), and wavelengths (C-band and X-band) – separately and in synergy – are ranked
according to the classification OA (Table 2). The five relevant wetland classes out of the seven change classes are: permanent open water (W), water to land (W–L), flooded vegetation to land (V–L), flooded vegetation to irrigated fields (V–F), and dynamic irrigated fields to land or land to fields (F–L/L–F).
A color scale was applied on the validation table based on five categories formed by a joint evaluation of the percentage of the Producer’s and User’s accuracy of correctly classified pixels: (1) both PA and UA between 90 and 100% (green), (2) the lower value between 80% and 90% and the higher one can be the same or above (yellow), (3) the lower value between 70% and 80% (light orange), (4) one value lower than 70% (dark orange), and (5) both values lower than 70% (brown). We consider values lower than 70% accuracy as not applicable for wetland classification or monitoring.
W
Table 2: Accuracy Assessment for the multitemporal classification of different polarimetric, frequency, and Kennaugh element combinations of the TerraSAR-X and RADARSAT-2 time series, ranked by Overall Accuracy (OA)
The main findings of the validation are that multitemporal classification results for (a) TerraSAR-X (K0–K3–K4), and (b) RADARSAT-2 (K0–K1), or a multi-frequency combination of the two sensors are most suitable for wetland extent delineation and the derivation of wetland change classes. Furthermore, the comparison between ascending and descending orbit of RADARSAT-2 was tested, with the result that descending orbit is favoured for the multitemporal wetland classification of Lac Bam, reasons for that are subject to further investigations.
In all experiments the class permanent open water (W) was classified with a very high accuracy. The class W–L is best detected using only K0 – the sum of intensities of the dual-pol data – in TSX (K0), RS-2 (K0) and TSX (K0) + RS-2 (K0). Therefore it can be concluded that the monitoring of open water or open water to land can be very successfully carried out with SAR intensity data and without any contribution of the polarimetric channels. This, however, is not the case for many studies considering also vegetation or cultivation in wetlands.
TerraSAR-X dual-co-pol data is favoured for applications where the classification of flooded vegetation is of high relevance. This is reflected in very high classification accuracies for the class V–L with TSX using (1) all Kennaugh elements, (2) the most relevant Kennaugh elements K0–K3–K4, or (3) a combination of the most relevant Kennaugh elements from TSX and RS-2. Using RS-2, very high accuracies of V–L could be achieved with the favoured Kennaugh elements K0–K1, but the class V–F shows only low accuracies in the order of PA 78%/UA69%. Using TSX, the class V–F achieves higher accuracies in the order of 86–87% PA and 72%–74% UA. A combination of TSX and RS-2 would also lead to the desired results. Using only K0 is the worst choice for classifying V–F, and so are most other combinations of RS-2 data. Moreover, the single image classification (see Figure 4) showed that TSX data could very successfully delineate flooded vegetation, whereas RS-2 data could not.
As far as irrigated fields are concerned, the best choice is to work with the Kennaugh elements of TSX or the combined most significant Kennaugh elements of TSX and RS-2. Tendentially, all other combinations involving RS-2 show too low accuracies (70–82% for PA and UA) for F–L/L–F, and as well lower accuracies for V–F, as mentioned in the previous paragraph. Therefore TSX dual-co-pol data can be considered to be preferred for monitoring irrigated fields.
5. CONCLUSIONS
Especially in semi-arid regions, where water reservoirs and wetlands are the main water resource during the long dry season, monitoring of water – including waters of flooded or floating vegetation – is vital, as is monitoring of irrigation activities around wetlands extracting water from the wetland. In this study an approach for wetland delineation and the derivation of change classes from regular, dense time series is performed, using different dual-polarimetric SAR data time series. Using a well-established supervised classification method, based on a maximum likelihood classifier, a multitemporal classification approach developed for wetland monitoring using TerraSAR-X data could be successfully transferred onto RADARSAT-2 data. This study represents the first multi-frequency wetland monitoring using partial-polarimetric SAR data.
This study presents the first multi-frequency data fusion using the Kennaugh element framework. A fusion of the TerraSAR-X and RADARSAT-2 Kennaugh elements could therefore be applied, leading to similarly high classification accuracies (almost 93% overall accuracy) than when using the TerraSAR-X time series with the most significant Kennaugh elements: K0, K3, and K4 (92% overall accuracy). Moreover, using the two most significant Kennaugh elements K0 and K1 of RADARSAT-2 high classification accuracies (almost 91% overall accuracy) could be achieved.
The classification accuracies exceeded our expectations. Open water and the change class water to land could be well detected in the Kennaugh element K0 from both sensors, representing the total intensity from co-polarized HH-VV TerraSAR-X data, as well as cross-polarized HH-HV RADARSAT-2 data. For all classes related to flooded vegetation or irrigated cultivation, the use of multi-polarized imagery, and therefore the use of further Kennaugh elements, is required. The classification accuracies for change classes of flooded vegetation to land or to irrigated fields were significantly higher for most combinations involving TerraSAR-X dual-co-polarimetric data, with respect to RADARSAT-2 dual-cross-polarimetric data. The multitemporal classification approach could be successfully transferred from TerraSAR-X to RADARSAT-2 data.
While the results in this study focus on wetland extent, delineation, and dynamic change classes, a next step would be to perform time series analysis to derive seasonal start, duration and end maps and time series of areal change for every time step in the dense polarimetric SAR time series. This has been successfully done by Moser et al. (2016), using dual-polarimetric TSX time series for wetland monitoring. This work shows, that the approach classifying every image in the time series cannot be directly transferred to dual-cross-pol C-band data – such as RADARSAT-2 – and there is still a need for further research. This study concludes to an outlook on future possibilities and the feasibility to establish an operational monitoring system of prime importance for a whole region, like semi-arid areas in West Africa. RADARSAT-2 data can be considered to be comparable with the European Space Agency’s Sentinel-1 (S-1) data, which are systematically acquiring data since April 2015 over a large coverage of African areas, including the Lac Bam site. In May 2016 there will be a full S-1 time series from the rainy to the dry season acquired, such as the one used in this work. With a repeat frequency of 12 days for Sentinel-1 – that is reduced to 6 days once both satellites are in orbit – there is great potential for the exploitation of regular dual-cross-polarimetric time series over wetland sites. Besides Sentinel-1, also the TSX time series will be further on acquired for the Lac Bam site. This study shows that a coverage of 2–3 images per year – as it is currently applied for many wetland studies and projects – is not enough to correctly delineate wetlands or capture their seasonal dynamics and change classes.
We also want to emphasize that this the approach applied in this work was based on a basic, well-established and statistically comprehensible supervised maximum likelihood classification method, that was only minimally modified enhancing the weight of K0 for open water classification. The performance in terms of processing time was very good, and – without any other pre-classification time series analysis or post-classification filtering – very high classification accuracies could be achieved on a per-pixel level. We therefore conclude to the suitability of the multi-scale, multi-frequency Kennaugh element framework, and the potential of dual-polarimetric SAR time series for wetland classification and monitoring.
ACKNOWLEDGEMENTS
We would like to acknowledge the work of Dr. Raymond Quedraogo, who performed the field campaign in October 2015, and provided valuable expertise. The authors acknowledge the use of RADARSAT-2 data via the ESA third party mission proposal “Wetland monitoring using synergies of C-Band and X-Band multi-polarized SAR”, and TerraSAR-X data via the TerraSAR Science Service proposal “LAN2000 Wetland monitoring and water stress in sub-Saharan West Africa”.
REFERENCES
Betbeder, J., Rapinel, S., Corgne, S., Pottier, E. & Hubert-Moy, L. 2015. TerraSAR-X dual-pol time-series for mapping of wetland vegetation. ISPRS Journal of Photogrammetry and Remote Sensing.
Brisco, B., Schmitt, A., Murnaghan, K., Kaya, S. & Roth, A. 2013. SAR polarimetric change detection for flooded vegetation. International Journal of Digital Earth, 6, 103-114.
Gallant, A. L., Kaya, S. G., White, L., Brisco, B., Roth, M. F., Sadinski, W. & Rover, J. 2014. Detecting Emergence, Growth, and Senescence of Wetland Vegetation with Polarimetric Synthetic Aperture Radar (SAR) Data. Water, 6, 694-722.
Henderson, F. M. & Lewis, A. J. 2008. Radar detection of wetland ecosystems: a review. International Journal of Remote Sensing, 29, 5809-5835.
Martinis, S., Kuenzer, C., Wendleder, A., Huth, J., Twele, A., Roth, A. & Dech, S. 2015. Comparing four operational SAR-based water and flood detection approaches. International Journal of Remote Sensing, 36, 3519-3543.
Moser, L., Schmitt, A., Wendleder, A. & Roth, A. 2016. Monitoring of the Lac Bam Wetland Extent Using Dual-Polarized X-Band SAR Data. Remote Sensing, 8, 302.
Moser, L., Voigt, S., Schoepfer, E. & Palmer, S. 2014. Multitemporal Wetland Monitoring in Sub-Saharan West-Africa Using Medium Resolution Optical Satellite Data. IEEE Journal of Selected Topics in Applied Earth Observations and Remote Sensing (J-STARS), 7, 3402-3415.
RAMSAR. 2016. Ramsar Convention on Wetlands [Online]. Available: http://www.ramsar.org/ [Accessed April 2016].
Santoro, M. & Wegmüller, U. 2014. Multi-temporal synthetic aperture radar metrics applied to map open water bodies. IEEE Journal of Selected Topics in Applied Earth Observations and Remote Sensing (J-STARS), 7, 3225-3238.
Schmitt, A. & Brisco, B. 2013. Wetland Monitoring Using the Curvelet-Based Change Detection Method on Polarimetric SAR Imagery. Water, 5, 1036-1051.
Schmitt, A., Wendleder, A. & Hinz, S. 2015. The Kennaugh element framework for scale, polarized, multi-temporal and multi-frequency SAR image preparation. ISPRS Journal of Photogrammetry and Remote Sensing, 102, 122-139.