CAMERA CALIBRATION IN 3D MODELLING FOR UAV APPLICATION
Hideharu Yanagi a, c, Hirofumi Chikatsu b
a Japan Association of Surveyors, 1-33-18, Hakusan, Bunkyo-ku, Tokyo 113-0001, Japan – [email protected] b Division of Architectural, Civil and Environmental Engineering, Tokyo Denki University, Hatoyama, Hiki-gun,
Saitama 350-0394, JAPAN - [email protected]
c
School of Science and Engineering, Tokyo Denki University, Hatoyama, Hiki-gun, Saitama 350-0394, JAPAN
Commission V, WG V/4
KEY WORDS: Consumer grade digital camera, Calibration, Lens distortion, 3D modelling
ABSTRACT:
In recent times, small types of Unmanned Aerial Vehicles (UAVs) have been receiving attention in areas such as 3D modelling, maintenance engineering, and personal interest (hobby) usage. However, the payload a small type of UAV is able to carry is limited. Given these circumstances, small consumer grade digital cameras are often used for UAV photogrammetry with small types of UAV. Though, digital photogrammetry using the consumer grade cameras is enormously expected in various application fields such as UAV photogrammetry.
There is a large body of literature on camera calibration. However, the lens distortion of small consumer grade digital cameras is still an issue from the viewpoint of accuracy aspect.
The authors have been investigating camera calibration using various cameras. However, small consumer grade digital cameras, which is called as entry-cameras, have an accuracy degradation problem. The issue was addressed by conducting calibration tests using two kinds of consumer grade digital cameras, each with a resolution of 12 mega pixels. This paper presents the results of an investigation into the cause of accuracy degradation in digital photogrammetry using entry-cameras.
1. INTRODUCTION
In recent times, small types of UAVs have been receiving more attention, because they are increasingly in areas such as 3D measurements, maintenance engineering, and for hobby use and so on, because of their simplicity of operation and lightness of body. However, the payload a small type of UAV is able to transport, is limited. Therefore, small consumer grade digital cameras are often used for UAV photogrammetry. On the other hand, consumer grade digital cameras have been rapidly gaining interest, with many low-priced consumer grade models available on the market. Therefore, performance evaluations for consumer grade digital cameras have been investigated from the viewpoint of digital close range photogrammetry (Fraser, 1997, Habib and Morgan, 2003).
In digital close range photogrammetry using consumer grade digital cameras, lens distortion is one of important parameters. The authors have been investigating lens distortion using various cameras (Chikatsu and Takahashi, 2009). From these results, digital close range photogrammetry using consumer grade digital camera is expected for various application fields. However, not all of these cameras are necessarily suitable for use in 3D modeling. In particular, small consumer grade digital cameras which are called as entry-cameras have an accuracy degradation problem. In other words, in some of these cameras the accuracy is not improved after camera calibration.
In order to resolve the issue, at first, the factors for accuracy degradation have been investigating using a camera of which the accuracy did not improve after camera calibration. Finally, the authors’ results led them to propose a calibration method for improving the accuracy of the abovementioned camera in this study.
2. EXPERIMENTS
2.1Cameras
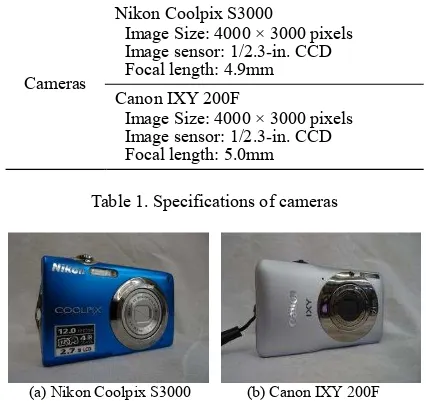
In order to confirm the camera which does not show the accuracy improvement after calibration, the two consumer grade digital cameras shown below was investigated in this study (Table 1, Figure 1).
Cameras
Nikon Coolpix S3000
Image Size: 4000 × 3000 pixels Image sensor: 1/2.3-in. CCD Focal length: 4.9mm Canon IXY 200F
Image Size: 4000 × 3000 pixels Image sensor: 1/2.3-in. CCD Focal length: 5.0mm
Table 1. Specifications of cameras
Table 1 lists the specifications of both of the selected cameras and shows that the image and sensor size of both models are the same. However, it was unclear whether both of the cameras were equipped with the same sensor, because the technical
(a) Nikon Coolpix S3000 (b) Canon IXY 200F
Figure 1. Consumer grade digital cameras
The International Archives of the Photogrammetry, Remote Sensing and Spatial Information Sciences, Volume XL-4/W5, 2015 Indoor-Outdoor Seamless Modelling, Mapping and Navigation, 21–22 May 2015, Tokyo, Japan
This contribution has been peer-reviewed.
details of the image sensor had not been published. Furthermore, the technical details of the lens used in each camera were also unknown.
2.2Test Target
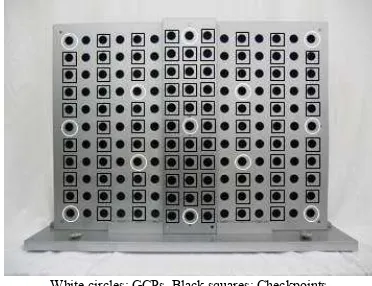
Figure 2 shows a test target that was used in the study. The size of the test target is H: 640 mm, W: 480 mm and D: 20 mm. The black circular targets in the test target were manufactured with an accuracy of ±0.05 mm. The diameter of each circular target was 20 mm, and the targets were arranged in intervals of 40 mm. The height of the central targets (three rows in the center) was 20 mm. GCPs (ground control points) and checkpoints were arranged as shown in Figure 2. The pixel coordinates of these points were obtained as the area gravity by using image processing procedures.
2.3 Lens distortion model
In this study, the lens distortion was evaluated by using Brown’s model (Brown, 1971), as follows.
coordinates; x, y are the measured image coordinates; K1, K2, and K3 are coefficients of radial distortion; P1 and P2 are coefficients of tangential distortion.3. EXPERIMENTAL RESULTS
In this study, five stereo images were taken as a base-height ratio of 0.34, and altitudes of 667 mm and 736 mm for the S3000 and IXY 200F, respectively. The focal length of both lenses was set to the largest possible wide angle setting. Camera calibrations were performed using bundle adjustment based on 13 GCPs (Figure 2).
Figure 3 shows the average of five calculations as the experimental results. In Figure 3, the proportional accuracy of the results was computed using equation (2). In addition, Figure 3 also shows the curve of the standard error, which was computed using equations (2) and (3) from the results of the camera calibration for the various cameras.
2
and σZ are the root mean square error for the check points.
p
the pointing accuracy (estimated to be 0.1 pixels (Schaefer and Murai, 1988)).
The calculated results obtained for the IXY 200F closely approximated the curve of the standard error in Figure 3. On the other hand, those obtained for the S3000 were positioned further from the curve of the standard error.
Figure 4 shows the results of the camera calibration for cases in which lens distortion was not considered and considered. Note: Figure 4 shows that the proportional accuracy was normalized by the standard error.
Number of pixels MPixel
Standard error White circles: GCPs, Black squares: Checkpoints
Figure 2. Test target
(3)
(1)
Figure 4. Results of camera calibration
0
The International Archives of the Photogrammetry, Remote Sensing and Spatial Information Sciences, Volume XL-4/W5, 2015 Indoor-Outdoor Seamless Modelling, Mapping and Navigation, 21–22 May 2015, Tokyo, Japan
This contribution has been peer-reviewed.
From Figure 4, it is clearly understood that the accuracy of the IXY 200F in terms of lens distortion was improved after camera calibration. However, the accuracy of the S3000 was not improved, even after camera calibration.
Based on these results, the cause of accuracy degradation in the S3000 was investigated and the results are presented in the next section.
4. VERIFICATION
4.1 Distortion
In previous experiments, the S3000 was calibrated by using equations (1). However, Brown’s model is able to divide into six models such as shown in Table 2 (Wakutsu and Chikatsu, 2011). Therefore, suitable distortion model for the S3000 is investigated in this session.
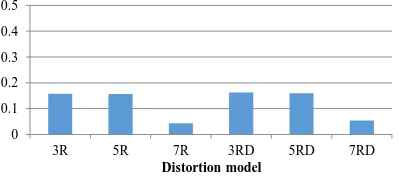
Figure 5 shows the results of the camera calibration using each of the six distortion models and the results show the proportional accuracy normalized by the standard error. Figure 5 indicates that the 3rd polynomial function with tangential distortions model (3RD) shows the best accuracy. However, the accuracy show quite different low accuracy from the viewpoints of digital photogrammetric aspect.
The cause of the degradation in accuracy was investigated using the 3RD model.
4.2 Chromatic aberration
As one of the cause of accuracy degradation, chromatic aberration was considered. Chromatic aberrations are well known to occur in relation to the wavelength of light. The green channel in an image has been attention for correction of the chromatic aberration, and Guan, et al. were corrected chromatic aberration based on green channel (Guan, H., 2005).
Consequently, the green channel images that were extracted from the stereo image were used for the investigation in this study.
Figure 6 shows the results of the camera calibration for which the proportional accuracy was normalized by the standard error using the normal images and the green channel image. The distortion model that was used was the 3RD model.
It can be seen that the result for which the green channel images were used show almost the same accuracy as the result obtained
using a normal image. It is concluded that chromatic aberration does not show a significant factor.
4.3 Verification Result
In this study, lens distortion models and chromatic aberration were investigated. However, neither of these approaches led to an improvement in the accuracy. At this stage, the reason as to why it has not been possible to improve the accuracy is not known, neither is it known whether the aberration of the lens is responsible.
On the other hand, there are many consumer grade digital cameras with an internal image processing function. It is unclear as to whether image distortion is automatically corrected by the internal image processing function.
Thus, it is necessary to treat the situation as a black box by inferring whether the image data are automatically adjusted. If automatic image adjustment were used, it would be difficult to obtain an original image which had not been adjusted.
Therefore, a calibration method for the camera which does not improve the accuracy even after calibration was proposed in this study.
5. PROPOSED CALIBRATION METHOD
5.1 Verification for distortion
In this study, it was taken center image to confirm the shape of the distortion for the S3000.
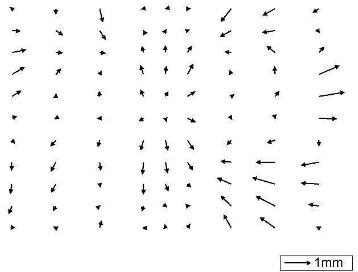
Figure 7 shows the result of the camera calibration based on the center of the image using the 3RD model.
Generally, it is known that lens distortion is symmetrical and many calibration models were developed based on symmetrical images. However, as seen in Figure 7, it is clearly understood that lens distortion for the S3000 is not symmetrical.
Generally, it is well known that wide-angle lenses, such as that of the S3000, show barrel distortion. The barrel distortion was automatically adjusted previously using internal image processing function. The influence of the distortion adjustment appears in the center of the right-left row in the image. Therefore, the proposed calibration method focuses on this row for adjustment to compensate for the large distortion, such as shown in the row on the right in Figure 7.
Figure 5. Results of camera calibration
0 0.1 0.2 0.3 0.4 0.5
3R 5R 7R 3RD 5RD 7RD
Distortion model
Figure 6. Results of camera calibration using green channel images
0 0.1 0.2 0.3 0.4 0.5
Normal images Green channel images
Distortion model Coefficients of lens distortion Abbreviation
Radial distortion Tangential distortion
3rd polynomial function K1 - 3R
5th polynomial function K1,K2 - 5R
7th polynomial function K1,K2,K3 - 7R
3rd polynomial function and tangential distortions K1 P1,P2 3RD 5th polynomial function and tangential distortions K1,K2 P1,P2 5RD 7th polynomial function and tangential distortions K1,K2,K3 P1,P2 7RD
Table 2. Distortion model and its abbreviation (Wakutsu and Chikatsu, 2011)
The International Archives of the Photogrammetry, Remote Sensing and Spatial Information Sciences, Volume XL-4/W5, 2015 Indoor-Outdoor Seamless Modelling, Mapping and Navigation, 21–22 May 2015, Tokyo, Japan
This contribution has been peer-reviewed.
5.2 Proposed Method
In the first step of the proposed method, the block in which the largest distortion occurs (e.g., the row on the right side in Figure 7) is extracted after ordinary camera calibration. Second, a fitted curve is computed by using GCPs in the extracted block. The extracted points are adjusted along the computed fitted curve (Figure 8). And in order to adjust left-right, the block of opposite side was computed by the same procedure. Finally, the camera calibration is repeated using all the points, including the adjusted points.
It is observed that the points of the row on the right side in the center of the image (Figure 7) have the largest distortion. Therefore, the points in this row were adjusted by using the proposed method. Furthermore, the row on the left side was also adjusted in this work.
Figures 8 and 9 show the adjusted points of the side rows on the left and right. Table 3 compares the results of an ordinary camera calibration and the proposed method. These results show that the proportional accuracy was improved by the proposed method. However, the accuracy improvement was still issue.
6. CONCLUSION
In this study, the cause of accuracy degradation for consumer grade digital cameras, known as entry-cameras, was investigated. It is concluded that one of the reason for the accuracy could not improve even after procedure of camera calibration is not known whether the internal image processing function had been applied previously or not. The second reason is the occurrence of asymmetrical distortion.
Generally, it is well known that wide-angle lenses, such as that of the S3000, show barrel distortion. Previously, this distortion was automatically adjusted using the internal image processing function. The influence of the distortion adjustment appears in the center of the right-left row in the image.
Based on the above facts and assumption, the authors proposed a camera calibration method for the camera that does not show accuracy improvement after the camera calibration procedure. As a result of our method, it is observed that the accuracy shows some improvement and is expected to be improved even more by upgrading the proposed method.
References
Fraser, C.S., 1997. Digital camera self-calibration. ISPRS Journal of Photogrammetry and Remote Sensing, Vol. 52, No. 4, pp. 149-159.
Habib, A. and Morgan, M., 2003. Automatic Calibration of Low-Cost Digital Cameras. Journal of Optical Engineering, Vol. 42, No. 4, pp. 948-955.
Chikatsu, H. and Takahashi, Y., 2009. Comparative Evaluation between Consumer Grade Cameras and Mobile Phone Cameras for Close Range Photogrammetry. Videometrics, Range Imaging, and Applications X, Proc. of SPIE, 74470H.
Brown, D. C., 1971. Close-range camera calibration, Photogrammetric Engineering, Vol. 37, No. 8, pp. 855-866. Schaefer, H. and Murai, S., 1988. Automated target detection for real-time camera calibration, Proceeding of 9th Asian Conference on Remote Sensing, pp. H.2-4–1-H.2-4-8.
Wakutsu, R. and Chikatsu, H., 2011. Practical calibration for consumer grade digital camera with integrated high zooming lens. Videometrics, Range Imaging, and Applications XI, 80850T.
Guan, H., Shiraishi, K.,Watanabe, K., Fukuoka, H. and Ohashi, K., 2005. Digital Image Correcting Method for Digital Camera. Ricoh Technical Report, Vol. 31, pp. 103-110.
Figure 7. Result of camera calibration of center image
Figure 9. Adjusted points (opposite of side)
: Original points (GCP)
: Original points (check points) : Adjusted points
Normal Proposed method
Proportional
accuracy 1/1906 1/3108
Table 3. Result of proposed method Figure 8. Adjusted points
: Original points (GCP)
: Original points (check points) : Adjusted points The International Archives of the Photogrammetry, Remote Sensing and Spatial Information Sciences, Volume XL-4/W5, 2015
Indoor-Outdoor Seamless Modelling, Mapping and Navigation, 21–22 May 2015, Tokyo, Japan
This contribution has been peer-reviewed.