HOW TO ACHIEVE SMART CITIES THROUGH SMART COMMUNICATION AND
REPRESENTATION OF URBAN DATA
R. M. Donolo a,b , M. Donolo c
a InfoMaths PhD school, Laboratoire d’InfoRmatique en Images et Systèmes d’information - LIRIS - Institut National
des Sciences Appliquées -INSA- Lyon, France
b GeoInformation PhD school, Faculty of Civil Engineering, Università degli Studi di Roma Tor Vergata,
Rome, Italy - [email protected]
c Culture and Territory PhD school, Faculty of Letters and Philosophy, Università degli Studi di Roma Tor Vergata,
Rome, Italy - [email protected]
KEY WORDS: Smart cities, web-GIS, ICT, smart communication, smart representation, smart visualization, smart citizen
ABSTRACT:
Urban environment is developing in different, complex and rapid ways. The challenge of the moment is to face this issue within the model and the philosophy of the “smart city”. The biggest obstacles to the implementation of a smart city model can be probably found in the structure of urban areas and in the stratification of old urban infrastructures that make difficult the setting of new technological infrastructures. Moreover it is difficult to implement the smart city model also in the new urban areas, because these areas are often the result of recent urban sprawl and shapeless urbanization, and it is difficult to set the new technological infrastructures. But in this paper we would like to highlight that in addition to these problems, there is another obstacle in the implementation of the smart city model: the difficulties encountered by the authorities in the information of citizens about the problems and the resources of a city. We think that a smart information and communication system, with the support of web-GIS and smart visualization, will surely help the implementation of smart city models and smart grid models and the inclusion of citizens in the management of cities and countries.
1. MANUSCRIPT 1.1 Smart communication for smart cities
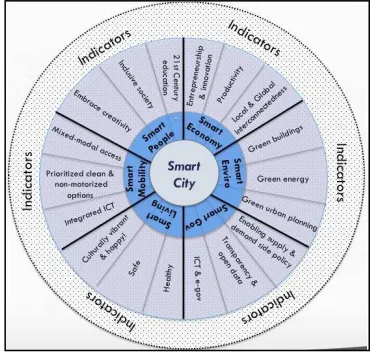
The smart city philosophy is spreading and developing in Europe and in the world. Actually the most current question and challenge for cities's governors is: “which are the infrastructures required to respond to smart cities’ requirements?”. In the “smart city wheel” in fig.1, there is a synthetic answer; all the elements necessary to have a smart city are shown; smart
economy, smart environment, smart government, smart living, smart mobility and smart people. In particular under the “slice” smart government it is written ICT and e-government.
Urban performance depends not only on the city's hard infrastructure (physical capital), but also on the availability of information and communication and of social infrastructure (intellectual capital and social capital). We would like to highlight the growing importance of Information and Communication Technologies (ICTs), social and environmental capital in developing the competitiveness of cities. Social and environmental capital are useful to distinguish smart cities and what goes under the name of digital or intelligent cities. Physical and virtual ICT infrastructures and networks are fundamental to develop smart cities and also to connect smart cities among them. The awareness and the knowledge of how to use territorial resources and energy are fundamental. Moreover the information of citizens is one of the possible ways to solve the problems of social inclusion, social cohesion, and public participation of citizens in the government of the city; considering the number of people that live far from the
city-centre and in suburb areas, the challenge is to let the citizens feel part of a city, of a community, but also of a self-sufficient system; only in this way the citizens can be active and involved in the research of the solutions of urban and extra-urban problems.
Fig. 1; Smart city wheel by Boyd Cohen
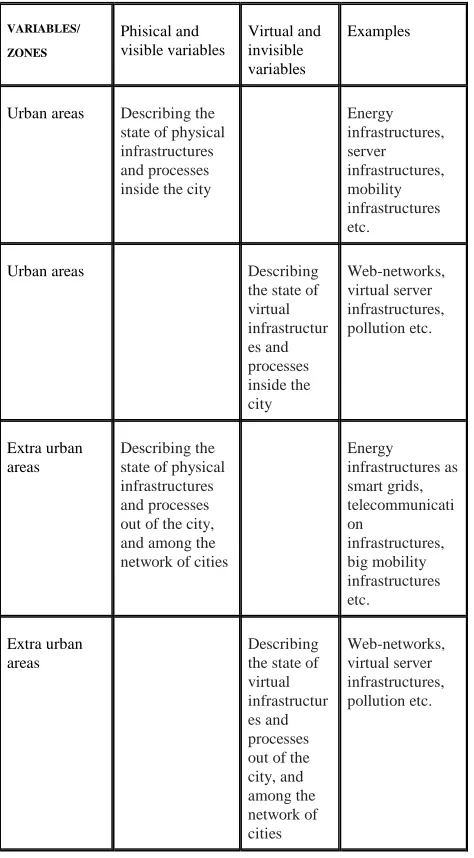
It is important to understand that the use of smart communication it is necessary to implement the smart city model; in particular the communication between governors and citizens not only concerns visible variables and physical infrastructures, but also invisible variables and virtual infrastructures, as shown in table n.1.
International Archives of the Photogrammetry, Remote Sensing and Spatial Information Sciences, Volume XL-4/W1, 29th Urban Data Management Symposium, 29 – 31 May, 2013, London, United Kingdom
VARIABLES/
ZONES
Phisical and
visible variables Virtual and invisible variables
Examples
Urban areas Describing the state of physical
areas Describing the state of physical infrastructures
areas Describing the state of virtual
Table 1; Topics of smart communication for smart cities
The techniques of a smart communication are similar for visible or invisible variables, and are based on the representation of urban and extra-urban infrastructures and processes on thematic maps.
1.2 Smart representation for smart communication
A good communication about the topics related to urban and extra-urban life and management, is surely improved and supported by the use of representation of urban and extra-urban data, phenomena and processes on maps. But a true smart communication it is not based only on a traditional
representation, but on a smart representation. For smart representation we mean the exploitation of all the techniques available to improve the visualization of data on a map. First of all it is important the organization in synthetic indicators of the data to be represented, then the use of the techniques of mixing these indicators, and finally it is useful to take advantage of all the visual variables, of all the spatial dimensions (even the third spatial dimension), and of all the surfaces of representation that are available in the system to be represented. As a final step the use of these “intelligent maps” has to be implemented online through the use of WebGIS. A partial list of visual variables according to J. Bertin (Bertin, 1967) it is shown in fig. 2.
Fig. 2; J. Bertin's selection of visual variables.
Concerning the importance of the third dimension in the environment is developing in every direction; the main reasons of this fast development are the population growth, the increasing number of vehicles, and the need of new buildings. It is more and more important the height of the new buildings, this is why the third dimension is so fundamental in the representation of modern and smart cities. The third dimension is important not only to represent the buildings, but also to represent the visible and invisible phenomena that happen at several meters above the ground, that can be represented using the surfaces of the buildings as a support. The third dimension can also be used to represent visible or invisible phenomena and variables that have no relationship with the height and that don’t need to be represented on the surface of a building (like
International Archives of the Photogrammetry, Remote Sensing and Spatial Information Sciences, Volume XL-4/W1, 29th Urban Data Management Symposium, 29 – 31 May, 2013, London, United Kingdom
crimes). This is the case of phenomena that happen in towns but that usually are not represented in 3D maps. The advantage of the third dimension is that maps can be more clear as more variables can be represented in the third dimension. Moreover variables and indicators can be associated with other visible or invisible variables related among them, like crimes and population density, as shown in figures 3 and 4.
Fig. 3; Crimescape in New York, http://www.nadiaamoroso.com
Fig. 4; Population density in New York, http://www.nadiaamoroso.com
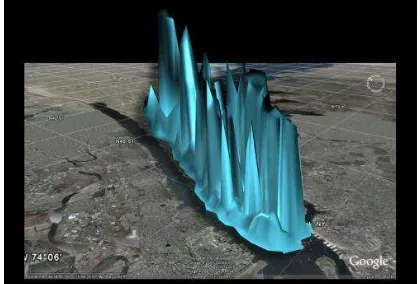
Sometimes for invisible variables or invisible “forces” that are present in a city, and especially when these variables have no spatial reference, it is more difficult to see the structure of these variables and even more difficult to see the effects of domination. Hegemonic networks can be physical and visible as technological infrastructures, (internet or telephonic network) or virtual and invisible infrastructures as the social media networks. Dr. Paul M. Torrens at Arizona State University’s Department of Geography, is conducting research into the invisible geography of wireless "wi-fi" Internet signals over downtown Salt Lake City, UT. He has produced an image that represents wi-fi Internet signals graphically and it is part of a work to map "urban data clouds" and to study the geography of
new emerging technologies and their impact on dense urban environments.
Fig.5; The invisible geography of wireless "wi-fi" Internet signal, Salt Lake City, UT.
The same representation can be used to highlight financial infrastructures; the banks can be represented as visible nodes in the network, while the transactions and the transfer of money are invisible and can be represented as virtual lines of the network. In fig. 6 the representation of an invisible financial indicator such the “market value” in New York.
Fig. 6; Market value in New York, http://www.nadiaamoroso.com
1.3 Conclusions
It is interesting to notice in these smart representations of urban data, that often there is an attended thread or relation in the variables represented, while sometimes through the observation of these representations we can discover critical points in the towns and latent conflicts between physical networks and virtual-networks. These analysis are useful in the attempts to promote and raise the information of the citizens and the civicness necessary for a democratic governance of the towns.
International Archives of the Photogrammetry, Remote Sensing and Spatial Information Sciences, Volume XL-4/W1, 29th Urban Data Management Symposium, 29 – 31 May, 2013, London, United Kingdom
References from Books:
Bertin J., 1967. Sémiologie Graphique. Les diagrammes, les réseaux, les cartes. With Marc Barbut [et al.], Gauthier-Villars, Paris.
Campbell T., 2012, Beyond smart cities: how cities learn and innovate, Routledge.
Calafati A. G., 2009, Economie in cerca di città, Donzelli, Roma.
Granelli A., 2012, CITTÀ INTELLIGENTI ? Per una via italiana alle Smart Cities, Luca Sossella Editore, Roma.
Masi D., 2010, Go green: il nuovo trend della comunicazione. Fausto Lupetti Editore, Bologna.
Kresl P. K. - Ietri D. editors, 2012, European Cities and Global competitiveness, Elgar, Celtenham.
References from websites:
http://www.nadiaamoroso.com
International Archives of the Photogrammetry, Remote Sensing and Spatial Information Sciences, Volume XL-4/W1, 29th Urban Data Management Symposium, 29 – 31 May, 2013, London, United Kingdom