CONSTRUCTION OF DISASTER PREVENTION MAP
BASED ON DIGITAL IMAGERY
Hee-Cheon Yun a, Jong-Bai Kim a, Jong-Sin Lee a, In-Joon Kang b
a Dept. of Civil Engineering, College of Engineering, Chungnam National University
99 Daehak-ro, Yuseong-gu, Daejeon, ROK - hcyoon@cnu.ac.kr, kr3538@naver.com, merrysc@lycos.co.kr
b School of Civil and Environmental Engineering, College of Engineering, Pusan National University
Busandaehak-ro 63beon-gil, Geumjeong-gu, Busan, ROK - ijkang@pusan.ac.kr
Commission VII, WG VII/6
KEY WORDS: Disaster Prevention Map, Digital Image, Hazard Attribute Information, Disaster Management
ABSTRACT:
As global warming and has caused the number of abnormal changes, lots of damage has arisen recently due to natural disaster. To prevent and cope with these annually repeated natural hazards, the disaster management is required including the systematic management. Currently the national and related agencies are producing the flood hazard map and flood e map in case of disaster management and recovery, and coping with the disaster using them for building recovery plan, grasping disaster status and cause analysis. The hazard map is the one which indicates the calamity danger districts including the degree of risk in general and called the degree of disaster risk map or disaster expectation map and it means the map which marks the hazard zones by estimating the areas to coping with the natural disaster in the inclusive concept. Now that such hazard map should be understood easily from the place of the person concerned in the disaster, the production of new type of map which can be easily understood visually rather than the map by diagram. In this study, new concept disaster prevention map based on digital image and disaster attribute information was constructed. The various disaster information such as the areas of inundation of river, submergence and landslip caused by severe rain storm and typhoon is marked in the hazard information map, and the rescue route and refuge area are also marked by setting the damage-expected areas. The disaster prevention map is able to support quick decision making for disaster management and resident education.
1. INTRODUCTION
As the land use is getting advanced in the late 20's century, appearances of disaster are showing diversification and mass scale trend. Currently, the country and authorities concerned are coping with disasters by producing flood hazard map, disaster prevention map, etc. at disaster management and recovery and using them for establishing recovery plans, understanding disaster realities and analysing causes. Especially, flood hazard map, the one which marked various information such as flooding information, evacuation information, etc. on the map for easy understanding for the purpose of minimizing damage of flood such as bank destruction, overflow, etc. is produced mainly by local governments and distributed to residents. Much concern is paid on using and production method of flood hazard map which indicates flooding areas and studies on flood disaster combined with GIS are underway(Geoffrey C. P. et al., 2002, Kaab A, 2000, Kim, K. L. et al., 2004, Kim, Y. S. et al.,2000, Shidawara M., 1999). This study produced a more readable and more understandable concept of disaster prevention map by fusing the existing constructed digital terrain map with digital images.
2. STUDY AREA
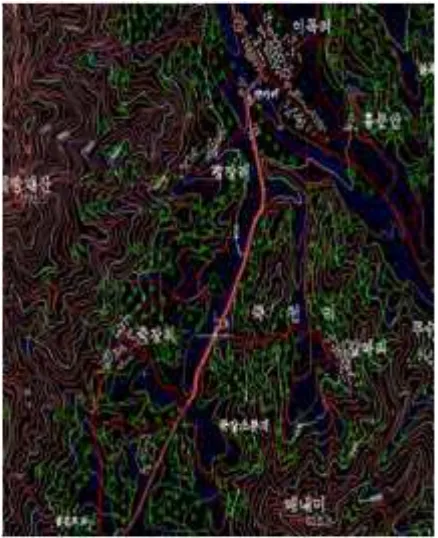
The study object area, Anseong-Myeon, Muju-Gun(35˚52’N, 127˚38’E) is bordered with Seolcheon-Myeon and Buksang-Myeon, Geochang Buksang-Myeon, Kyungsangnam-Do with boundary of Dumun Mt., Deokyu Mt., etc. to north, Donghyang-Myeon,
Jinahn-Gun to west, Gyebuk-Myeon, Jangsoo-Gun to south and Jeoksang-Myeon to north. It is located in a west side basin of Deokyu Mt., Sobaek Mountains and is a typical inland basin of Korean West South area. It belong to the south inland type climate group and was chosen as the object site for producing disaster prevention map as it rains heavily in the winter and river flood and landslide are inclined to arise due to frequent rainfall in the summer.
Figure 1. Study area
International Archives of the Photogrammetry, Remote Sensing and Spatial Information Sciences, Volume XXXIX-B7, 2012 XXII ISPRS Congress, 25 August – 01 September 2012, Melbourne, Australia
3. CONSTRUCTION OF DISASTER PREVENTION MAP
In this study, disaster prevention map was produced through the pre-constructed digital terrain map, digital image and disaster attribution information to understand disaster situation and damage scale promptly and comprehensively.
By achieving digital aerial photograph(25cm ground resolution) of the study object area, ortho-images were produced and mosaic and split processing were performed after color correction and editing. After completing structured edition for photos, symbol works for object facilities and attribution information related with disaster were input. Related information was made into files after performing supplementation and visual inspection. Each separate disaster prevention map was made to correspond to the 1:5,000 scale digital map and this corresponds to disaster information map using the existing digital terrain map. Fig. 2 shows the production flow of disaster prevention map.
Figure 2. Flow chart
3.1 Classification of Hazard Information
To construct disaster prevention map, basic information such as basic map, flooding information, evacuation information, etc. should be investigated and collected. Digital terrain map was used as a basic map for constructing map and other information such as roads, public facilities, etc. were used. As for flood information, flood trace information and flood estimation information were used and for evacuation information areas for evacuation, evacuation population and shelter and evacuation facility information were used.
3.2 Digital Map and Digital Image
The digital terrain map of 1:5,000 scale by National Geographic Information Institute was used to produce disaster prevention map and digital images achieved by a large scale frame camera, UltraCamD were used. Data for disaster prevention map was
secured by masking into administrative districts using image processing software of mosaic images in the study object site. Fig. 3 is the digital terrain map of the study object site and Fig. 4 shows the digital images.
Figure 3. Digital map
Figure 4. Digital imagery
International Archives of the Photogrammetry, Remote Sensing and Spatial Information Sciences, Volume XXXIX-B7, 2012 XXII ISPRS Congress, 25 August – 01 September 2012, Melbourne, Australia
3.3 Data Fusion
This study combined disaster attribution information using digital maps and digital images to construct new disaster prevention map. Base map was drawn using AutoCAD Map and disaster attributions required for disaster prevention map such as the optimal evacuation routes, flood trace area, landslide – estimated areas, etc. at the time of disaster occurrences were classified through analysis of constructed disaster attribution. Data for construction disaster prevention map was secured by separating flood areas and landslide areas and disaster attribution information such as constructed digital images, flood trace areas, landslide-estimated areas, shelters and evacuation route, etc. was combined. Fig. 5 is the base map for producing disaster prevention map and Fig. 6 and Fig. 7 show the disaster prevention map completed.
Figure 5. Base map
Figure 6. Disaster Prevention Map(1)
Figure 7. Disaster Prevention Map(2)
4. APPLICATION OF DISASTER PREVENTION MAP
This study produced a new type of disaster prevention map through combining digital map, digital images and disaster attribution information. The produced disaster prevention map is marking various kinds of disaster materials such as overflow, flooding, landslide areas arisen from local downpour, typhoon, etc. and evacuation routes and shelters, etc. were marked by establishing estimated damage areas.
The disaster prevention map produced enables everyone to understand easily by marking evacuation instructions, evacuation routes and shelters at disaster occurrence and would be used for disaster awareness learning for basic disaster situation and future disaster possibility as part of disaster awareness enhancement of local residents. In the future, if a nationwide web-based damage investigation system is constructed, it is expected the objectivity of damage investigation is maintained, simplification of administrative procedures can be achieved and it would contribute to rapid recovery plan and using in disaster learning.
5. CONCLUSION
This study produced a new type of disaster prevention map through combining digital map, digital images and disaster attribution information and conclusions were made as following.
Through fusion of digital map, disaster attribution information and digital images, a new type of disaster prevention map which can overcome the limit of schematic expression which is hard to understand was constructed. Disaster prevention map produced through combine of digital images and digital terrain map can be used as materials of disaster information including the existing disaster attribution information and for disaster prevention and can be used as basic materials for realizing GIS based disaster prevention system. If a nationwide web-International Archives of the Photogrammetry, Remote Sensing and Spatial Information Sciences, Volume XXXIX-B7, 2012
XXII ISPRS Congress, 25 August – 01 September 2012, Melbourne, Australia
based damage investigation system is constructed subsequently, the objectivity of damage investigation is maintained, simplification of administrative procedures can be achieved and it would contribute largely to rapid recovery plan and using in disaster learning.
REFERENCES
Geoffrey C. P, Jack A. S., Christopher A. F. and Steven W. R., 2002. Three-dimensional mapping of geomorphic controls on flood-plain hydrology and connectivity from aerial photos, Geomorphology, 48(4), pp. 329-347.
Kaab A., 2000. Photogrammetry for early recognition of high mountain hazards: New techniques and applications Physics and Chemistry of the Earth, Part B: Hydrology, Oceans and Atmosphere, 25(9), pp. 765-770.
Kim, K. L., Ra, Y. H., Ahn, B. G., Park, S. J., 2004. Confidence Improvement of Serial Cadastral Map Edit Using Ortho Image, Korean Journal of Geomatics, 22(3), pp. 253-259.
Kim, Y. S., 2000. Institutionalization of Flood Hazard Map Design and Development of Flooding Area Estimation Technique (I), National Institute for Disaster Prevention, pp. 1-35.
Shidehara M., 1999. Flood hazard map distribution, Urban Water, 1(2), pp. 125-129.
International Archives of the Photogrammetry, Remote Sensing and Spatial Information Sciences, Volume XXXIX-B7, 2012 XXII ISPRS Congress, 25 August – 01 September 2012, Melbourne, Australia