REMOVING SHADOWS FROM HIGH-RESOLUTION URBAN AERIAL IMAGES
BASED ON COLOR CONSTANCY
Q. YE a, *, H. XIE b, Q. XU c
a. Department of Surveying and Geo-Informatics, Tongji University, 200092 Shanghai, China – ([email protected]) b.Shanghai Municipal Institute of Surveying and Mapping, 200063 Shanghai, China – ([email protected]); c.Research Center for Remote Sensing and Spatial Information, Tongji University, 200092 Shanghai, China – ([email protected])
Commission Ⅲ, ICWG Ⅲ/Ⅶ
KEY WORDS: Aerial images, Color constancy, Shadow detection, Shadow removal, Shades of Gray.
ABSTRACT:
A method is explored to remove tall building shadows in true color and color infrared urban aerial images based on the theory of color constancy. This paper first uses the specthem ratio and Otsu threshold segmentation methods to detect building shadows on urban aerial true color and color infrared aerial images. Then, based on the shadow detection result, one of the color constancy algorithms SoG (Shades of Gray) is used to remove the shadows in aerial images with different p values of the Minkowski norm. Finally, the shadow removal results with different p values have been compared by brightness, contrast and average gradients. The experiments show that the result of this method based on color constancy has a good visual effect, and different from general scene image shadow removal, the aerial images get the best shadow removal result when p is 2. It means the two types of aerial images should not be simply regarded as gray world images.
* Corresponding author.
1. INTRODUCTION
Shadows, caused when an object obscures the light source, are inevitable in remote sensing images. The grey value and contrast of shadow area is obviously small in the images. Those shadows are typically of a different color than the rest of the image. Shadows seriously affect the visual quality, especially for a metropolitan aerial image with a stripe shadow area caused by high-rise buildings. As well as visual quality problems, shadows cause difficulty in feature extraction, pattern recognition and image matching of shadow area images, especially for the high-resolution urban aerial images. Therefore, shadow removal is an issue to be studied in aerial remote sensing image processing.
There is some research on shadow detection and removal, but most considers either the images in motion or normal nature scene images. The commonly used methods for shadow removal include: An integral model, removing shadow impact in log domain of original image, thereby obtaining the image in which the shadow effects are removed (Finlayson et al., 2002a) (Fredembach et al., 2005); Using color scale factors, calculating shadow region scale factor, and using this factor to get the grey value of shadow region without shadow impact (Arbel et al., 2007). The above two methods involve complex calculations, and the last method often performs poorly if there are complicated textures in the image.
Shor et al propose a method for shadow detection and removal, it needs seed in detection, and a pyramid-based restoration process is then applied to produce a shadow-free image, image inpainting along a thin border is finally applied to ensure a seamless transition between the original and the recovered regions. The result is better for normal nature scene images, but the effect on aerial images is not known. Since it needs seed, it is not an automatic tool (Shor et al., 2008).
Compared with a normal nature scene image, remote sensing images have a large imaging area; every pixel’s grey and color
value are the complex composite function ofsolar radiation, sky illumination, and ground reflection. Therefore the illumination condition is much more complicated than a normal scene. Some image enhancement algorithms, such as homomorphic filtering, can improve the shadow impact in aerial images; but the shadow region is a different color than the non-shadow region when this algorithm is used in shadow removal. Some alternate approaches have been proposed on shadow removal in remote sensing images. Suzuki used a dynamic shadow compensation method based on color and spatial analysis to remove shadows in aerial images (Susuki et al., 2000); the disadvantage of this method is it requires a probability model in advance. Finlayson use the Retinex algorithm to remove shadows (Finlayson et al., 2002b), but this algorithm is based on the hypothesis that the world is grey, so it would not garner good results except for grey areas in aerial images. The above research focuses on true color images. Research on color infrared aerial images is uncommon.
In this paper, our goal is to detect shadows and remove them from true color or color infrared high-resolution urban aerial images. The Shades of Gray (SoG) algorithm based on the color constancy theory is chosen to remove shadows (especially building shadows). Then some image quantitative indexes are calculated in order to analyze the result of the shadow removal. The optimum parameters in SoG algorithm for aerial image shadow removal are obtained from the quantitative analysis.
2. THEORY OF COLOR CONSTANCY
Human beings have the tendency for a color to look the same under widely different viewing conditions. Color constancy is maintained in different lighting conditions (within a certain range). The illumination condition is non-standard in shadow regions. Non-standard illuminations are by definition those that are more or less different from daylight illumination (Joint ISO/CIE Standard ISO 11664-2:2007(E)/CIE S 014-2/E:2006).
The shadow removal transforms the non-standard illumination condition to the standard and defines the grey value in standard. So the key is to estimate the standard light source condition. According to Von Kries model:
0
0
illumination condition, and is key for shadow removal.
There are several algorithms based on color constancy used for light source color estimation. These algorithms are divided into two types.
One estimate light source method is based on low-level features in images; it uses the Gray-World (Buchsbaum, 1980), Max-RGB (Land, 1971), and Gray-Edge algorithms (Weijer, 2007). In order to estimate light source color, they have different assumptions; Gray-World algorithm supposes the average of scene reflectance is achromatic in the image, Max-RGB supposes the maximum RGB band value is light source color, and Gray-Edge supposes differential mean value of scene reflectance is achromatic in the image. All these algorithms can do better in light source color estimating when their assumptions are satisfied. Other estimate light source methods exist based on statistics, the typical one being Color by Correlation algorithm (Finlayson, 2001). This algorithm has good general advantages, but needs a lot of a priori knowledge, and the result is not of high precision.
On the basis of these studies, G Finlayson and Trezzi proposed a Color Constancy algorithm: the Shades of Gray algorithm (SoG) (Finlayson, 2004). It assumes that the shadow and the non-shadow region of image should meet the Minkowski norm. Minkowski norm (Equation (2)):
Where, e is the light source value of one current scene, f is the grey value of each image band, and k is scale factor. p is the exponential parameter of the norm; it can be an arbitrary integer of [1, ) . p determines the weight of each grey value in the
p , SoG turns into Gray-World one). This method is easy in calculation and does not need a priori statistics models. For some normal nature scene images, it results in best shadow removal when p6, according to the experiment (Finlayson,
2004).
Aerial remote sensing images have a large imaging area, which include different types of landmarks and landforms. Especially in the downtown area of a megalopolis, the shadow of high-rise buildings will cause a very significant light condition difference in adjacent ground objects. So we should study whether the
algorithms developed for general scene images are suitable for aerial remote sensing images, especially for color infrared aerial images; and their applicability for aerial images. Since the Gray-World and Max-RGB are a special case of the Shades of Gray algorithm, we focus on the SoG algorithm and propose this method to remove shadow on urban aerial images, and analyze the suitability and effect for high-resolution aerial images. After the experiment, we draw a conclusion.
3. SHADOW REMOVAL METHOD BASED ON COLOR CONSTANCY
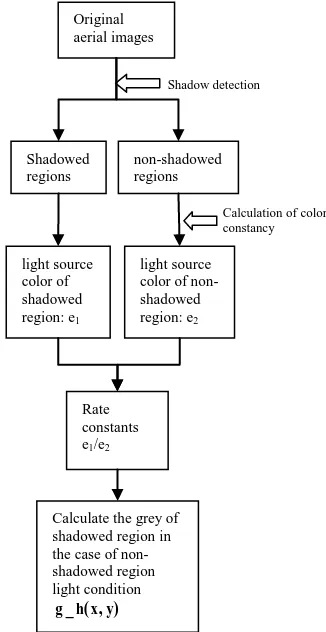
The process of shadow removal in this paper is depicted here as Figure 1:
Figure 1. Shadow removal processing
3.1 Shadow detection
Since shadow detection is the basis in shadow removal processing, shadow detection accuracy directly affects the effect of shadow removal. There are two types of shadow detection methods:
A method based on object geometric features, which requires sensor attitude, illumination conditions, as well as a digital surface model (DSM) of the object. Because it is not easy to get building geometric information or DSM in metropolitan area, this method of shadow detection is difficult.
A method based on the image grey characteristics in the shadow region, which does not need other information except the grey value; because of this it is applied more commonly. The traditional method is based on a histogram, but this is not suitable for the vast majority of remote sensing images; it is especially not suited for color infrared aerial images.
Shadow detection
In this paper, we use a shadow detection method that based on the image grey characteristics, which does not need the geometric information or DSM. Under the analysis and test result, the specthem ratio and Otsu threshold segmentation methods is applied to detect building shadows on urban aerial true color and color infrared aerial images in this paper. Segmentation is done in HSI space (H-hue, S-saturation, I-intensity), where the building shadows are detected and the impact of grass land and trees is eliminated based on mathematical morphology. Shadows in urban aerial image are detected by this method:
First, transform the color image from RGB space to HSI space;
from this the intensity component (I) and the hue component (H) are obtained.
Second, get the specthem ratio image (( H + 1 ) / ( I+ 1 )) ; the
grey value of the shadow region is larger than non-shadowed region in the ratio image.
Third, apply Otsu method to determine the segmentation
threshold for the ratio image; the image is then segmented and the candidate shadow region image is obtained.
Lastly, extract the building shadow in the candidate shadow
region image (the result from the third step) based on the morphological differences between building shadows and trees. The segmentation image is filtered by median filter in order to remove noise first; the resulting image is then processed by morphological erosion and dilation operators to get the shadow region.
By shadow detection, the aerial image is distinguished as shadowed regions and non-shadowed one.
3.2 Shadow removal
After shadow detection, the aerial image is divided into two parts, a shadowed region and a non-shadowed region. The light source color is determined based on this result. The light source color value is calculated and the shadow is removed in the band image of the original aerial color image. The step of the shadow removal is as follows:
Changing shadow region light conditions to the standard illumination condition, as follows:
g
_ ( , )
b x y
i
g x y e
i( , )
1_i (4)Likewise, the standard illumination condition of non-shadowed region is calculated.
h b x y
_ ( , )
i
h x y e
i( , )
2 _i (5)After the above processing, g b x y_ ( , )i has the same
illumination condition as h b x y_ ( , )i . Then the illumination condition of shadow region is like equation (4).
g
_
h x y
i( , )
g x y e
i( , )
2 _ie
1_i (6)Finally, the shadow removal image is obtained as follow:
new
_
S x y
i( , )
g
_
h x y
i( , )
h x y
i( , )
(7)4. EVALUATION OF AERIAL IMAGE SHADOW REMOVAL RESULT
Visual evaluation is a commonly used approach for quality assessment in the shadow removal. However, in this paper some quantitative evaluations are utilized to assess quality based on statistics. Here, statistical characteristic indices include brightness, contrast and average gradients.
Brightness is calculated as equation (8)
1 1
To reflect the black and white contrast of image, the contrast is calculated as follows:
5. EXPERIMENTAL RESULTS AND ANALYSIS
Two high-resolution urban aerial images from Shanghai are employed in this experiment, both true color and color infrared aerial images containing evident building shadows in each image. The experiment was done with MATLAB program. In order to analyze and get the proper p value of the Minkowski norm for aerial image shadow removal, we test different p (from 1 to 10) on the above two aerial images in the experiment.
5.1 Shadow removal experiment with true color aerial images
The test image is a true color image, dated Dec. 2008; image area is Pudong, Shanghai city, with a resolution of 25cm/pixel and an image size of 2340×3624 pixel. In the experiment, the original image size was reduced to 585×906pixel; the space resolution therefore is 1m/pixel.
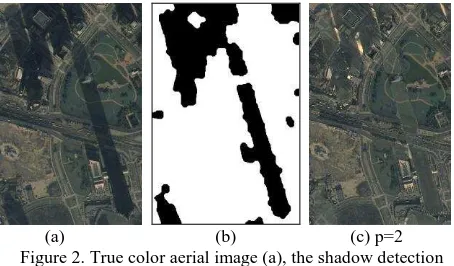
(a) (b) (c) p=2 Figure 2. True color aerial image (a), the shadow detection
result (b) and the results of shadow removal (c)
Figure 2 (a) is the original image. Figure 2 (b) is the shadow detection result; the black area is shadow region (note a few errors at the edge of shadow region). Figure2 (c) is the shadow removal image when p is 2.
In order to analyze the shadow removal result, the brightness, contrast and average gradients of the shadow and non-shadow regions are calculated separately in the original image band. Then, after shadow removal, the corresponding indices are determined likewise in the shadow region. Table 1 is the result. The three statistic indexes of shadow region are changed, when the value of p is from 1 to 10 in shadow removal processing. Figure 3 includes three statistical index trend charts of the shadow region.
From the shadow removal resulting image, Table.1 and the statistical trend chart (Figure 3), we find:
(1)Compared with the non-shadow region, the brightness decreases more in the shadow region. It decreases sharply especially in red band because most light in the shadow region is scattered light from the sky, which contains more short-wave and less long-wave. The contrast and average gradients in the shadow region decreased also, but the degree of decrease in the three bands is the same.
(2)The SoG shadow removal algorithm based on Color Constancy can recover the light conditions in shadow regions, especially for the red band. After shadow removal with p= 2, the shadow region brightness in the red band is improved mostly from 38.76 to 70, and the contrast is close to the value in non-shadow region. Average gradients is improved too, but not improved as much as brightness and contrast.
(3) From Figure 3, the change trend lines show that the brightness, contrast, and average gradients of three bands increase at first, then decrease slowly when p is a value from 1~10. They achieve maximum value when p is 2. And when p=2, it also makes the shadow contrast and average gradients have a good agreement with this in non-shadow region. (4) The visual effect shows that the shadow region color is similar to non-shadow region and no visible color error exists after the shadow removal processing with the SoG algorithm. It follows that true color aerial images obtain the best result of shadow removal when p equals 2 in this experiment.
Table 1. The brightness, contrast and average gradients of the true color aerial image before and after shadow removal
brightness contrast average gradients
r g b r G b r g b
Shadow region 38.7595 47.7784 51.6944 14.8921 13.8919 10.7231 1.0603 1.1871 1.1193
p
1 76.1407 81.1661 74.9656 29.2543 23.5993 15.5501 2.0828 2.0167 1.6231
2 76.1734 81.1875 75.3754 29.2669 23.6056 15.6351 2.0837 2.0172 1.632 3 73.5785 80.0854 75.4451 28.2699 23.2851 15.6496 2.0127 1.9898 1.6335 4 68.6354 77.6796 75.0428 26.3707 22.5856 15.5662 1.8775 1.93 1.6248 5 63.2672 74.2705 74.059 24.3081 21.5944 15.3621 1.7307 1.8453 1.6035 6 58.979 70.612 72.511 22.6605 20.5307 15.041 1.6134 1.7544 1.57 7 55.9903 67.3786 70.6091 21.5122 19.5906 14.6465 1.5316 1.6741 1.5288 8 53.9821 64.8395 68.6673 20.7407 18.8523 14.2437 1.4767 1.611 1.4868 9 52.6118 62.9679 66.9317 20.2142 18.3081 13.8837 1.4392 1.5645 1.4492 10 51.6335 61.6297 65.5043 19.8383 17.9191 13.5876 1.4124 1.5313 1.4183 non-shadow region 76.1361 81.1607 74.9599 29.3503 23.6779 17.4938 3.4292 3.2324 2.6647
Figure 3. Change trends of brightness, contrast and average gradients when p value from 1~10 in true color aerial image shadow
removal
5.2 Shadow removal experiment with color infrared aerial images
The test image is a color infrared aerial image of Shanghai from 1998; the resolution is 20cm/pixel. In the experiment, the original image was reduced to 704×734pixel; the resolution is 0.4m/pixel. The Figure 4(a) is the original image. The Figure 4(b) is the shadow detection result; the black area is shadow region. Figure 4(c) is the shadow removal image when p is 2.
(a) (b) (c) p=2 Figure 4. Color infrared aerial image (a) the shadow detection
result (b) and the results of shadow removal (c)
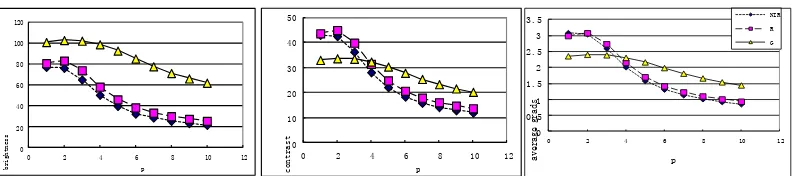
Using the same method as 5.1, the brightness, contrast and average gradients are calculated separately in the shadow and non-shadow regions. Table 2 is the result. Figure 5 includes three statistical trend charts of the shadow region, when p is from 1 to 10 in shadow removal processing.
From Table 2 and the Figure 5, we draw the following conclusions:
(1) Compared to true color aerial images, the brightness decreases more sharply in shadow region, especially in red and
infrared band. The contrast and average gradients decreases similarly; the degree of decrease is the same in all three bands, and the result is the average gradients decreases much more than in the true color image experiment.
(2)When p is 1,or 2, the SoG shadow removal algorithm can recover the brightness, contrast and average gradients of shadow region in color infrared aerial images, especially for the brightness in red and infrared band. The values are close to non-shadow region after non-shadow removal.
(3)From Figure 5, the change trend lines show that the brightness, contrast and average gradients in red and green bands achieve maximum value when shadows are removed using p=2. In the infrared band the three statistical characteristics achieve maximum when p=1; the three values decrease a little when p=2. Infrared band measured values sharply drop when p is from 2 to 10. When p is 2, the shadow contrast and average gradients have a good agreement with non-shadow. Considering the brightness, contrast, and average gradients improvements in the shadow region across red, green, and infrared bands, the color infrared aerial image achieves the best overall result of shadow removal when p values 2 in this experiment.
(4)The visual effect shows that when p is 1, 2, or 3, the shadow region color is closer to non-shadow region after the shadow removal; the effect is better than the resulting image when p is a large value. There is no visible color error after the shadow removal processing with the SoG algorithm. It follows from this experiment that for color infrared aerial images, best results for shadow removal are obtained when p equals 2.
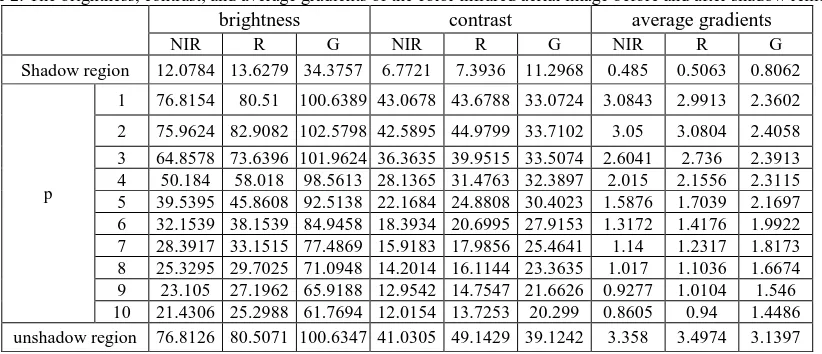
Table 2. The brightness, contrast, and average gradients of the color infrared aerial image before and after shadow removal
brightness contrast average gradients
NIR R G NIR R G NIR R G
Shadow region 12.0784 13.6279 34.3757 6.7721 7.3936 11.2968 0.485 0.5063 0.8062
p
1 76.8154 80.51 100.6389 43.0678 43.6788 33.0724 3.0843 2.9913 2.3602
2 75.9624 82.9082 102.5798 42.5895 44.9799 33.7102 3.05 3.0804 2.4058 3 64.8578 73.6396 101.9624 36.3635 39.9515 33.5074 2.6041 2.736 2.3913 4 50.184 58.018 98.5613 28.1365 31.4763 32.3897 2.015 2.1556 2.3115 5 39.5395 45.8608 92.5138 22.1684 24.8808 30.4023 1.5876 1.7039 2.1697 6 32.1539 38.1539 84.9458 18.3934 20.6995 27.9153 1.3172 1.4176 1.9922 7 28.3917 33.1515 77.4869 15.9183 17.9856 25.4641 1.14 1.2317 1.8173 8 25.3295 29.7025 71.0948 14.2014 16.1144 23.3635 1.017 1.1036 1.6674 9 23.105 27.1962 65.9188 12.9542 14.7547 21.6626 0.9277 1.0104 1.546 10 21.4306 25.2988 61.7694 12.0154 13.7253 20.299 0.8605 0.94 1.4486 unshadow region 76.8126 80.5071 100.6347 41.0305 49.1429 39.1242 3.358 3.4974 3.1397
0
Figure 5. Change trends of brightness, contrast and average gradients when p value from 1~10 in color infrared aerial image shadow removal
6. CONCLUSION
In this paper, the Shades of Grey (SoG) algorithm based on color constancy is explored to remove shadows in true color and color infrared urban aerial images. The shadow removal effect is analyzed when p (the parameter in Minkowski norm) takes different values in each experiment. Three quantitative evaluations are utilized to assess quality of the shadow removal result. The main results can be described as follows:
(1)For aerial images, whether true color or infrared, based on the shadow detection result, the Shades of Grey algorithm can achieve better shadow removal results when p takes a proper value. In this paper, this method obtained the best overall shadow removal effect asp2. It is different from the normal nature scene images which get good shadow removal result when p=6. (2)Whenp1, SoG turns into Gray-World one. But the result is not as good when p1. It follows that aerial images can not be regarded simply as grey world images, and the algorithm based on Gray-World assumptions is not suitable for aerial images.
Since the method used here does not need a priori statistics models, and is easier in calculating shadow removal, it is more suitable for large area aerial image shadow removal.
REFERENCE
Arbel, E. and Hel-Or, H. 2007. Texture-Preserving Shadow Removal in Color Images Containing Curved Surfaces. In: Proceedings of IEEE Computer Society Conference on Computer Vision and Pattern Recognition. Minneapolis, Minnesota, U.S.A., pp.1-8
Buchsbaum, G., 1980. A Spatial Processor Model for Object Colour Perception. Journal of Franklin Institute, 310(1), pp. 1-26.
Finlayson, G.D., Hordley, S.D., and Hubel, P., 2001. Color by correlation:A simple, unifying framework for color constancy. IEEE Transaction Pattern Analysis Machine Intelligence, 23(11) pp. 1209-1221.
Finlayson, G.D., Hordley, S.D., and Drew, M.S., 2002a. Removing Shadows from Images. In: Proceedings of the 7th European Conference on Computer Vision, Copenhagen, Denmark , Part IV, pp. 823-850
Finlayson, G.D., Hordley, S.D., and Drew, M.S., 2002b. Removing Shadows from Images Using Retinex. In: Proceedings of IS&T/ SID Tenth Color Imaging Conference: Color Science and Engineering Systems, Technologies, and Applications, Scottsdale, Arizona, USA, pp.73-79.
Finlayson, G.D., and Trezzi, E., 2004. Shades of gray and colour constancy. In: Proceedings of IS&T/ SID Twelfth Color Imaging Conference, Scottsdale, Arizona, USA, pp. 37–41.
Fredembach, C., et al.., 2005. Hamiltonian Path Based Shadow Removal. In: BMVC, Oxford,U.K., Vol. 2, pp. 502–511.
Land, E. and McCann, J., 1971. Lightness and Retinex Theory. Journal of the Optical Society of America, 61(1),pp. 1-11
Shor, Y. and Lischinski, D., 2008 The Shadow Meets the Mask: Pyramid-Based Shadow Removal. Computer Graphics Forum, 27(2), pp. 577-586
Susuki, A., Shio, A., Arai, H., and Ohtsuka, S., 2000. Dynamic shadow compensation of aerial images based on color and spatial analysis. In: Proceedings of the 15th International Conference on Patten Recognition, Barcelona, Catalonia, Spain, Vol.Ⅰ, pp.317-320.
Weijer, J. van de, Gevers, Th., Gijsenij, A., 2007. Edge-Based Color Constancy. IEEE Transaction Image Processing, 16(9), pp. 2207-2214.
Joint ISO/CIE Standard ISO 11664-2:2007(E)/CIE S 014-2/E:2006
http://www.cie.co.at/index.php/index.php?i_ca_id=484
ACKNOWLEDGEMENTS
The aerial images dates was supported by Shanghai Municipal Institute of Surveying and Mapping in this research. The author would like to thank for the help.
0 20 40 60 80 100 120
0 2 4 6 8 10 12
brightness p
0 10 20 30 40 50
0 2 4 6 8 10 12
contrast p
0 0.5 1 1.5 2 2.5 3 3.5
0 2 4 6 8 10 12
average
grads
p
NIR R G