CONCEPT AND IMPLEMENTATION OF AN ARCHITECTURE FOR THE IMMEDIATE
PROVISION OF GEODATA IN DISASTER MANAGEMENT
S. Fleischhauer, F.-J. Behr, P. Rawiel
Stuttgart University of Applied Sciences, Germany – [email protected], franz-josef.behr | [email protected]
Commission IV, WG IV/4
KEY WORDS: Disaster management, rapid mapping, geodata, OpenStreetMap, remote sensing, free software, free data
ABSTRACT:
Statistics prove that the number of disasters, especially weather-related, increased during the last decades. This leads to high demands on participants in disaster management processes. To meet these requirements the provision of geodata, as a part of the information base, plays a key role. A preliminary theoretical consideration points out the evaluation of the benefits of geodata in disaster scenarios as well as the requirements for the provision of geoinformation products and systems in this field of application. There already exist several approaches that differ in the used data, the functionalities or the concept in general.
As an alternative, this work introduces a new architectural concept of immediate geodata provision for disaster management based on the usage of free data and free software components. A system consisting of several free software components forms the basis of this approach. With vector data from OpenStreetMap and remote sensing data from the United States Geological Survey a batch script driven geoinformation system creates map tiles or images for end-users in disaster management within minutes.
1. INTRODUCTION
Disasters are an omnipresent phenomenon. Statistics of the Munich Re (Munich Re, 2015) and of the United Nations Office for Disaster Risk Reduction (UNISDR, 2012) show an increasing number of disaster situations during the last three decades. The devastating effects are evidenced by the total extent of damage. From 2000 to 2012 material damages in the amount of US$ 1.7 trillion and a loss of 1.2 million human lives worldwide were recorded (UNISDR, 2013).
These numbers show the importance of efficient disaster management. One fundamental element in the disaster management process is the basis of information and in particular geospatial information, as the Spatial Data Infrastructure Germany (GDI-DE) committee, an initiative of public authorities in Germany, states (Ostrau et al., 2013): „The Management […] of disasters require static geodata (for certain areas) as well dynamic geodata (i.e. flooded areas).“ The general benefits of the use of geoinformation in disaster scenarios are discussed in the VALID study by the United Nations. Its results regarding the economic and strategic value of geodata are presented in the following section.
From a variety of solutions using geoinformation to support the disaster management this work will present some existing concepts to point out the state of the art.
A requirements specification will show criteria taken into consideration during the conception phase of the approach presented here.
Some definitions will be helpful for the further sections. IFRC (2011) describes a disaster as “a serious disruption of the functioning of society, which poses a significant, widespread threat to human life, health, property, infrastructure or the environment, whether arising from accident, nature or human activity, whether developing suddenly or as the result of long-term processes, but excluding armed conflict.”
According to the Copernicus website (European Commission, 2017) rapid mapping “consists of the […] provision (within hours or days) of geospatial information in support of emergency management activities immediately following an emergency event. The products are standardized.” Reference Maps show the boundaries, names and unique identifiers of standard geographic areas, as well as major cultural and physical features, such as roads, railroads, coastlines, rivers and lakes, i.e. topography, delineation maps the extents of the area affected by the disaster and grading maps present the assessment of the damage grade and its spatial distribution.
The main part of this paper describes an alternative concept of a geoinformation system (GIS) for disaster management support. The description of the process and its architecture depicts the functionality of the system with all its components. We will show that a mapping solution can provide reference maps and delineation maps rapidly within minutes or a few hours. The reference map will be created based on the worldwide data coverage of the OpenStreetMap database, complemented by remote sensing imagery. Assessment of the damage grade could be done additionally afterwards based on remote sensing products.
2. THEORETICAL CONSIDERATION
Before going into details regarding the technical implementations of geoinformation systems in disaster scenarios it has to be determined which status geoinformation has in the field of disaster management. These theoretical considerations provide the basis for subsequent sections.
2.1 Benefit assessment of geodata in disaster management
One basic question is to what amount users benefit from the usage of geoinformation in disaster situations. The United Nations Platform for Space-based Information for Disaster Management and Emergency Response (UNSPIDER) in The International Archives of the Photogrammetry, Remote Sensing and Spatial Information Sciences, Volume XLII-4/W2, 2017
cooperation with the Joint Board of Geospatial Information Societies (JB GIS) and scientists from the University of Amsterdam created the VALID study to evaluate the economic value and the strategic and operational benefits (Altan et al., 2013)
The 2009 flood catastrophe in Namibia served as case study for the monetary evaluation. Stakeholders had to estimate the potential cost savings for the use of a flood early warning system in this scenario, yielding a final result of 40% of cost savings.
The strategic and operational benefits were determined by two online surveys. In the first survey participants had to choose the most important geoinformation items for disaster management. Out of the responses the ten most frequently mentioned (regarding floods, earthquakes and drought) were used again in a second survey (Altan et al., 2013:23). The participants had to estimate the strategic and operational benefits of these ten geoinformation products. The responses showed appreciation for risk and vulnerability maps. For all strategic and operational aspects of every single product the benefits were valued medium to high. Benefits for preventions measures, economic loss reduction and for the usage in both disaster prevention and management were estimated high.
2.2 Requirements specification
In the conception of geoinformation processing systems it is important to incorporate the conditions and requirements of the field of application, i.e., disaster management. The Open Geospatial Consortium (OGC) has published a discussion paper with theoretical aspects for the conception of information structures in disaster management (Penman et al., 2015). Out of these considerations the following points can be adapted for the conception and usage of geospatial information structures for rapid mapping:
Reliable data basis, Data of different sources, Predefined formats and interfaces,
Possibility to integrate optional new data sources, Application of data under supervision of experts, Access control by user authentication,
Comprehension and transparency of information, Predefined symbology.
Other aspects mentioned by Penman et al. (2015), like alert messages and independent network, are not part of the solution presented here. Further design considerations however were:
Rapid provision of geodata,
Availability for everyone instead of a limited group of people, especially for local actors (IFRC, 2011:9), and accordingly,
Usage of free/respectively open source software and data.
3. STATE OF THE ART
After the evaluation of the benefits of geodata and the delineation of the requirements some existing approaches in the field of disaster mapping are described.
3.1 Collaborative remote sensing data acquisition
In 2000 the International Charter "Space and Major Disasters" was created to allow an immediate data acquisition for disaster
situations. The approx. 16 members of this charter include inter alia the French and the European Space Agency, the National Oceanic and Atmospheric Administration (NOAA) and the Indian Space Research Organization (ISRO) (https://www.-disasterscharter.org/web/guest/about-the-charter). To activate the charter an access point is established. Authorized institutions can start a data acquisition cycle in case of a disaster situation through request to this access point. Under the administration of a project manager appropriate satellite data from a wide range of sensors are requested from archives as well as active satellites are programmed to record new images of the disaster area. The acquired data can be processed in the affected country to create maps via interpretation algorithms and analysis. For example radar images are suitable for the identification of flood areas whereas optical images are appropriate for fire disasters or visual damage mapping after earthquakes (Danzeglocke, 2014).
As charter member the DLR Center for Satellite Based Crisis Information (ZKI) provides a permanent service for the rapid provision, processing and analysis of satellite imagery (Voigt, 2013). The focus of this approach is the current provision of processed imagery and its analysis and interpretation, not of reference maps. However, as DLR (2017) points out, the “Charter has committed resources to support [only] some specified authorised users such as relief organisations as well as civil protection and defence organisations with free of charge satellite data in order to help mitigating the effects of disasters”.
3.2 Volunteered Geographic Information (VGI)
If a disaster strikes often the OSM community like the Humanitarian OpenStreetMap Team (HOT, http://hotosm.org/) is activated to collect additional data for the affected area. Following the crowd sourced approach of OpenStreetMap the data are contributed on a voluntary basis. The contribution for the mitigation of the Haiti earthquake disaster is one of most prominent examples (Neis et al., 2010, Neis & Zielstra, 2014).
According to the Annual report there were five activations of HOT in 2015 due to disaster situations. In the course of the earthquake in Nepal in April 2015 over 8000 people contributed more than 13 million edits (HOT, 2015).
3.3 Flood hazard maps
Altan et al. (2013) have shown that flood related geoinformation items have a high impact in disaster management. Flood hazard maps visualize information about potential flood hazards from a relatively common to an extreme scenario and probability (Müller et al., 2009). Like flood risk maps they are defined in the EU Floods Directive 2007/60/EG. This policy instructed the member countries of the European Union to create both type of maps for significantly vulnerable areas until 22 December 2013. According to article 10 of the policy these maps have to be available for the public. German states provide them web-based by administrative authorities.
Based on a risk analysis for every area in accordance with the determinations in article 5 of the EU Floods Directive 2007/60/EG data has been collected by terrestrial surveying. The flood hazard maps can be derived from this data blended with a digital terrain model and hydraulic models. Starting 22 December 2019 the update frequency will be six years.
3.4 SARONTAR
The system SARONTAR results from a cooperation between the University of Technology Graz, the alpine police and the telecommunications company TeleConsult Austria. In two implementation phases they created an operation control system for accidents and disasters in the Alpine region. The system architecture consists of mobile terminals, a mission control centre and a central server component (Prüller et al., 2015). The purpose of this approach is to coordinate the rescue forces on site to supply affected people efficiently. The rescue workers navigate with the mobile terminals in the destination area via satellite-based DGPS (Hofmann-Wellenhof, 2010). On these mobile devices runs the SARONTAR application that visualizes the current position on a map and allow communication with the operation control centre. On the other side the movement of the rescue teams can be monitored and corrected through instructions if necessary. The used maps are official topographic maps provided through a map service. In a pilot stage in 2015 the system was tested under real conditions (Prüller et al, 2015). The core aspects of this approach are real-time communication and positioning in dynamically changing rescue missions.
4. CONCEPT
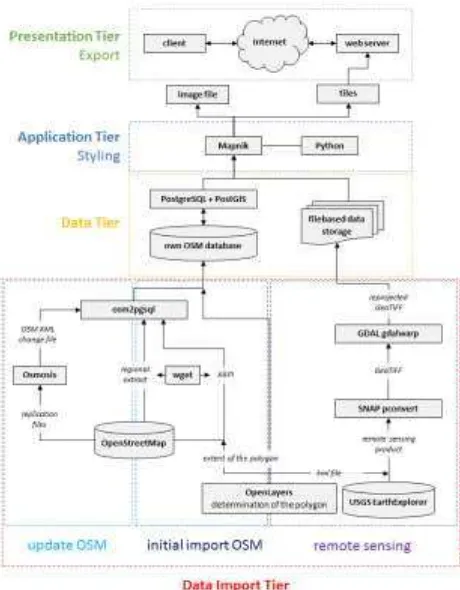
This work provides an alternative concept of a geoinformation system for the use in disaster scenarios. The main task is to provide geodata in separate data storage and visualize it as reference map delineating the extents of the affected area. The concept is extents the work of Hellal (2012). It is based on the usage of free software and free data combined in a multi-tier architecture as depicted in Fig. 1 comprising
Data import tier Data tier
Application and styling tier Presentation and export tier
The user defines the extent of the disaster area. This area is used as a region of interest for data acquisition in the data import segment. OpenStreetMap (OSM) data can be exported in different ways using the Extended OSM API or regional extracts. The export results are imported into a PostgreSQL database with osm2pgsql. Afterwards the user chooses a suitable satellite image based on the defined polygon. The system uses the Sentinel Application Platform (SNAP) to convert the remote sensing product into a geocoded RGB raster image. Gdalwarp, part of the Geospatial Data Abstraction Library (GDAL), serves to re-project the converted satellite image to a uniform target spatial reference system World Geodetic System 84/Pseudo Mercator. The stored data in the data tier can be visualized with the render software Mapnik in the application tier. The result of the concept is a map, which can be used in to support the disaster management tasks. There is also an option to update the OSM data in the database. With Osmosis replication files can be exported from OSM and the changes within the affected area imported into the existing database using osm2pgsql.
5. WORKFLOW
5.1 Preparation
The conceptualized system was labelled “disasterGIS” and implemented for Windows 10 due to the potentially wider range
of users1, according to the experience of the authors especially
in public authorities. A central batch script controls the several system components and the data stream during the mapping process. Therefore the interaction with the user primarily takes place in the windows console.
The final version requires PostgreSQL with PostGIS extension, Python 2.7, the Sentinel Application Platform and an executable version of GDAL as prerequisites. In addition the user has to set environment variables for the main executables of these tools. Other system components are directly integrated in the folder structure of the disasterGIS provided as a portable zip archive
Figure 1. System architecture and components
The archive contains a README file that provides the necessary instructions for the setup of the system.
During the mapping workflow the user is guided by instructions in the console window. Export results are stored inside a separate project folder in disasterGIS.
As first step the script creates a new local PostgreSQL database with PostGIS and hstore extension. For each database operation the user has to authenticate himself by user id and password.
After the preparation of the database a local web browser opens a HTML document referencing the OpenLayers library. In the appearing map window the user navigates to the affected area and delineates its extents. When closing the map window the coordinates of this rectangle (in WGS 84) are transferred to the clipboard. The user can paste the coordinates to the console window to continue the mapping process. After confirming the
1
See Desktop Operating System Market Share Worldwide
http://gs.statcounter.com/os-market-share/desktop/worldwide/
coordinate input the script creates a KML file used for the satellite image acquisition in later steps of the workflow.
5.2 Import of OpenStreetMap vector data
There are two options implemented to obtain OSM data for the reference map. On the one hand the disasterGIS processes regional extracts based on administrative boundaries. The user is redirected to the website of Geofabrik GmbH, a provider of regional OSM extracts on a daily basis (http://www.geofabrik.-de/en/data/download.html). It is necessary to manually choose a suitable PBF-encoded file and paste the URL in the console window. After confirmation the batch script retrieves the file using wget and saves it to a predefined folder.
On the other hand the OSM Extended API (XAPI, http://wiki.openstreetmap.org/wiki/Xapi) is supported as second option. Based on the disaster extent a bounding box is submitted. Main advantage is the automatic retrieval of OSM data in uncompressed OSM XML format, using again wget. The standard OSM API was not used because of its limitations in the amount of data; however the Overpass API (http://overpass-api.de/) could be additionally integrated.
The script now parametrizes osm2pgsql to import the downloaded data into the PostGIS database.
As an alternative Osmosis (http://wiki.openstreetmap.org-/wiki/Osmosis) was tested. This command line based tool uses database schemas similar to the original OSM data structure. A disadvantage is the lacking support of areal features. Even the manual creation of areal features using SQL queries cannot compete with osm2pgsql’s result. Therefore osm2pgsql is the preferred database import tool, but Osmosis is used to synchronize the data with updates of the central OSM server (see section 5.5).
5.3 Import of remote sensing data
Remotely sensed data from satellite-borne or airborne sensors are widely used in disaster mapping (Theilen-Willige & Wenzel, 2011; NASA, 2015; FSD, 2017). In the approach described here satellite-borne remote sensing data are incorporated. The United States Geological Survey (USGS) Earth Explorer (https://earthexplorer.usgs.gov/) serves as basis for satellite images. The web portal provides for example Landsat-8 and Sentinel-2 mission images as free data. The data offered by EU’s Copernicus platform (https://scihub.copernicus.eu/) could not be integrated into this study due to technical limitations in November 2016.
The rectangular extent of the disaster area is used to create a KML file which is used in Earth Explorer as region of interest. The user still has to download manually suitable datasets completely covering the affected area without cloud coverage.
The Sentinel Application Platform’s sub-programme pconvert (SNAP, http://step.esa.int/main/toolboxes/snap/), converts each file to GeoTIFF, a format supported by the rendering components. Because of the identical index of the spectral bands for Landsat-8 and Sentinel-2 mission products only these two types of satellite images are allowed in the disasterGIS.
The link between the downloaded satellite image and the batch script is a metadata file in the extracted dataset. Its file path has to be inserted in the console window to continue the conversion process with pconvert. After this CPU- and time-intensive
process the satellite image is saved. Because the geocoding refers to WGS 84 the image still has to be re-projected by GDAL’s gdalwarp tool to the uniform target spatial reference system WGS 84/Pseudo Mercator.
5.4 The rendering process
Vector and raster data are now available in the platform’s data tier. Mapnik (http://mapnik.org/), a well-known render tool for various OSM maps, is used to generate a map image using the Python bindings (with Python 2.7 as additional prerequisite).
The main batch script creates now an additional project-specific script which starts the rendering process after the termination of the main script. Currently rendering is based on a former OSM XML style with some modifications to reduce the density of information and to emphasize the transport infrastructure to support navigation and logistics. Raster tiles and/or a raster image of the affected area are created.
5.5 Updating the local database
To synchronize the local database with the central OSM database, i.e. to retrieve collaboratively collected data from the OSM community, an update mechanism has been implemented. Replication files, also known as replication diffs, contain changes within a specific period of time. In the main batch script the user chooses the period from the options minutely, hourly and daily (see http://wiki.openstreetmap.org/-wiki/Planet.osm/diffs). At first the command line based programme Osmosis initializes a working directory while the main batch script creates a configuration file that determines the update rhythm with the chosen option. The main script also generates a project-specific update script similar to the render batch script. After this step the disasterGIS project is completed and ready to be visualized or updated.
Updating the project data is done by Osmosis. With the period of time from the configuration file Osmosis compares the timestamp of the local state file with the timestamp of the state file on the OSM servers. If the time difference is greater than the defined time period Osmosis requests all OSM data changes in osmChange format up to the last point of update. To transfer the data changes into the database osm2pgsql is used again, however in append mode. Thereby the new data are appended to the existing data instead of overwriting it. By using a bounding box only the relevant information for the disaster area will be stored in the database.
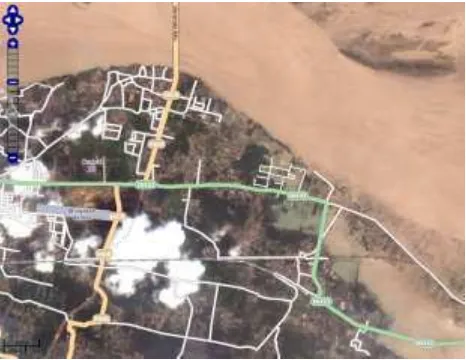
Figure 2. Exported image file of a disasterGIS project
5.6 Results
The final products of the mapping process in disasterGIS are tiles or images of the affected area. A printout of an image (see The International Archives of the Photogrammetry, Remote Sensing and Spatial Information Sciences, Volume XLII-4/W2, 2017
Figure 2) for example can be used as an overview map and be distributed among the auxiliary staff. In case of the collapse of communication infrastructures in the disaster area these printed maps can provide a current overview.
In comparison to the raster image the tiles have to be provided via webserver. Figure 3 shows a mapping client accessing the disasterGIS server.
Figure 3. Tile-based visualization of flooded areas (flood event in India, 2016, data © OpenStreetMap-Contributors, USGS)
The tile-based map presentation can be retrieved via stationary and mobile devices with internet access.
6. SUMMARY AND CONCLUSIONS
6.1 Outcomes
Geodata are a key resource in successfully handling disaster situations. The results of the VALID study prove the positive effects of the application of geospatial information in disaster management in both economic and operational regards. Cost savings around 40% illustrate the monetary potential for a specific case study. Experts in disaster management also acknowledge a medium to high additional value in the use of geoinformation in all strategic and operational aspects.
The disasterGIS provides an alternative approach for a geoinformation-based solution of free software components using freely available data to create reference maps for disaster management. In the crisis management cycle, the response phase is the one where immediate access to information and different resources is needed. DisasterGIS can provide geospatial information very rapidly within minutes or a few hours.
Regarding the requirements specification (see chapter 2.2) most of the mentioned criteria are implemented. DisasterGIS provides an automated, rapid workflow to create a reference map. The system is easy to deploy/to install, for small and large public agencies and NGOs, for any nations.
Another particular aspect regarding the relevance of geoinformation is its actuality. The data sources used provide a medium to high topicality: Landsat-8 and Sentinel-2 have a repetition cycle of 10 to 16 days, OSM data can be up-to-the-minute. DisasterGIS can take the advantage of data updates in
disaster areas due to crowd mapping events (see chapter 3.2). It offers a continuous synchronisation with the central OpenStreetMap database to retrieve collaboratively collected data from the communities like HOT. This approach enables also local actors to collect and provide geospatial information.
The cartographic presentation is controlled by a style file. Modification can be applied to support local map styles, even using with toponyms in different languages.
The disasterGIS approach distinguishes itself from the approaches mentioned in chapter 3:
Compared to the “Collaborative remote sensing data acquisition” approach the disasterGIS is available for everybody, not only for a limited group of organisations. In addition the mapping process takes less time. A disadvantage however is the smaller number of available satellite missions and the lack of further analysis of the data.
The volunteered geographic information of the OSM community (see chapter 3.2) is essential part of the disasterGIS as OpenStreetMap is a main data source.
Flood hazard maps, as shown for the EU member states, provide full areal coverage of reference data with consistent quality and high reliability whereas the coverage of OSM data in the proposed reference map differs between urban and rural regions and different regions/countries. Both approaches address however different phases of the disaster management cycle (prevention vs. response phase). The flood hazard maps are characterized by long update intervals compared to the reference maps created by disasterGIS.
Regarding the SARONTAR system disasterGIS can be an addition instead of an alternative. It is conceivable that the map tiles generated with disasterGIS can be used as map background for the interactive map services like SARONTAR.
6.2 Limitations and potential extensions
In general there are areas of improvement in disaster management. The lack of interoperability is one aspect. Bartels (2015) cites security and privacy concerns as well as the competitive situation as possible reasons for obstacles to data sharing. Developing interoperable systems for disaster management bears financial risks and the needs-based conception is a precarious point. National and international infrastructures for spatial information, e.g. the European Spatial Data Infrastructure (INSPIRE), can play a decisive role. With disasterGIS the geodata collected in the data tier can be made available using standardized OGC web services (e.g., WMS and WFS).
The current version of disasterGIS is executable under Windows 64 bit because some components are not available as 32 bit versions. Although disasterGIS is currently implemented under Windows it is possible to implement the system architecture under a Linux distribution too. The port to Linux is planned as a next step. The mapping products of disasterGIS – geodata, map images and tiles – can be used however independent of the operating system.
Currently two data sources are integrated in disasterGIS. Due to the plugin architecture of Mapnik to a variety of formats additional data sources could be supported.
Concerning the accuracy both type of data are sufficient for orientation and navigation in disaster management. The ground resolution of the satellite images amounts to minimum 10 m. OSM’s data positional accuracy, usually captured with civil GNSS accuracy, is also around 10 m. However as another potential resource for disaster management UAV-based imagery could be integrated after processing and rectification. The immediate operational readiness and better ground solutions have advantages compared to satellite imagery. In conjunction with the rapid data provision presented here this would be an interesting contribution to the generation of near real-time ground information.
REFERENCES
Altan O., Backhaus R., Boccardo P., Tonolo F. G., Trinder J., van Manen N., Zlatanova S. (eds.), 2013. The Value of Geoinformation for Disaster and Risk Management (VALID) Benefit Analysis and Stakeholder Assessment . http://www.un-spider.org/sites/default/files/VALIDPublication.pdf [2017-05-22]
Bartels, M., 2015. Warum scheitern interorganisationale Katastrophenmanagementsysteme bisher? In : Akteure verbinden, Lösungen finden - Katastrophenvorsorge im Dia log zwischen Wissenschaft und Praxis. 14. Forum Katastrophenvorsorge. Bonn, Leipzig: Dt. Komitee Katastrophenvorsorge (DKKV-Publikationsreihe), pp. 24–25. http://www.dkkv.org/fileadmin/user_upload/Veroeffentlichunge n/Publikationen/DKKV_54_14._Forum_Katastrophenvorsorge. pdf [2017-05-22]
Danzeglocke, J., 2014. Hochwasserkatastrophen – Unterstützung aus dem All. In: zfv 139 (1/2014), pp.. 50–53
DLR, 2017. International Charter 'Space and Major Disasters'. https://www.zki.dlr.de/services/charter [2017-05-24]
European Commission, 2017. Service Overview. http://emergency.copernicus.eu/mapping/ems/service-overview [2017-05-22]
FSD – Swiss Foundation for Mine Action, 2017: Drones in Humanitarian Action – A guide to the use of airborne systems in humanitarian crises. http://drones.fsd.ch/wp-content/uploads/2016/11/Drones-in-Humanitarian-Action.pdf [2017-05-26]
Hellal, K., 2012. Rapid Mapping to Support Disaster Management based on Open Sources. Unpublished Master’s Thesis, Stuttgart University of Applied Sciences, Germany
Hofmann-Wellenhof, B, 2010: Der Alpenraum und seine Herausforderungen - manchmal ein Wettlauf mit der Zeit. Graz. http://www.tzs.at/fileadmin/TZS/Intra-net/PDF/Hofmann-Wellenhof_geschuetzt_Gmunden_24-11-2010.pdf [2017-01-03].
Humanitarian OpenStreetMap Team (HOT), 2015. 2015 Annual Report - Mapping Our World Together. https://www.hotosm.org/sites/default/files/HOT_2015_Annual_ Report.pdf [2017-05-25].
International Federation of Red Cross and Red Crescent Societies (IFRC), 2011. IDRL Guidelines Guidelines for the domestic facilitation and regulation of international disaster relief and initial recovery assistance.
http://www.ifrc.org/PageFiles/41203/1205600-IDRL%20Guidelines-EN-LR%20(2).pdf [2017-05-22]
Müller, M.; Panczak-Geörg, M.; Mattes, E.; Ellmenreich, B.; Schillinger, W.; Moser, M. et al. (2009): GIS-Einsatz zur Web-basierten Darstellung von Hochwassergefahrenkarten in Baden-Württemberg. In zfv 134 (6/2009), pp. 333–339
Munich Re, 2015. Loss events worldwide 1980 – 2014. http://www.preventionweb.net/files/44281_19802014paketworl dusde4zu3.pdf [2017-05-22]
NASA, 2015. Landsat 8 Reveals Extent of Quake Disaster in Nepal’s Langtang Valley. https://www.nasa.gov/jpl/landsat-8-reveals-extent-of-quake-disaster-in-nepal-s-langtang-valley [2017-05-22]
Neis, P., Singler, P., Zipf, A., 2010. Collaborative Mapping and Emergency Routing for Disaster Logistics—Case Studies from the Haiti Earthquake and the UN Portal for Afrika. In Proceedings of the Geoinformatics Forum, Salzburg, Austria, 6–9 July http://koenigstuhl.geog.uni-heidelberg.de/-
publications/2010/Neis/un-osm-emergency-routing.gi-forum2010.full.pdf [2017-05-26]
Neis, P., Zielstra, D., 2014. Recent developments and future trends in volunteered geographic information research: The case of OpenStreetMap. Future Internet, 6(1), 76-106 2010 http://www.mdpi.com/1999-5903/6/1/76/htm [2017-05-26]
Ostrau, S. et al., 2013. Einsatz von Geoinformationen in den Kommunen. Ergebnisse der Umfrage, Good Practice Beispiele, Handlungsempfehlungen. http://www.geoportal.de/- SharedDocs/Downloads/DE/GDI-DE/KoKoStudie_Einsatz_-Geoinfo_Kommunnen.pdf?__blob=publicationFile [2017-05-22]
Penman, J.; Knudson, J.; Luraschi, G. (2015): OGC 15-095 Emergency and Disaster Management Information Framework. Version 0.0.2. Open Geospatial Consortium. https://portal.opengeospatial.org/files/?artifact_id=66868 [2017-05-22]
Prüller, R., Fösleitner, C., Sommer, C., 2015. SARONTAR – ein Einsatzleitsystem für Notfälle in alpinen Regionen. In: Josef Strobl (Hg.): AGIT 1-2015. Journal für Angewandte Geoinformatik. Berlin: Wichmann, S. 252–257.
http://gispoint.de/fileadmin/user_up-load/paper_gis_open/AGIT_2015/537557036.pdf [2017-05-22]
Theilen-Willige. B., Wenzel. H., 2011. Remote Sensing And GIS Contribution to Earthquake Disaster Preparedness in Hungary. GeoInformation for Disaster Management Gi4DM, 03/05/2011 - 08/05/2011, Antalya, Turkey. http://www.isprs.org/proceedings/XXXVIII/Gi4DM/CDDATA/ sessions.html [2017-05-25]
UNISDR, 2012. Number of Climate-related Disasters Around the World (1980-2011). www.preventionweb.net/files/-20120613_ClimateDisaster1980-2011.pdf [2017-05-22]
UNISDR, 2013. DISASTER IMPACTS / 20002012. http://www.preventionweb.net/files/31737_20130312disaster20 002012copy.pdf [2017-05-22]
Voigt, S., 2013. DLR Center for Satellite Based Crisis Information. In: Altan et al. (2013).