CHAPTER III
RESEARCH METHODOLOGY
This chapter presents the methodological aspects of the study. It covers
research design, research site, participant, data collection, and data analysis.
3.1. Research Design
The research design of this study is qualitative design and case study is
used in this research. According to Richards (2003:20), case study is a design
which focuses on a particular unit or set of units – institutions, programs, events,
etc – and the aim is providing a detailed description of the units. In addition, Nisbet and Walt’s (1984, cited in Cohen et al., 2005:184) point out that case study: (1) can be done by a single researcher without needing a full team; (2) is
strong on reality; (3) gives insight into similar situations; (4) catches specific
elements and unexpected events; and (5) has results which are easily understood
by the reader and immediately intelligible as they speak for themselves.
This study is categorized as case study because of several reasons. First, it
is conducted in a small scale for a single case (Stake, 1985 as cited in Emilia,
2008), and it is similar with this study focusing on a small scale, namely one
3.2. Research Site
The place where this study was conducted is a boarding school in Bandung
Regency. It is dedicated for elementary up to senior high school students. The
school has been chosen as the site of the research because the school provides the
necessary data that the researcher needs.
3.3. Participants
The participants involved in this study were an English teacher and a class
consisted of 20 students of second grades in Junior High School. From the
participants, 15 students were taken as the sample and they represented the three
categories of low, middle, and high achiever. The students have been chosen as
the participants because they have learned narrative text.
3.4. Data Collection
The data were collected through task giving, interview, and observation. From the task giving, the data were in form of students’ answer sheet. Meanwhile, from the interview the data were in form of transcription. Then data were
crosschecked with observation. Each technique of the data collection is described
thoroughly below.
3.4.1 Task Giving
The students were given 20 questions about narrative text in form of
multiple-choice question to be answered. A set of question titled Soal-soal
Narrative Text taken from http://www.belajarbahasainggris.web.id then was
how to answer each type of questions. The second task is aimed to find out
academic year 2010-2011 published by Indonesia Department of National Education. Students’ reading comprehension was tested through seven indicators, which were: identifying main idea (IMI), identifying detailed information (IDI),
identifying implied information (III), identifying word reference (IWR),
identifying word meaning (IWM), arranging jumbled sentences (AJS), and
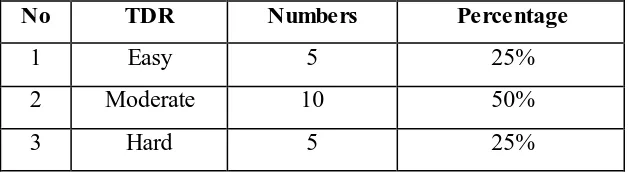
After giving those tasks to the students, the writer noticed that there were
five easy numbers, 10 moderate numbers, and five hard numbers of questions. The
data of their TDR were served as follows:
Table 3.1 Task Difficulty Rate
No TDR Numbers Percentage
1 Easy 5 25%
2 Moderate 10 50%
3 Hard 5 25%
We can see from the table above showing that 25% of the question number
(1,2,7,8, and 12) was considered to be easy. Then about 50% of question number
(3,4,9,13,14,16,17,18,19, and 20) was considered to be moderate. Meanwhile,
25% of question number (5,6,10,11, and 15) was considered to be hard. Having
seen the data, the writer believed that the TDR for the task was quite proportional.
It almost went along with Hasan and Zainul (2001).
3.4.2 Interview
Another method of collecting data in this study is interview with the
participants. Hancock and Algozzine (2006:39) mention that interviews are
frequently used in case study research. Interview is a method to get specific
information which is taken from direct interaction between interviewer and
interviewee (Cohen and Manion, 1994:271). Interview is needed to collect
information which was not covered in task giving.
teacher’s interview. In students’ interview, group interview was chosen because it more effective to get the data. Students’ interview aims to find out their difficulties and what things that failed them in answering each of task numbers, while teacher’s interview is to find out strategies used by the teacher to overcome students’ difficulties.
The interviews were conducted in Indonesian Language in order to keep
the conversation communicative and natural. Audio-taping is required in this
study to avoid losing important information provided by the participants, as
suggested by Creswell (2007:134).
These are the following questions of the interview:
Questions for student:
1. Menurut kamu bagaimana soal-soal yang telah dikerjakan? Mudah atau
sulit?
(What do you think about the test? Is it easy or difficult?)
2. Jika ada kesulitan, apa saja kesulitan yang kamu hadapi untuk setiap
pertanyaan?
(If there is a difficulty/problem, what is that?)
Questions for teacher:
1. Dari hasil test siswa ditemukan berbagai kesulitan yang mereka hadapi
ketika mengerjakan soal. Bagaima na tanggapan anda mengenai hal
tersebut?
(From the students’ task result and interview, it is found that there were some difficulties faced by your students when they answered the
questions. What do you think about that?)
2. Menurut anda, apakah ada kesulitan lain yang membuat mereka tidak bisa
(In your opinion, are there another difficulties which made them fail to
answer the question correctly?)
3. Bagaimana cara anda membantu mereka menghadapi kesulitan tersebut?
(How did you help them to overcome those difficulties?)
3.4.3 Observation
Observation is an instrument of collecting data that can be used to obtain a
comprehensive picture of situation (Ary, 2010:47). Thus, in order to crosscheck
the strategy which is used by the teacher in overcoming students’ difficulties in
answering each type of questions and to determine whether or not that strategies
effectively, the study employed observation. The observation was equipped by
field notes to crosscheck the data from the interview before.
3.5 Data Analysis
As the data have been conducted, the next step to do is to analyze the data.
Bogdan (1975 cited in Sugiyono, 2009:334) states that data analysis is a process
of systematically searching and arranging the interview transcripts, notes, and
other materials accumulated to increase the understanding of them.
Analyzing qualitative data requires understanding how to make sense of
text and images in order to form answers to our research questions. In this study,
the writer applied six steps involved in analyzing and interpreting qualitative data
suggested by Creswell (2008), they are:
1. Preparing and Organizing Data
2. Exploring and Coding the Database
After organizing the data from task giving, interview, and observation, the
process continued to explore the whole data to find the parts related to study in
order to answer the research questions. Then, the data was coded as the process of
segmenting and labeling text to form descriptions and broad themes in the data.
3. Describing Findings and Forming Themes
The result of coding was continued by forming themes. Themes (also called
categories) are similar codes aggregated together to form a major idea in the
database. It was done by examining codes which participants discuss frequently, difficulties in reading and teacher’s strategies, or the writer might expect to find when studying the topic.
4. Representing and Reporting Findings
After forming themes, the findings were represented and reporting. The report
was presented in descriptive analysis, a primary form for representing and
reporting findings in a qualitative research.
5. Interpreting the Meaning of the Findings
Interpretation involves making sense of the data, or the “lesson learned” as
described by Creswell (2008). Interpretation in this study means that the writer
stepped back and form some larger meaning about the phenomena based on her
personal views.
6. Validating the Accuracy of the Findings
After being interpreted, the findings were validated. Validating finding here
means that the writer determined the accuracy or credibility of the findings
7. Data Reduction
Data reduction means reducing the non-related data for answering the
research questions. Data reduction helped to focus on the aim of the research.
8. Data Display
Data display means taking the reduced data and displaying it in an organized,
compressed way so that conclusion can be more easily drawn. Since this study
used qualitative design, data displayed in descriptive sentence and tables.
9. Conclusion; Drawing or Verification