3 4
Phil Lewis, Ph.D., P.E. 5
Assistant Professor 6
School of Civil and Environmental Engineering 7
Oklahoma State University 8
Stillwater, OK 74078 9
Telephone 405-744-5207, Fax 405-744-7554 10
Email [email protected] 11
12
Heni Fitriani, Ph.D. 13
Faculty of Engineering 14
University of Sriwijaya, Indonesia 15
Jl. Raya Palembang - Prabumulih Km. 32 Indralaya, OI, Sumatera Selatan 30662 16
Telephone 0711-580739, 580740, Fax 0711-580741 17
Email [email protected] 18
19
Yongwei Shan, Ph.D., P.E. 20
Assistant Professor 21
School of Civil and Environmental Engineering 22
Oklahoma State University 23
Stillwater, OK 74078 24
Telephone 405-744-5207, Fax 405-744-7554 25
Email [email protected] 26
27
Submitted for Consideration for Presentation at the 95th Annual Meeting of the Transportation 28
Research Board and Publication in the Transportation Research Record 29
30
Presented for Review by AHD 60 Maintenance Equipment Committee 31
32
Text words 5,100 plus 1,250 words for 4 Tables and 1 Figures = 6,350 Words 33
ABSTRACT 36
The purpose of this paper is to present a taxonomy of fuel consumption and pollutant emissions 37
rates for nonroad equipment to assist equipment managers in estimating the energy and 38
environmental impacts of their fleets. Diesel fuel is the primary energy source for nonroad diesel 39
equipment. Without it, the equipment is inoperable and non-productive. Estimating fuel 40
requirements can be extremely difficult due to high variability in published fuel consumption 41
rates. Moreover, equipment publications provide no guidance for selecting pollutant emissions 42
rates. The taxonomy is based on real world fuel consumption and emissions data collected from 43
in-use equipment. An engine modal analysis was conducted on the data to categorize it by 44
engine load. Weighted average fuel consumption and pollutant emissions rates were calculated 45
based on the results of the engine modal analysis. The taxonomy presents the weighted average 46
fuel consumption and emissions rates according to equipment type, Environmental Protection 47
Agency engine tier technology type, and pollutant including nitrogen oxides, hydrocarbons, 48
carbon monoxide, carbon dioxide, and particulate matter. The taxonomy provides an accurate 49
and easy to use guide for equipment managers to use in estimating their fuel consumption and 50
resulting pollutant emissions. 51
INTRODUCTION 54
Taxonomy is a term used in biology that refers to the science of categorizing and classifying 55
organisms (1). Just as living creatures eat food and eliminate waste, heavy equipment consumes 56
fuel and exhausts harmful byproducts in the form of pollutant emissions; therefore, members of 57
the nonroad diesel equipment kingdom need to be categorized and classified in order to properly 58
evaluate their energy and environmental impacts. The purpose of this paper is to present a 59
taxonomy of fuel consumption and pollutant emissions rates for nonroad diesel construction 60
equipment based on real world data from in-use equipment. 61
Diesel fuel is the lifeblood of heavy equipment – without it the equipment is inoperable. 62
Diesel fuel also has a significant economic impact on equipment operations due to its high cost. 63
Volatility in fuel prices makes it difficult to estimate total fuel costs in the short term and 64
especially in the long term. Although it is impossible to predict the rise and fall of future fuel 65
prices, it is possible to accurately estimate required fuel quantities. This paper examines 66
common procedures for estimating fuel consumption and builds upon that body of knowledge by 67
adding metrics for estimating pollutant emissions resulting from diesel fuel usage. 68
69
Background 70
Fuel consumption is most accurately measured in the field; however, if no opportunity exists to 71
do so, fuel consumption may be estimated if the equipment application is known. Application 72
determines the engine load factor which has a significant impact on fuel consumption. Engine 73
load factor refers to the instantaneous loading of the engine relative to its maximum capability. 74
An engine continuously producing full rated horsepower is operating at a load factor of 100%. 75
Heavy equipment may reach a 100% load factor intermittently, but it seldom operates at this 76
level for extended periods of time. Periods spent at idle, travel in reverse, traveling empty, close 77
maneuvering at partial throttle, and operating downhill are examples of conditions which reduce 78
load factor (2). Equation 1 summarizes the relationship between fuel consumption, rated 79
horsepower, and engine load factor: 80
81
FC = FF × HP × LF (1)
82
where: FC = hourly fuel consumption rate (gal/h) 83
FF = fuel factor (gal/hp-h) 84
HP = engine rated horsepower (hp) 85
LF = engine load factor (%) 86
Although HP and LF are important variables in estimating FC, they primarily serve as 87
scalars to adjust FF; thus, FF is the foundational variable in estimating FC. Help is available for 88
selecting values for FF, including equipment manufacturer guides such as the Cat® Performance 89
Handbook (2). This handbook provides tables of hourly fuel consumption rates for various types 90
of equipment. The problem with these tables is that they require the user to select from a wide 91
range of values. For example, the user must first identify in the tables the specific equipment 92
item of interest based on the appropriate rated horsepower. Then, the user must determine 93
whether the equipment’s application is low, medium, or high based on typical application 94
descriptions. Finally, the user must select an engine load factor from a range of average values 95
provided for each application category. 96
To illustrate the variability in this process, consider a Cat® 420F backhoe loader with a 97
100 hp, Tier 2 engine. If the equipment application is assumed to be low, values for hourly fuel 98
hourly fuel consumption rate is estimated to be between 0.14-1.24 gal/h – an astounding 785% 100
difference. Although the true value of the average hourly fuel consumption rate is likely within 101
this range, such extreme variability in the possible values clearly confound the ability to 102
accurately estimate fuel and costs for this item of equipment. 103
Another approach to estimating hourly fuel consumption is to use a typical value for FF. 104
Many equipment textbooks (3-5) use a common value of 0.04 gal/hp-h for all nonroad diesel 105
equipment. Unlike the variability issues faced with using fuel consumption tables, the problem 106
with using a common value for FF is that it may be too rigid and consistently over- or under-107
estimate hourly fuel consumption for a specific type of equipment. Furthermore, neither the 108
hourly fuel consumption tables nor the common value approach provide any values for pollutant 109
emissions that result from fuel consumption. A real-world approach is needed to quantify and 110
characterize the energy and environmental impacts of nonroad diesel equipment. 111
112
Objectives 113
The major goal is to present a taxonomy of fuel use and emissions data for nonroad diesel 114
equipment. In order to accomplish this goal, the following objectives were achieved: 115
1. Evaluate the efficacy of FF = 0.04 gal/hp-h using real world, in-use equipment data; 116
2. Conduct an engine modal analysis of the equipment data to determine the distribution of 117
time, fuel consumption, and emissions over the full range of equipment engine loads; 118
3. Compute weighted average fuel consumption and emissions rates based on the amount of 119
time spent in each engine mode; and 120
4. Develop a taxonomy of fuel consumption and emissions rates based on equipment type and 121
Environmental Protection Agency (EPA) engine tier technology type. 122
The primary output is a matrix of fuel consumption and emissions rates for nonroad 123
diesel equipment categorized by equipment type, engine tier, and pollutant. The major outcome 124
is that equipment managers are better equipped to quantify and assess the energy and 125
environmental impacts of their fleets. 126
127
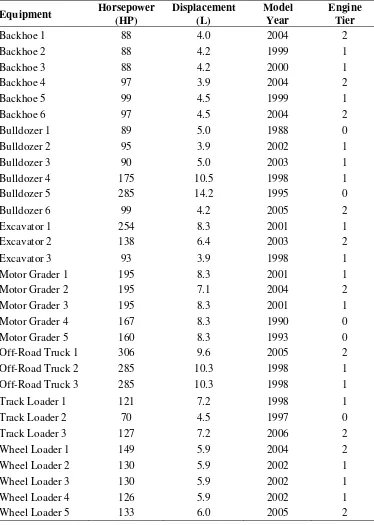
Scope 128
The scope of the analysis was limited to data collected from a case study fleet of nonroad diesel 129
equipment including backhoes, bulldozers, excavators, motor graders, off-road trucks, track 130
loaders, and wheel loaders. The equipment ranged in engine rated horsepower from 70 – 306 hp 131
and in model year from 1988 – 2007. EPA engine tier technology type included Tier 0, Tier 1, 132
and Tier 2. Tier 3 and Tier 4 engines were not available for the original research. Pollutants 133
included nitrogen oxides (NOx), hydrocarbons (HC), carbon monoxide (CO), carbon dioxide 134
(CO2), and particulate matter (PM). Equipment engine variables included intake air temperature 135
(IAT), manifold absolute pressure (MAP), and revolutions per minute (RPM). 136
137
RELATED WORK 138
The analysis was based on a prominent and well-documented dataset that included real-world 139
fuel consumption and emissions measurements for nonroad diesel equipment. This dataset was 140
developed by researchers at North Carolina State University (NC State) from 2005 through 2008. 141
The NC State research team used a portable emissions measurement system (PEMS) to collect, 142
analyze, and characterize real-world engine, fuel consumption, and emissions data from 31 items 143
of nonroad diesel equipment. The equipment types included backhoes, bulldozers, excavators, 144
Numerous papers were published by the NC State research team. Lewis et al.(6) 146
outlined requirements and incentives for reducing air pollutant emissions from construction 147
equipment. They also compared sources of emissions from various types of equipment. Based 148
on those concepts, Lewis et al.(7) developed a fuel use and emissions inventory for a publicly-149
owned fleet of nonroad diesel equipment. This emissions inventory quantified emissions of 150
NOx, HC, CO, and PM for the fleet for both petroleum diesel and B20 biodiesel. The results 151
were categorized by equipment type and EPA engine tier technology type. The impact on the 152
inventory of different emissions reduction strategies were compared. Frey et al.(8) presented 153
the results of a comprehensive field study that characterized real-world emission rates of NOx, 154
HC, CO, and PM from nonroad diesel equipment. Average emissions rates were developed for 155
each equipment type and were presented on a mass per time and mass per fuel consumed basis 156
for both petroleum diesel and B20 biodiesel. Frey et al. (9) conducted a comparison of B20 157
versus petroleum diesel emissions for backhoes, motor graders, and wheel loaders working under 158
real-world conditions. This paper also compared emissions rates for the different EPA engine 159
tier standards of the equipment. 160
Lewis et al.(10-12) published three papers on the impacts of idling on equipment fuel 161
consumption and emissions rates. These papers characterized the change in total activity fuel 162
consumption and emissions based on the change in the ratio of idle time to non-idle time. The 163
major finding was that total fuel consumption and emissions for an activity increases as 164
equipment idle time increases. Ahn et al.(13) used the dataset and previous studies to develop 165
an integrated framework for estimating, benchmarking, and monitoring pollutant emissions from 166
construction activities. Hajji and Lewis (14) developed a productivity-based estimating tool for 167
fuel use and air pollutant emissions for nonroad construction equipment performing earthwork 168
activities. The methodology for the field data collection in these studies using a PEMS is well-169
documented by Rasdorf et al.(15). Frey et al. (16, 17) also outlined the methods and procedures 170
for collecting and analyzing data for nonroad diesel equipment activity, fuel consumption, and 171
emissions; thus, the methodology may be easily replicated by those with the necessary expertise 172
and instrumentation. 173
Lewis et al. (18) published a recent paper on a variable impact analysis of nonroad diesel 174
equipment. This study examined the relationships between engine performance variables (IAT, 175
MAP, and RPM) and fuel consumption and pollutant emissions rates (NOx, HC, CO, and PM). 176
The paper concluded that MAP has the greatest impact on fuel consumption and emissions rates 177
for nonroad diesel equipment. This conclusion is foundational for the engine modal analysis and 178
the weighted average fuel consumption and emissions rates presented in this paper. 179
180
METHODOLOGY 181
This section describes the methodology used to accomplish the objectives. The primary steps of 182
the analysis included: 1) Collect real world fuel consumption and emissions data from 183
equipment being used in the field; 2) Conduct an engine modal analysis to categorize the fuel 184
consumption and emissions data according to engine load; 3) Calculate weighted average fuel 185
consumption and emissions rates based on the results of the engine modal analysis; and 4) 186
Develop a taxonomy of fuel consumption and emissions rates based on the weighted averages. 187
188
Data Collection 189
The central component to the fuel use and emissions data collection effort was a portable 190
sample probes drew exhaust samples from the tailpipe. The PEMS collected and recorded 192
second-by-second mass per time emissions data in grams per second (g/s) for NOx, HC, CO, 193
CO2, and PM. The PEMS computed mass per time fuel consumption rates (g/s) via a proprietary 194
carbon balance algorithm based on the CO2 measurements. The PEMS gathered corresponding 195
engine performance data including manifold absolute pressure (MAP), revolutions per minute 196
(RPM), and intake air temperature (IAT). Other equipment data were collected including engine 197
rated horsepower, engine displacement, equipment model year, and EPA engine tier. 198
A minimum of three hours of data were collected from each item of equipment. The field 199
data underwent a thorough quality assurance process in order to identify missing or invalid 200
values. The purpose of the quality assurance process was to ensure the availability of a robust 201
dataset for statistical analysis. Mass per time fuel consumption and emissions rates were 202
converted to gallons per hour (gal/h) and grams per hour (g/h), respectively, for consistency in 203
reporting with common industry units. Mass per fuel consumed emissions rates in grams per 204
gallon (g/gal) were computed for each pollutant by dividing the mass per time emission rate (g/h) 205
by the corresponding mass per time fuel consumption rate (gal/h). 206
207
Engine Modal Analysis 208
Because of its high correlation with fuel consumption and emissions rates, MAP was used as a 209
surrogate for engine load to conduct an engine modal analysis of the fuel consumption and 210
emissions data (18). The MAP field data were collected in units of kilopascals. In order to make 211
the MAP data more analogous to engine load percentages, the field MAP data for each item of 212
equipment were normalized according to Equation 2: 213
214
MAPnorm = ���−� � ���
��� ���−� � ��� � (2)
215
where: MAPnorm = normalized MAP value (%) 216
MAP = instantaneous MAP measurement from PEMS (kilopascals) 217
Min MAP = minimum MAP measurement from PEMS (kilopascals) 218
Max MAP = maximum MAP measurement from PEMS (kilopascals) 219
The normalized MAP values were ranked in ascending order along with their 220
corresponding fuel consumption and emissions data. The data were categorized and classified in 221
increasing engine modes such that normalized MAP values between 0 – 10% were Mode 1, and 222
90 – 100% were Mode 10; thus, Mode 1 data corresponded to the lowest equipment engine loads 223
and Mode 10 to the highest. The average fuel consumption and emissions rate for each pollutant 224
were computed for each engine mode. Likewise, the percentage of time spent in each engine 225
mode was computed by dividing the number of seconds of data in each engine mode by the total 226
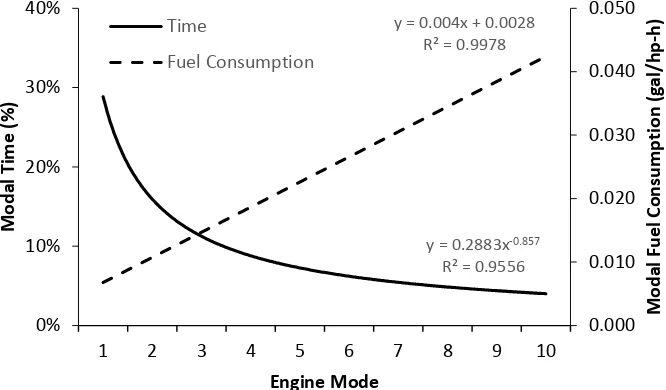
number of seconds collected for that item of equipment. In order to visually examine the 227
relationships of the modal time and modal average fuel consumption, these values were plotted 228
on the same graph and a line-of-best-fit was added to each set of values. 229
In order to evaluate the efficacy of FF = 0.04 gal/hp-h, the mass per time (gal/h) fuel 230
consumption data were normalized by dividing it by the equipment’s rated horsepower to yield 231
units of gallons per horsepower-hour (gal/hp-h). Since FF = 0.04 gal/hp-h represents the 232
maximum hourly fuel consumption rate at maximum engine load, the evaluation of FF used the 233
overall average fuel use rate for Mode 10 from all 31 items of equipment (µ). A one sample t-234
test was used to test the statistical significance of the following hypothesis: 235
237
Weighted Average Fuel Consumption and Emissions Rates 238
Equipment application has a major influence on equipment engine load. Consequently, the 239
equipment spends varying amounts of time in each engine mode and each engine mode has its 240
own average fuel consumption and emissions rates. The modal average fuel consumption and 241
emissions rates must be weighted by the amount of time spent in each mode and then summed in 242
order to obtain realistic average fuel consumption and emissions rates for nonroad diesel 243
equipment. Equations 4 and 5 show the formulas for calculating weighted average fuel 244
consumption rates and weighted average emissions rates, respectively. 245
246
� = ∑ � �
=
247
where: FC = weighted average fuel consumption rate (gal/hp-h) 248
Ti = time spent in mode i (%) 249
Fi = fuel consumption rate in mode i (gal/hp-h) 250
251
� = ∑ � �
=
252
where: ERj = weighted average emission rate for pollutant j (g/hp-h) 253
Ti = time spent in mode i (%) 254
Eij = emission rate in mode i for pollutant j (g/hp-h) 255
256
The time spent in each mode (Ti) is primarily influenced by the equipment’s application. 257
Given that each equipment type has its own specific applications, the average time in each mode 258
was calculated for each equipment type. An average Ti for each mode was calculated for each of 259
the seven equipment types. Fuel use (Fi) and emissions (Eij) rates are primarily influenced by 260
EPA engine tier technology type; thus, the equipment were categorized according to engine tier 261
and then the average fuel consumption and emissions rates were computed for each mode. This 262
approach allows the most appropriate modal fuel consumption and emissions rates to be 263
weighted by the most appropriate modal time. 264
Many fleet managers maintain detailed fuel records and may find it easier to use mass per 265
fuel used emissions rates (grams per gallon) to estimate total emissions. Equation 6 provides a 266
formula for converting the weighted average mass per time emissions rates to weighted average 267
mass per fuel used emissions rates. 268
269
ER′j = �
�
(6) 270
where: ER′j = mass per fuel used weighted average emission rate for pollutant j (g/gal) 271
272
Taxonomy of Fuel Consumption and Emissions Rates 273
The weighted average fuel consumption and emissions rates were categorized by equipment type 274
and engine tier technology type to create a taxonomy based on real world data. Since these 275
values are based on in-use data collected from the equipment, it is important to note that the fuel 276
use and emissions rates in the taxonomy do not need to be adjusted for engine load factor. 277
The taxonomy includes both mass per time and mass per fuel consumed emissions rates. 279
The mass per time fuel consumption and emissions rates are based on rated horsepower in order 280
to provide more flexibility in their use. The user simply needs to multiply the weighted average 281
fuel use or emissions rate by the rated horsepower of the equipment to calculate the hourly fuel 282
use or emissions rate. Furthermore, if total fuel consumed or total pollutants emitted is desired, 283
the hourly rate is multiplied by the estimated hours of use. Also, total emissions are estimated by 284
multiplying the mass per fuel consumed emission rate by the gallons of fuel consumed. 285
286
RESULTS 287
This section briefly summarizes the key findings of the analysis. This includes a summary of the 288
engine attributes of the equipment in the case study fleet; engine modal fuel consumption rates 289
and engine modal emissions rates; a figure showing the relationship between modal fuel 290
consumption and modal emissions; and a taxonomy of fuel consumption and emissions rates 291
categorized by equipment type and EPA engine tier. 292
293
Data Collection 294
Field data were collected from 31 units representing six types of nonroad diesel equipment. 295
Table 1 summarizes the key attributes for this equipment. The units ranged from 70-306 hp for 296
Track Loader 2 and Off Road Truck 1, respectively. The oldest item of equipment was 297
Bulldozer 1, which was manufactured in 1988. Of the 31 units tested, five were Tier 0, 16 were 298
Tier 1, and 10 were Tier 2. A minimum of three hours of data were collected from each unit. 299
300
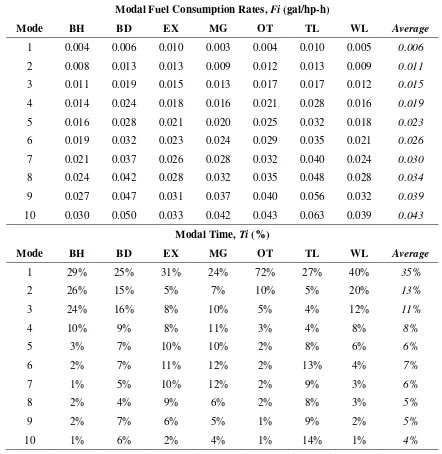
Engine Modal Analysis 301
Table 2 presents the average modal fuel consumption rates (Fi). For each type of equipment, the 302
average fuel consumption rate has a positive relationship with engine mode. In other words, the 303
fuel consumption rate increases as engine load increases. Mode 10 average values ranged from 304
0.030 gal/hp-h for backhoes to 0.063 gal/hp-h for track loaders, with an overall average of 0.043 305
gal/hp-h for all types of equipment (based on the 31 tested units). This overall average value is 306
very close to the typical fuel factor, FF = 0.04 gal/hp-h, found in equipment textbooks. In fact, 307
the results of the one sample t-test indicated that there is no statistically significant difference in 308
the two values so the null hypothesis µ = 0.04 gal/hp-h cannot be rejected; thus, it was 309
concluded that FF= 0.04 gal/hp-h is valid for nonroad diesel equipment. 310
Table 2 also shows the average modal time (Ti) for each equipment type. Conversely to 311
the average fuel use rates, the modal time has a negative relationship with engine mode. In other 312
words, the time spent in each mode decreases as engine mode increases. Figure 1 illustrates this 313
inverse relationship between modal time and modal fuel use. Modal fuel use is a linearly 314
increasing monotonic function whereas modal time is an exponentially decreasing monotonic 315
function. The line-of-best-fit for each function accounted for over 95% (R2 > 0.95) of the 316
variability in the data. For modal fuel consumption, the slope component of the trend line (m = 317
0.004) further supported the claim that FF = 0.04 gal/hp-h is valid; when multiplied by 10 (for 318
Mode 10), the average fuel use rate for Mode 10 is 0.04 gal/hp-h. The primary finding from 319
Table 2 and Figure 1 was that nonroad diesel equipment typically spends most of its time 320
working at its lowest fuel consumption rates and the least amount of its time working at its 321
highest fuel consumption rates; therefore, it was imperative to develop weighted average fuel 322
consumption and emissions rates. 323
325
TABLE 1 Summary of Equipment Attributes 326
Equipment Horsepower
(HP)
Displacement (L)
Model Year
Engine Tier
Backhoe 1 88 4.0 2004 2
Backhoe 2 88 4.2 1999 1
Backhoe 3 88 4.2 2000 1
Backhoe 4 97 3.9 2004 2
Backhoe 5 99 4.5 1999 1
Backhoe 6 97 4.5 2004 2
Bulldozer 1 89 5.0 1988 0
Bulldozer 2 95 3.9 2002 1
Bulldozer 3 90 5.0 2003 1
Bulldozer 4 175 10.5 1998 1
Bulldozer 5 285 14.2 1995 0
Bulldozer 6 99 4.2 2005 2
Excavator 1 254 8.3 2001 1
Excavator 2 138 6.4 2003 2
Excavator 3 93 3.9 1998 1
Motor Grader 1 195 8.3 2001 1
Motor Grader 2 195 7.1 2004 2
Motor Grader 3 195 8.3 2001 1
Motor Grader 4 167 8.3 1990 0
Motor Grader 5 160 8.3 1993 0
Off-Road Truck 1 306 9.6 2005 2
Off-Road Truck 2 285 10.3 1998 1
Off-Road Truck 3 285 10.3 1998 1
Track Loader 1 121 7.2 1998 1
Track Loader 2 70 4.5 1997 0
Track Loader 3 127 7.2 2006 2
Wheel Loader 1 149 5.9 2004 2
Wheel Loader 2 130 5.9 2002 1
Wheel Loader 3 130 5.9 2002 1
Wheel Loader 4 126 5.9 2002 1
Wheel Loader 5 133 6.0 2005 2
329
TABLE 2 Modal Fuel Consumption Rates and Modal Time 330
Modal Fuel Consumption Rates, Fi (gal/hp-h)
Mode BH BD EX MG OT TL WL Average
1 0.004 0.006 0.010 0.003 0.004 0.010 0.005 0.006
2 0.008 0.013 0.013 0.009 0.012 0.013 0.009 0.011
3 0.011 0.019 0.015 0.013 0.017 0.017 0.012 0.015
4 0.014 0.024 0.018 0.016 0.021 0.028 0.016 0.019
5 0.016 0.028 0.021 0.020 0.025 0.032 0.018 0.023
6 0.019 0.032 0.023 0.024 0.029 0.035 0.021 0.026
7 0.021 0.037 0.026 0.028 0.032 0.040 0.024 0.030
8 0.024 0.042 0.028 0.032 0.035 0.048 0.028 0.034
9 0.027 0.047 0.031 0.037 0.040 0.056 0.032 0.039
10 0.030 0.050 0.033 0.042 0.043 0.063 0.039 0.043
Modal Time, Ti (%)
Mode BH BD EX MG OT TL WL Average
1 29% 25% 31% 24% 72% 27% 40% 35%
2 26% 15% 5% 7% 10% 5% 20% 13%
3 24% 16% 8% 10% 5% 4% 12% 11%
4 10% 9% 8% 11% 3% 4% 8% 8%
5 3% 7% 10% 10% 2% 8% 6% 6%
6 2% 7% 11% 12% 2% 13% 4% 7%
7 1% 5% 10% 12% 2% 9% 3% 6%
8 2% 4% 9% 6% 2% 8% 3% 5%
9 2% 7% 6% 5% 1% 9% 2% 5%
10 1% 6% 2% 4% 1% 14% 1% 4%
332
FIGURE 1 Relationship between modal fuel consumption and modal time. 333
334
Weighted Average Fuel Consumption and Emissions Rates 335
Table 3 shows sample calculations for Equations 4 and 5. These sample results are for the 336
weighted average fuel consumption rate and weighted average NOx emission rate for a Tier 0 337
backhoe loader. These calculations were carried out on all seven equipment types and Tier 0, 1, 338
and 2 equipment to develop the taxonomy of fuel consumption and emissions rates. 339
As seen in Table 3, Fi and Ei increase monotonically over the range of engine modes. 340
When weighted by Ti, which decreases monotonically over the range of engine modes, the 341
weighted values of Ti× Fi and Ti × Ei is non-monotonic as they increase and decrease over the 342
range of engine modes. For this particular example, Mode 3 contributed the most to the 343
weighted average fuel consumption and emission rate. In fact, backhoe loaders spend about 90% 344
of their time in Modes 1-4 which contributed about 70% of the weighted average fuel 345
consumption rate and weighted average NOx emission rate; thus, it was concluded that backhoe 346
loaders consume most of its fuel and emit most its NOx at engine loads less than or equal to 40%. 347
348
TABLE 3 Sample Calculations for Tier 0 Backhoe Fuel Consumption and NOx Emissions
349
Weighted Average 0.017 2.9
350
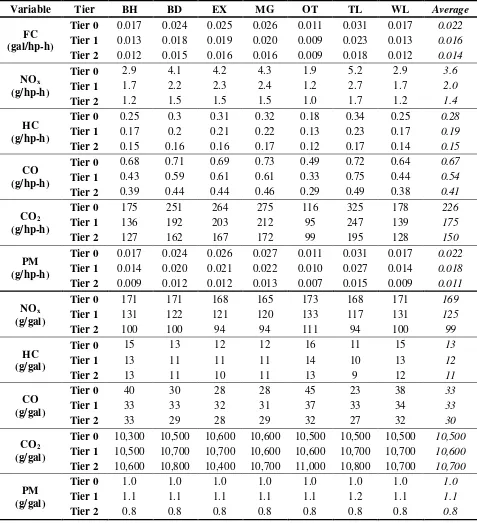
Taxonomy of Fuel Consumption and Emissions Rates 351
Table 4 presents the taxonomy of fuel consumption and emissions rates for seven types of 352
nonroad diesel equipment with three different engine tiers. This matrix of values is based on real 353
world data collected from in-use equipment in the field. For that reason, the values in Table 4 do 354
not need to be adjusted for engine load because it was accounted for in the engine modal 355
analysis. The mass per time rates were normalized by rated horsepower in order to provide more 356
flexibility in their use; thus, these values are valid over the range of engine rated horsepower 357
from 70-306 hp (the range of rated horsepower that was observed in the data). 358
The mass per time rates (fuel consumption and emissions) decrease monotonically as 359
engine tier increases. This indicates that the EPA engine tier standards have been effective in 360
reducing emissions rates of NOx, HC, CO, and PM. Although engine tier standards do not exist 361
for fuel consumption and CO2 emissions rates, the values in Table 4 show that these rates also 362
decreased as engine tier increased. With regard to the mass per fuel consumed emissions rates, 363
engine tier did not have such a profound effect. As the engine tier increased, there was a 364
monotonic decrease in the emissions rate of NOx, a slight monotonic decrease for HC, and very 365
little change for CO, CO2, and PM with respect to engine tier. However, the mass per fuel 366
consumed emissions rates were the lowest for Tier 2 equipment for each pollutant. 367
368
CONCLUSIONS AND RECOMMENDATIONS 369
The results of the analysis yielded many conclusions and recommendations. The first conclusion 370
is that FF = 0.04 gal/hp-h is a valid fuel factor for nonroad diesel equipment. This assessment is 371
based on an average of 31 items of equipment operating under real world conditions, using the 372
average fuel consumption rate in its highest engine modal category. It was found that there was 373
no statistically significant difference between the real world average fuel consumption rate and 374
FF = 0.04 gal/hp-h; thus, in the absence of more detailed information, it is recommended that 375
FF = 0.04 gal/hp-h continue to be used as an estimate for nonroad diesel fuel consumption. It 376
must be remembered, however, that this is a maximum fuel consumption rate and it must be 377
adjusted accordingly by an appropriate estimate of engine load, as well as multiplied by the 378
engine rated horsepower in order to achieve an hourly fuel consumption rate. 379
The second conclusion is that modal time has an inverse relationship with modal fuel 380
consumption. Specifically, the time spent in each mode decreases exponentially as engine mode 381
increases from 1-10. Conversely, modal fuel consumption rates increase linearly as engine mode 382
increases from 1-10. This means that the equipment spends most of its time operating at low 383
engine loads that have low fuel consumption rates but spends little time operating at the highest 384
engine loads with the highest fuel consumption rates. On average, nonroad diesel equipment 385
typically spends about 60% of its application time operating at an engine load of 30% or less. It 386
is recommended that equipment managers use Table 2 and Figure 1 as guides in evaluating usage 387
of their equipment. These guides may prove helpful in other areas such as identifying proper 388
maintenance schedules for their equipment. 389
The third conclusion is that weighted average fuel consumption and emissions rates 390
account for the variability in engine load in equipment application; thus, they do not need to be 391
adjusted for engine load which may be difficult to approximate. Weighted average rates are 392
based on observations of in-use equipment performing real world applications, which includes 393
time spent in low, medium, and high engine loads. The weighted average rates are a single value 394
use rate and adjust it by an estimated engine load based on an estimated application. 396
Furthermore, these types of handbooks do not provide any guidance related to emissions. It is 397
recommended that weighted average fuel use and emissions rates be used because of their 398
simplicity in use. 399
400
Table 4 Taxonomy of Fuel Consumption and Emissions Rates 401
Variable Tier BH BD EX MG OT TL WL Average
FC (gal/hp-h)
Tier 0 0.017 0.024 0.025 0.026 0.011 0.031 0.017 0.022
Tier 1 0.013 0.018 0.019 0.020 0.009 0.023 0.013 0.016
Tier 2 0.012 0.015 0.016 0.016 0.009 0.018 0.012 0.014
NOx
(g/hp-h)
Tier 0 2.9 4.1 4.2 4.3 1.9 5.2 2.9 3.6
Tier 1 1.7 2.2 2.3 2.4 1.2 2.7 1.7 2.0
Tier 2 1.2 1.5 1.5 1.5 1.0 1.7 1.2 1.4
HC (g/hp-h)
Tier 0 0.25 0.3 0.31 0.32 0.18 0.34 0.25 0.28
Tier 1 0.17 0.2 0.21 0.22 0.13 0.23 0.17 0.19
Tier 2 0.15 0.16 0.16 0.17 0.12 0.17 0.14 0.15
CO (g/hp-h)
Tier 0 0.68 0.71 0.69 0.73 0.49 0.72 0.64 0.67
Tier 1 0.43 0.59 0.61 0.61 0.33 0.75 0.44 0.54
Tier 2 0.39 0.44 0.44 0.46 0.29 0.49 0.38 0.41
CO2
(g/hp-h)
Tier 0 175 251 264 275 116 325 178 226
Tier 1 136 192 203 212 95 247 139 175
Tier 2 127 162 167 172 99 195 128 150
PM (g/hp-h)
Tier 0 0.017 0.024 0.026 0.027 0.011 0.031 0.017 0.022
Tier 1 0.014 0.020 0.021 0.022 0.010 0.027 0.014 0.018
Tier 2 0.009 0.012 0.012 0.013 0.007 0.015 0.009 0.011
NOx
(g/gal)
Tier 0 171 171 168 165 173 168 171 169
Tier 1 131 122 121 120 133 117 131 125
Tier 2 100 100 94 94 111 94 100 99
HC (g/gal)
Tier 0 15 13 12 12 16 11 15 13
Tier 1 13 11 11 11 14 10 13 12
Tier 2 13 11 10 11 13 9 12 11
CO (g/gal)
Tier 0 40 30 28 28 45 23 38 33
Tier 1 33 33 32 31 37 33 34 33
Tier 2 33 29 28 29 32 27 32 30
CO2
(g/gal)
Tier 0 10,300 10,500 10,600 10,600 10,500 10,500 10,500 10,500 Tier 1 10,500 10,700 10,700 10,600 10,600 10,700 10,700 10,600 Tier 2 10,600 10,800 10,400 10,700 11,000 10,800 10,700 10,700
PM (g/gal)
Tier 0 1.0 1.0 1.0 1.0 1.0 1.0 1.0 1.0
Tier 1 1.1 1.1 1.1 1.1 1.1 1.2 1.1 1.1
Tier 2 0.8 0.8 0.8 0.8 0.8 0.8 0.8 0.8
The fourth conclusion is that the taxonomy of fuel consumption and emissions rates 403
provides a valid and reliable source of information for evaluating the energy and environmental 404
impacts of nonroad diesel equipment. The taxonomy permits the user to select a fuel 405
consumption rate and emissions rate for a specific type of equipment for a specific EPA engine 406
tier technology type. The user is able to estimate emissions on a mass per time or a mass per fuel 407
consumed basis. The major advantage of the taxonomy is that the user does not have to guess a 408
value for engine load based on a vague description of equipment activity because engine load is 409
accounted for in the taxonomy. It is highly recommended that research continue to expand the 410
taxonomy to include other equipment types as well as Tier 3 and Tier 4 equipment. 411
412
REFERENCES 413
1. Dictionary.com, “Taxonomy,” http://dictionary.reference.com/browse/taxonomy, 414
Information viewed on August 1, 2015. 415
2. CAT. Caterpillar Performance Handbook, Edition 44. Caterpillar, Peoria, IL, 2014. 416
3. Nichols, H. and Day, D. Moving the Earth: The Workbook of Excavation, Fifth Edition. 417
McGraw-Hill, New York, NY, 2005. 418
4. Peurifoy, R. and Oberlender, G. Estimating Construction Costs, Sixth Edition. McGraw-419
Hill, New York, NY, 2014. 420
5. Peurifoy, R., Schexnayder, C., Shapira, A., and Schmitt, R. Construction Planning, 421
Equipment, and Methods, Eighth Edition. McGraw-Hill, New York, NY, 2011. 422
6. Lewis, P., Rasdorf, W., Frey, H.C., Pang, S-H., and Kim, K., "Requirements and Incentives 423
for Reducing Construction Vehicle Emissions and Comparison of Non-road Diesel Engine 424
Emissions Sources," Journal of Construction Engineering and Management, American 425
Society of Civil Engineers, 135 (5), 341-351, 2009. 426
7. Lewis, P., Frey, H.C., and Rasdorf, W., "Development and Use of Emissions Inventories for 427
Construction Vehicles," Transportation Research Record: Journal of the Transportation 428
Research Board, National Research Council, Washington, D.C., 2123, 46-53, 2009. 429
8. Frey, H.C., Rasdorf, W., and Lewis, P., “Comprehensive Field Study of Fuel Use and 430
Emissions of Nonroad Diesel Construction Equipment,” Transportation Research Record: 431
Journal of the Transportation Research Board, National Research Council, Washington, DC, 432
2158, 69-76, 2010. 433
9. Frey, H.C., Rasdorf, W., Kim, K., Pang, S-H., and Lewis, P., "Comparison of Real World 434
Emissions of Backhoes, Front-End Loaders, and Motor Graders for B20 Biodiesel vs. 435
Petroleum Diesel and for Selected Engine Tiers," Transportation Research Record: Journal of 436
the Transportation Research Board, National Research Council, Washington, DC, 2058, 33-437
42, 2008. 438
10.Lewis, P., Rasdorf, W., Frey, H.C., Leming, M., "Effects of Engine Idling on NAAQS 439
Criteria Pollutant Emissions from Nonroad Diesel Construction Equipment," Transportation 440
Research Record: Journal of the Transportation Research Board, National Research Council, 441
Washington, DC, 2270, 67-75, 2012. 442
11.Lewis, P., Leming, M., and Rasdorf, W., “Impact of Idling on Fuel Use and CO2 Emissions 443
Issue: Engineering Management for Sustainable Development, American Society of Civil 445
Engineers, 28(1), 31-38, 2012. 446
12.Lewis, P., Leming, M., Frey, H.C., and Rasdorf, W., "Assessing the Effects of Operational 447
Efficiency on Pollutant Emissions of Nonroad Diesel Construction Equipment," 448
Transportation Research Record: Journal of the Transportation Research Board, National 449
Research Council, Washington, DC, 2233, 11-18, 2011. 450
13.Ahn, C., Lewis, P., Golparvar-Fard, M. and Lee, S., “Toward an Integrated Framework for 451
Estimating, Benchmarking, and Monitoring the Pollutant Emissions of Construction 452
Operations,” Journal of Construction Engineering and Management Special Issue: 453
Sustainability in Construction, American Society of Civil Engineers, 139(12) A4013003, 454
2013. 455
14. Hajji, A. and Lewis, P., “Development of productivity-based estimating tool for energy and 456
air emissions from earthwork construction activities,” Smart and Sustainable Built 457
Environment, Emerald Group Publishing Limited, 2(1), 84-100, 2013. 458
15.Rasdorf, W., Frey, H.C., Lewis, P., Kim, K., Pang, S-H., and Abolhassani, S., "Field 459
Procedures for Real-World Measurements of Emissions from Diesel Construction Vehicles," 460
Journal of Infrastructure Systems, American Society of Civil Engineers, 16 (3), 216-225, 461
2010. 462
16. Frey, H. C., Rasdorf, W., Pang, S. H., Kim, K., Abolhasani, S., and Lewis, P., “Methodology 463
for Activity, Fuel Use, and Emissions Data Collection and Analysis for Nonroad 464
Construction Equipment,” Proceedings of the Air and Waste Management Association 465
Annual Conference, AWMA, Pittsburgh, PA, 2007. 466
17.Frey, H.C., Rasdorf, W., Pang, S., Kim, K., and Lewis, P., "Methods for Measurement and 467
Analysis of In-Use Emissions of Nonroad Construction Equipment," Proceedings of the EPA 468
Emissions Inventory Conference, Environmental Protection Agency, Raleigh, NC, 2007. 469
18. Lewis, P., Fitriani, H., and Arocho, I., “Engine Variable Impact Analysis of Fuel Use and 470
Emissions for Heavy Duty Diesel Maintenance Equipment,” Transportation Research 471
Record: Journal of the Transportation Research Board, National Research Council, 472
Washington, DC, In Press, 2015. 473