PHOTOSYNTHESIS AND YIELDS OF GRASSES GROWN IN SALINE CONDITION
E.D.Purbajanti1, R.D.Soetrisno2, E.Hanudin3 and S.P.S.Budhi4
1Animal Science Study Program, Gadjah Mada University Yogyakarta - Indonesia.
Permanent address: Forage Science Laboratory, Animal Agriculture Faculty, Diponegoro University, Tembalang Campus, Semarang - Indonesia
2Pasture and Forage Science Laboratory, Animal Science Faculty,
Gadjah Mada University Yogyakarta - Indonesia
3Soil Fertility Laboratory, Agriculture Faculty,
Gadjah Mada University, Yogyakarta-Indonesia.
4Feed Technology Laboratory, Animal Science Faculty,
Gadjah Mada University, Yogyakarta – Indonesia Corresponding E-mail: [email protected]
Received November 19, 2009; Accepted February 23, 2010
ABSTRACT
The aim of this study was to know effects of saline condition to crop physiology, growth and forages yield. A factorial completed random design was used in this study. The first factor was type of grass, these were king grass (Pennisetum hybrid), napier grass (Pennisetum purpureum), panicum grass
(Panicum maximum), setaria grass (Setaria sphacelata) and star grass (Cynodon plectostachyus). The
second factor was salt solution (NaCl) with concentration 0, 100, 200 and 300 mM. Parameters of this experiment were the percentage of chlorophyll, rate of photosynthesis, number of tiller, biomass and dry matter yield. Data were analyzed by analysis of variance and followed by Duncan’s multiple range test when there were significant effects of the treatment. Panicum grass had the highest chlorophyll content (1.85 mg/g of leaf). Photosynthesis rate of setaria grass was the lowest. The increasing of NaCl concentration up to 300 mM NaCl reduced chlorophyll content, rate of photosynthesis, tiller number, biomass yield and dry matter yield. Responses of leaf area, biomass and dry matter yield to salinity were linear for king, napier, panicum and setaria grasses. In tar grass, the response of leaf area and biomass ware linear, but those of dry matter yield was quadratic. The response of tiller number to salinity was linear for all species.
Keywords : biomass, dry matter yield, grass, photosynthesis, saline.
I
NTRODUCTIONThe increase in human population require more resources be devoted to food production systems, including marginal land such as saline soils. Soil salinity is one of the most serious stresses in agriculture. It has been estimated that about one billion hectares of the world’s land was affected by salt, sixty percent of which was cultivated ( Rain and Goyal, 2003). In Indonesia, salt problem in coastal area are becoming intrution sea water occupation the land.
Salinity and low N soil availability are growth limiting factors for most plants. Soil salinity decreased plant relative growth rate up to first mature pod stage. Previous study indicated that over fertilization during early plant
screening methods to identify genetic variation for increasing the salt tolerance of cereal crops need to be developed. Physiological mechanisms that underlie traits for salt tolerance could be used to identify new genetic sources of salt tolerance (Munns et al., 2006). Screening for salt tolerant of plant can be done with varying concentration of salt ( 0,4,6,8 dS/m NaCl, Na2SO4,CaCl2) (Garg
and Singla, 2004), level 1,3 to 6 dS/m for chile pepper (Villa-Castorena et al., 2003), salinity tolerant index equal to reduction of 50% in crop yield from that of the non-saline yield (Lee et al., 2005). Objectives of the present study was to know the effects of salinity on tiller number, chlorophyll, rate of photosynthesis, content of dry matter and biomass yield of five grasses.
MATERIALS AND METHODS Plant Culture
The experiment was conducted in the greenhouse using sand culture system. Grasses were planted on pot (diameter 20 cm with depth 25 cm) filled with sand media. Sixty pot were used in this experiment. Plant were grown under natural light. Briefly, pols of king (Pennisetum
hybrid), napier (Pennisetum purpureum), panicum
(Panicum maximum), setaria (Setaria sphacelata) and star ( Cynodon plectostachyus) grasses were hand-washed to remove soil and then planted in sand culture. The grasses were fed by liquid fertilizer containing N 8 %, P2O5 10 %, K2O 34 %, MgO 2,5 %, Fe 0,1 %, B 0,02 %, Mn 0,1 %, Cu 0,01 %, Zn 0,01 %, Mo 0,02 Co 0,001 %, Se 0,0006 % and I 0,001 % with concentration 1,5 g/liter.
Salinity treatments were applied as saline condition in the drip irrigation system by adding NaCl solution of 100, 200 and 300mM. Nutrient solution without the addition of NaCl solution served as control. Grasses were exposed to final salinity treatment for a period of 4 weeks (tripping plant uniformity) and 6 weeks (biomass yield). Data Collection
Parameters observed were tiller number, chlorophyll content, rate of photosynthesis, content of dry matter and biomass yield. Chlorophyll measured by taking sample 3 – 9 of leafs in underside, middle shares and tip of crop (young leaf). Chlorophyll was measured according to Suseno et al. (1974). One gram fresh leaf was grinded and 10 ml of 80 % acetone was added. After homogen, the solution was filtered.
The 80% acetone was added to make 50 ml solution. Then, 2.5 ml filtrate was put into a covet and 7.5 ml 80 % acetone was added to make 10 ml solution. The sample absorbance was read by spectrophotometer 652 nm wavelength. Chlorophyll content was calculated by equation :
where :
λ652 = sample wavelength for chlorophyll
λ0 = liquid standard wavelength (pure
chlorophyll)
34.5 = coefficient of wavelength absorbance 652 nm
Measurement procedure of photosynthesis rate was done by measuring CO2 yielded by crop
during 30 minutes; the grass was placed in plastic chamber ( 512000 ml volume) and put under sun light. After 30 minutes, CO2 was taken from chamber by using spuit (50 ml volume ) then injected into 5 ml NaOH. Furthermore, titration by HCL 0,1 N until red colour disappeared.
where:
PR = photosynthesis rate
Measurement dry matter yield started by preparing 100 g sample from each type of grasses. Sample was taken and dried at temperature of 105
o C during 24 hours. Dry matter percentage was
calculated using formula:
Dry matter yield (g ) = % DM x FY
where:
variance (ANOVA) according to Steel and Torrie (1990). The differences between treatment means were determined using Duncan's Multiple Range Test. Regression analysis were performed to define linear or quadratic relationships between each variable and the salinity level (Minitab Release 13.1).
RESULTS AND DISCUSSION
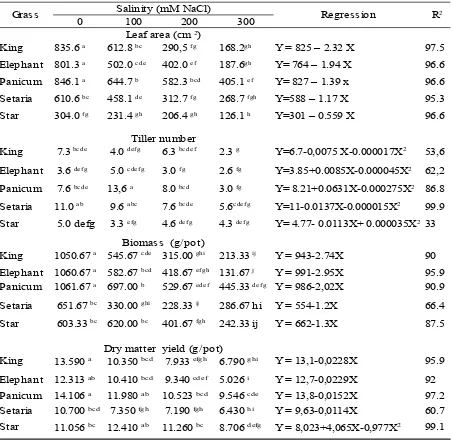
With the increasing of salinity, all species exhibited reduction leaf area though leaf area decreased, more rapidly in napier than king, panicum, setaria and star grasses (Table 2). At all salinity treatment king grass exhibited lower leaf area than elephant, panicum, setaria and star grasses.
The type of grass and the concentration of NaCl affected chlorophyll content and the rate of photosynthesis. However, there was no interaction between the 2 factors (Tables 1). The highest chlorophyll content was shown by panicum (1.85 mg/g of leaf) while the lowest content of chlorophyll was shown by king grass (0.92 mg/g of leaf) (Figure 1A). The ncreasing concentration of NaCl up to 300 mM decreased content of chlorophyll 37 % from control (Figure 1B).
Photosynthesis rate of panicum grass (1.51 mg CO2/ dm2/minute) was greater than all other
grasses. Setaria grass showed the lowest photosynthesis rate (0.91mg CO2/dm2/minute
(Figure 2 A). The increasing concentration of NaCl up to 300 mM decreased photosynthesis rate from 1.7 mg CO2/ dm2/minute to 1.0 mg CO2/
dm2/minute for salt 300 mM. ( Figure 2 B). The
decrease was about 39% of control. The inhibition of growth could be through the
reduction of leaf cell growth. Furthermore, concentration of NaCl decreased leaf area, as a result the rate of photosynthesis decreased too. Plant of C4 in general have rate of photosynthesis in comparison with plant of C3. Plant crop of C4 have rate of photosynthesis 120 until 180 mg CO2/ hour ( Lakitan, 2000). According to Qian et al. (2004), under salinity stress a greater degree of stomatal closure decreased photosyntentic capacity contributing to the declines in growth and turf quality.
Salinity was growth limiting factor for most plants. In micro-plot study of 6 cultivar of Indian mustard (Brassica juncea L) it was observed that germination of seed per plot decreased linearly with the increasing of salinity levels. Compared to the cultivars of the sensitive group, the tolerant ones exhibited a higher magnitude of reduction in number of leaf stomata per unit area at the critical salinities (12 mmhos/cm and above) of irrigation water, whereas the decrease in leaf water potential was not so marked at the same salinity level (Kumar, 2005). Salinity limits water uptake by plants by reducing the osmotic potential and thus the total soil water potential. Salinity may also cause specific ion toxicity or upset the nutritional balace. The salt composition of the soil water influences the composition of cations on the exchange complex of soil particles which influences soil permeability and tilt depending on salinity level and exchangable cation composition (Corwin and Lesch, 2003).
The analysis of variance showed significant effects of salinity, species and their interaction in the number of tiller (Table 1). With the increasing of salinity, king, setaria and star grasses showed the decrease number of tiller. However, the
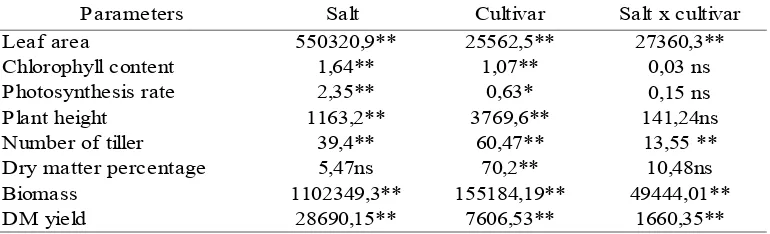
Table 1. Analysis of Variance with Mean Squares and Treatment Significant Levels
Parameters Salt
Leaf area 550320,9** 25562,5** 27360,3**
Chlorophyll content 1,64** 1,07**
Photosynthesis rate 2,35** 0,63*
Plant height 1163,2** 3769,6** 141,24ns
Number of tiller 39,4** 60,47** 13,55 **
Dry matter percentage 5,47ns 70,2** 10,48ns
Biomass 1102349,3** 155184,19** 49444,01**
DM yield 28690,15** 7606,53** 1660,35**
** significant at the 0,01 level ns : not significant
Cultivar Salt x cultivar
0,03 ns 0,15 ns
number of tiller of napier and panicum grasses increased in the concentration of 100 mM NaCl then decreased in the concentration of 200 mM NaCl and above. Response number of tiller to salinity was quadratic for all species( Table 2). The lowest of tiller number was king grass(2,3) incured by the concentration of 300 mM NaCl.
Sodium is a beneficial element required by grass. The addition of salt (in this case element of Na) will increase growth at certain condition. This phenomenon was shown by napier and panicum grasses where tiller number increased at 100 mM NaCl. However, tiller number decreased at higher salinity. Experiment of Malinowski et al. (2003) reported initial of tiller number was influenced by water availability, intensity of defoliation, time of defoliation, suggested the importance of a rapid re-establishment of photosynthesis rather than root reserves as the main source of C for regrowing shoots.
Biomass was influenced by salinity, species and their interaction (Table 1). Mean biomass yield decreased lineary with the increasing of salinity for all species (Table 2). Under none saline condition king grass has the same biomass yield as napier and panicum. Growth of crop on
saline condition will cease due to the effect of high salt concentration (high Na content). The increasing of salt content could cause plasmolysis. Plasmolysis of this study was shown by deterioration of root. Deterioration of root will reduce nutrient uptake and growth. Increasing salinity up to 300 mM reduced biomass weight by 79.8, 87.6, 58.4, 56.0, 59.8% respectively for king, napier, panicum, setaria and star grasses compared to control.
Dry matter percentage was influenced by species, but saline condition and their interaction had no significant effect (Table 1). Dry matter content influenced by crop ability in accumulating dry matter in crop. Dry matter yield was influenced by salinity, species and their interaction (Table 1). Dry matter yield decreased linearly with the increasing salinity for four leaves with a fewer number of leaves, as a result, the grasses showed higher stem:leaves ratios,
Figure 1. Chlorophyll Content of Five Forage Grasses (A), Effect of Salinity on Chlorophyll Content (B)
except setaria grass. Salinity depress growth of crop with effects on decreasing cell division, protein synthesis and biomass accumulation. Crop experiencing of salt stress generally does not show direct damage but growth is depressed (Sipayung, 2003). Abou-Hadid (2003) reported that plants affected by salinity are generally stunted. Leaves was smaller, though they may be thicker than those of normal plants. Osmotically stressed plants may show no distinctive symptoms, however, so that only comparison with normal plants from the same growing environtment reveals the extent of salt inhibition.
Salinity will alter crop morphology structure
to influence dry matter accumulation rate of crop. The increasing of salinity will decrease the number of leaf and the size of leaf. The increasing of salinity will also cause the formation a thick wax coat and leaf cuticle and earlier lignification. Under low salinity, crop will be able to grow and accumulate dry matter. According to study of Bennett and Kush (2003) on paddy crop, dry matter production was not affected when the crop grown under NaCl concentrations of 0, 20, 35, 50 mM .
Furthermore, crop grown under saline condition will have difficulty on nutrient absorbtion especially nitrogen, K, Mn, Fe and Zn.
Grass Regression
0 100 200 300
King Y = 825 – 2.32 X 97.5
Elephant Y= 764 – 1.94 X 96.6
Y= 827 – 1.39 x 96.6
Y=588 – 1.17 X 95.3
Star Y=301 – 0.559 X 96.6
Tiller number
King 53,6
Elephant 62,2
86.8
99.9
Star 33
Biomass (g/pot)
King Y = 943-2.74X 90
Elephant Y = 991-2.95X 95.9
Y = 986-2,02X 90.9
286.67 hi Y = 554-1.2X 66.4
Star Y = 662-1.3X 87.5
Dry matter yield (g/pot)
King Y = 13,1-0,0228X 95.9
Elephant Y = 12,7-0,0229X 92
Y = 13,8-0,0152X 97.2
Y = 9,63-0,0114X 60.7
Star 99.1
Table 2. Effect of salinity on leaf area, tiller number, biomass and dry matter yield of five type grasses
Salinity (mM NaCl)
R2
Leaf area (cm 2)
835.6 a 612.8 bc 290,5 fg 168.2gh
801.3 a 502.0 cde 402.0 ef 187.6gh
Panicum 846.1 a 644.7 b 582.3 bcd 405.1 e f
Setaria 610.6 bc 458.1 de 312.7 fg 268.7 fgh
304.0 fg 231.4 gh 206.4 gh 126.1 h
7.3 bc de 4.0 defg 6.3 bc def 2.3 g Y=6.7-0,0075 X-0.000017X2
3.6 defg 5.0 cde fg 3.0 fg 2.6 fg Y=3.85+0.0085X-0.000045X2
Panicum 7.6 bcde 13,6 a 8.0 bc d 3.0 fg Y= 8.21+0.0631X-0.000275X2
Setaria 11.0 a b 9.6 abc 7.6 bc de 5.6cdefg Y=11-0.0137X-0.000015X2
5.0 defg 3.3 efg 4.6 de fg 4.3 defg Y= 4.77- 0.0113X+ 0.000035X2
1050.67 a 545.67 cde 315.00 ghi 213.33 ij
1060.67 a 582.67 bcd 418.67 efgh 131.67 j Panicum 1061.67 a 697.00 b 529.67 ede f 445.33 de fg
Setaria 651.67 bc 330.00 ghi 228.33 ij
603.33 bc 620.00 bc 401.67 fgh 242.33 ij
13.590 a 10.350 b cd 7.933 efg h 6.790 g h i
12.313 ab 10.410 b cd 9.340 cd ef 5.026 i
Panicum 14.106 a 11.980 ab 10.523 b cd 9.546 cd e
Setaria 10.700 b cd 7.350 fg h 7.190 fg h 6.430 h i
11.056 b c 12.410 ab 11.260 b c 8.706 d efg Y = 8,023+4,065X-0,977X2
As a result, plant production will decrease. Tuna
et al. (2007) showed that the plants grown under
salt stress (75mM NaCl) produced lower dry matter, fruit weight and relative water content than those grown in standart nutrient solution. Qian et al. (2004) reported that Kentucky blue grass grown under salinity up to 4,9 dS/m reduced yield of northstar and moonlight cultivar by 25%.
CONCLUSION
The increasing of NaCl concentration from 0 to 300 mM NaCl reduced chlorophyll content, rate of photosynthesis, tiller number, biomass yield and dry matter yield. Response of leaf area, biomass and dry matter yield to salinity were linear for king, napier , panicum and setaria grases. In star grass, the response of leaf area and biomass was linear but dry matter yield was quadratic. The response of tiller number to salinity was linear for all species.
ACKNOWLEDGMENT
The author acknowledge to the Scholarship of Post Graduate Program Fund of the Directorate General of the Higher Education Department of National Education for gift of fund years 2005-2008.
REFERENCES
Abou-Hadid, A.F.2003. The use of saline water in agriculture in the near east and north Africa region: present and future. J. Crop Prod. 7 (2): 299-324.
Bennett, J., and G.S.Khush. 2003. Enhancing salt tolerance in crops through molecular breeding. a new strategy in Crop Production in Saline Environtments. Global and Integrative Perspective. Goyal, S.S., S.K.Sharma, D.W.Rains (Eds). The Haworth Press Inc, New York.11-65.
Corwin, D.L. and S.M.Lesch. 2003. Application of soil electrical conductivity to precision agriculture: theory, principles and guidelines. Agron. J.95:455-471.
Eghball, B.D.Ginting and J.E.Gilley.2004. Residual effects of manure or compost application on corn production and soil properties. Agron. J.96:442-447
Garg, N and R.Singla. 2004. Growth, photosynthesis, nodule nitrogen and carbon fixation in the chickpea cultivars under salt
stress. Braz.J.Plant.Physiol 16 (3): 571-581. Kumar, D. 2005. The value of certain plant
parameters as an index for salt tolerance in Indian mustard (Brassica juncea L). Plant and Soil. 79 (2): 261-277.
Lakitan, B. 2000. Fundamental of Plant Physiology. PT Rajagrafindo Persada, Jakarta.p231 .
Lee, G., R.N.Carrow and R.R. Duncan.2005. Criteria for assesing salinity tolerance of the halophytic turfgrass seashore paspalum. Crop Sci. 45: 251-258.
Malinowski, D.P., A.A.Hopkins, W.E.Pinchak, J.W.Sij and R.J.Ansley. 2003. Productivity and survival of defoliated wheatgrasses in the rolling plains of texas. Agron. J. 95:614-626.
Munns, R., R.A.James and A.Lauchli.2006. Approaches to increasing the salt tolerance of wheat and other cereals. J. Exp. Botany. 57(5) :1025-1043.
Qian, Y.L., R.F.Follett, S.Wilhelm, A.J.Koshi,and M.A.Shahba. 2004. Carbon isotop discrimination of three kentucky blue grass cultivars with contrasting salinity tolerance. Agron. J. 96: 571-575.
Rains, D.W. and S.S.Goyal.2003. Strategic for managing crop production in saline environment: an overview. Global and Integrative Perspective. Goyal, S.S., S.K.Sharma, D.W.Rains, (Eds). The Haworth Press Inc, New York.1-10.
Sipayung, R. 2003. Salt Stress and Tolerance Mechanism in Plant. North Sumatra University Digital Library, Medan.
Steel, R.G.D. and J.H.Torrie. 1990. Principles and Procedures of Statistic. John Wiley and Sons, New York.
Suseno, H., S. Harran and W.Prawiranata. 1974. Fisiologi Tumbuhan. Metabolisme Dasar dan Beberapa Aspeknya. Biro Penataran Institut Pertanian Bogor, Bogor.
Tuna, A.L., C.Kaya, M.Ashraf, H.Altunlu, I.Yokas and B.Yagmur. 2007. The effect of calcium sulphate on growth, membrane stability and nutrient uptake of tomato plants grown under salt stress. Science Direct, March 2007: 173-178.