Amina Abdel Meguid Attia et al.
* Corresponding author.
Email address : [email protected]
DOI: 10.22146/ijc.29264
Fixed-Bed Column Studies for the Removal of Congo Red
Using Simmondsia chinesis (Jojoba) and Coated with Chitosan
Amina Abdel Meguid Attia
*, Mona Abdel Hamid Shouman,
Soheir Abdel Atty Khedr, and Nevin Ahmed Hassan
National Research Center, Laboratory of Surface Chemistry and Catalysis, 33 El-Bohouth St., Dokki, Giza, Egypt, P.O.12622
Received October 23, 2017; Accepted November 20, 2017
ABSTRACT
The goal of this article describes the potential of utilizing jojoba leaves and also modified with chitosan as an efficient adsorption materials for Congo red dye removal in a fixed-bed column. Inlet dye concentration, feed flow rate and bed height had a great influence on determining the breakthrough curves. The percentage dye removal was found to be approximately 69% of coated jojoba leaves with flow rate 3 mL/min, initial concentration 50 mg/L and 4 cm bed height. The dye uptake capacity at equilibrium (qe) for coated jojoba leaves showed higher values than that
found for jojoba leaves. On this basis, this implies that the amino groups played an important role during the adsorption process. Breakthrough curves were satisfactorily in good agreement with both Thomas and Yoon-Nelson models based on the values of correlation coefficient (R2 ≥ 96).This study serves as a good fundamental aspect of
wastewater purification on jojoba leaves as a novel adsorbent for the uptake of Congo red dyes from aqueous solution in a column system.
Keywords:jojoba leaves; adsorption; Congo red; chitosan; fixed-bed column
ABSTRAK
Artikel ini menjelaskan potensi penggunaan daun jojoba dan juga kitosan termodifikasi sebagai adsorben yang efisien untuk penghilangan zat warna Congo red di kolom fixed-bed. Konsentrasi zat warna, laju alir umpan dan ketinggian kolom memiliki pengaruh besar dalam menentukan kurva breakthrough. Persentase penghilangan zat warna pewarna adalah sebesar 69% dengan menggunakan daun jojoba terlapisi dengan laju alir sebesar 3 mL/menit, konsentrasi awal sebesar 50 mg/L dan tinggi kolom sebesar 4 cm. Kapasitas adsorpsi zat warna pada kesetimbangan (qe) untuk daun jojoba terlapisi menunjukkan nilai yang lebih tinggi daripada daun jojoba. Hal tersebut mengindikasikan bahwa bahwa gugus amino memainkan peran penting selama proses adsorpsi. Kurva breakthrough sangat sesuai dengan model Thomas dan Yoon-Nelson berdasarkan nilai koefisien korelasi (R2≥ 96).
Studi ini dapat menjadi aspek fundamental yang baik untuk pemurnian air limbah, khususnya pada pemanfaatan daun jojoba sebagai adsorben baru untuk penghilangan zat warna Congo red dari larutan berair dengan sistem kolom.
Kata Kunci: daun jojoba; adsorpsi; Congo red; kitosan; kolom fixed-bed
INTRODUCTION
Lately, industrial developments and its products have the power to enhance and improve the environment community. Dyes and pigments are used in various textile industries to color their products thus leading to the contamination of wastewater [1]. The breakdown of these products influence the life forms causing toxicity to aquatic life [2] and carcinogenic, mutagenic diseases that lead to severe damage to the human beings [3]. Congo red (CR) is a benzidine-based azo dye metabolize to benzidine which generates from plastic industries, rubber printing, and dying etc. The structural stability of Congo red makes it not easily
degradable. Treatment of textile wastewater is considered as an environmental challenge and government legislation. As a consequence, there is a grand demand to have an effectual process for the uptake of these dyes [4]. Recently, adsorption using agricultural wastes has been the most economical process for the discharge of various contaminants [5] and heavy metals [6].
Amina Abdel Meguid Attia et al.
reported to have the potential as a novel adsorbent for dye removal [7].
Natural polysaccharide chitosan, a derivative of chitin [8-9] has been known for its unique properties due to the existence of high content of amino and hydroxyl functional groups in its molecules that contribute in the process of adsorption [10]. Moreover, chitosan is a nontoxic, biodegradable, and biocompatible polymer, which can be used as a wound dressing, tissue engineering, and drug delivery systems [11]. However, chitosan has unconventional properties that make it become limited to use for adsorption such as limited specific gravity, simplicity in agglomeration, poor mechanical strength in addition to lack of solubility in aqueous acids [12]. Therefore, chitosan is often used to combine with other materials to enhance their extraordinary properties. Several attempts were carried out to give desirable mechanical and effective adsorption through binding chitosan with other materials and using it for hazardous materials as well as dye uptake. Jojoba leaves are incorporated with chitosan to create an adsorbent that improves the properties of chitosan. In addition, it exhibits a porous structure that makes it become widely used as an adsorbent for removal of pollutants. Recently, pretreatment of the surface by amine groups could affect the properties of the sorbent and enhance its adsorption capacity for anionic dyes [13]. Batch adsorption experiments are used easily in the lab for the remedy of a small volume of effluents but less convenient to utilize on an industrial scale, where large quantities of wastewater are produced. However, batch adsorption affords fundamental knowledge about the efficiency of the sorbate-sorbate system. Furthermore, the data gained by the batch condition is not suitable for the most treatment systems (such as column studies) in which the contact time is not sufficient to reach equilibrium [14]. Thus, it is needed to find out the practical applicability of the sorbent in the continuous mode. In fact, the fixed-bed adsorption study is a feasible solution for the detection of bed operation lifespan, regeneration time and determines the experimental breakthrough curve [15].
The article provides a new approach to study the potential of Jojoba leaves and that coated with chitosan for the uptake of Congo red in a fixed- bed column. Operating variables such as initial dye concentration, bed height, and flow rate were considered. The results were applied to Thomas and Yoon-Nelson models.
EXPERIMENTAL SECTION
Materials
Raw Jojoba leaves (JL) were collected from trees planted in a number of deserts predominately in Southern
N
Fig 1. Chemical structure of Congo red
Egypt. The leaves were washed thoroughly with distilled water to remove dirt, dust, and other unwanted particles. Afterwards, they were dried in an oven at 60 °C for 24 h. The dried samples were milled and passed through a molecular sieve of 0.6 mm.
Instrumentation
Congo red concentrations of solutions before and after adsorption were measured using a UV-Vis Spectrophotometer (UV-240l, Shimadzu) at a wavelength of 498 nm which corresponds to the maximum absorbance of the dye. The Fourier Transform Infrared absorption spectra (FT-IR) was recorded on KBr pressed pellets of the powdered sample in the range 4000-400 cm-1 using a Perkin
Elmer FTIR 2000 Spectrophotometer. The surface morphology of the samples was investigated using scanning electron microscopy (SEM, JOEL Model JSM 5300LV). Images were captured in a liquid nitrogen cooled atmosphere.
Procedure
Preparation of dye solution
The Congo red (CR) obtained from Fluka was used without any purification. The chemical formula of CR is C32H22N6Na2O6S6 with a molecular weight
696.66 g/mol. The chemical structure of the dye is given in Fig. 1. The stock dye solution (100 mg/L) was prepared by dissolving 0.1 g of CR in 1000 mL distilled water. Experiments were carried out by diluting the stock solutions to the desired concentration.
Preparation of chitosan gel
Chitosan (2-Amino-2-deoxy-(1→4)-β -D-glucopyranose) was supplied by Sigma-Aldrich chemical company. About 20 g of chitosan was slowly added to 10% (v/v) glacial acetic acid with constant stirring for 2 h at 40–50 °C to produce a whitish viscous gel.
Amina Abdel Meguid Attia et al.
Coating with Chitosan
Chitosan coating process on the surface of Jojoba leaves (CJL) is done by soaking 25 g of Jojoba in 50 mL chitosan gel and then heated at a temperature of 40–50 °C for 1 h with continuous stirring then dried in an oven at 100 °C overnight.
Fixed-bed adsorption studies
Continuous flow adsorption experiments were conducted in a 2 cm internal diameter and 50 cm height glass column at room temperature. Three parameters including initial concentration (50 and 100 mg/L), flow rate (3 and 5 mL/min) and bed height (3 and 4 cm) were studied in the column tests. The column was filled with adsorbate between two graded levels of quartz sand to avoid the loss of adsorbent and also to ensure a closely packed arrangement. In order to eliminate air bubbles inside the column, a definite volume of distilled water was passed through the column prior to adsorption study. Dye solution of known concentration was pumped downward through the column by a peristaltic pump. Samples were collected at the outlet of the column at regular time intervals and the concentrations of dye in the effluent were analyzed using UV/VIS spectrophotometer.
Fixed-bed column data analysis
Adsorption characteristics in a fixed-bed column were studied by analyzing the shape of the experimental breakthrough curves. Breakthrough curves are expressed in term of Ct/Co as a function of time for a
given condition, where Ct is the concentration of influent
and Co is the concentration of effluent [16]. The exhaust
point is determined when Ct changes to 95% of Co. The
effluent volume (Veff) can be calculated as eq. 1:
eff total
V =Qt (1)
where, Veff is the effluent volume collected (mL); Q is the
volumetric flow rate (ml/min), and ttotal is the total flow
time (min).
The total amount of dye adsorbed for a given flow rate, feed concentration, and bed height is given by the eq 2:
concentration (mg/L). The value of the integral is obtained from the area under the curve of adsorbed dye concentration versus time. Besides, the equilibrium uptake qeq or maximum capacity of the column can be
calculated as eq. 3:
total
is the weight of adsorbent (mg).
The total amount of dye is given by the following eq. 4:
initial dye concentration (mg/L); Q is the volumetric flow rate (mL/min); and ttotal is the total flow time (min).
The percentage removal of dye is given as eq. 5:
total
the amount of dye sent to the column (mg).
Modeling of breakthrough curves
Various mathematical models are used to describe the fixed-bed column behavior. In many cases, kinetics of adsorption in a column have been analyzed for Thomas and Yoon-Nelson model to give a suitable description of the adsorption kinetics. Thus, in this research, a trial has been made to find the best model defining the adsorption kinetics to study the breakthrough performance and to determine the adsorption capacity of the fixed bed column.
Thomas model [17] is based on the mass transfer model which postulates that dye emigrates from the solution to a film around the particle and expands through the liquid film to the surface of the adsorbent. Subsequently, this step is followed by intraparticle diffusion and adsorption on the active site. Its assume Langmuir isotherm for equilibrium, plug flow performance in the bed and second-order reversible reaction kinetics. The linear form of the Thomas model is expressed by the eq. 6:
effluent dye concentration at time t (mg/L); KTH is
Thomas model constant (L/min.mg); qo is the maximum
adsorption capacity (mg/g); X is the mass of adsorbent (g); Q is inlet flow concentration (mL/min). The value of KTH and qo are determined from the slope and intercept
of a plot of ln (Co/Ct – 1) versus t.
Amina Abdel Meguid Attia et al.
where Co is the initial dye concentration (mg/L); Ct is dye
concentration at time t (mg/L); t is the flow time (min); is the time required for 50% breakthrough (min); KYN is
Yoon-Nelson rate constant (min-1). These values K YN
and τ are determined from the slope and intercept of ln (Ct/Co-Ct) versus t. The model parameters were
determined by the fit of models with the experimental data through nonlinear regression. The fit quantity was measured through the coefficient of determination (R2).
RESULT AND DISCUSSION
Characterization of Adsorbent
Scanning electron microscope analysis
The morphological structure of (JL) and (CJL) were presented in Fig. 2. It reveals that the jojoba leaves possess a rough surface, non-homogeneous with significant remarkable irregularities. However, coating with chitosan led to the formation of some wrinkles that is less porous which suggests that the pores could have acted as active sites in the dye adsorption. Furthermore, the surface was accompanied by fading appearance [19].
Fourier transform infrared spectroscopy analysis
FTIR analysis of (JL) and (CJL) was performed in order to describe the functional groups responsible for the binding mechanism between the adsorbent and the coated sample. Both samples demonstrated similar characteristic peaks while minute changes arise during the coating of Jojoba leaves as presented in the Fig. 3. The FTIR spectrum of (JL) shows a predominant broadband around at 3238 cm-1 which correspond to the
stretching vibration of O–H groups. The bands around 2921 and 2852 cm-1 were assigned for asymmetric and
symmetric stretching vibration of CH groups [20]. A large
cluster of functional groups like –C=O, –COO were found at wave number intervals of 1626 and 1457cm-1.
Common adsorption band of –CH around wave numbers 1626 and 1027 cm-1 was shifted after coating
the leaves. The peak at 1737 and 1527 cm-1 was
attributed to the presence of oxygen functional groups such as a conjugated C–O stretching in carboxylic groups [21]. Another absorption bands revealing around 1238 and 452 cm-1 contributed to the Si–C
stretch and C–O–H twist [22]. The observed peak at 1027 cm-1 is assigned to –CN stretch of aliphatic
amines [23]. On interpreting the FTIR spectra of chitosan-coated Jojoba leaves, the spectrum displays the absorption of both chitosan and the raw material. The major bands arising in the spectrum were as a result of the stretching vibrations of –OH groups in the range 3750 to 3000 cm-1 which are imbricate to the
stretching vibration of N–H and C–H band in CH2 (2922
cm-1) and –CH2 (2852 cm-1) groups, respectively [24].
Absorption band in the range of 1627–1450 cm-1 was
ascribed to the vibration of carbonyl bonds (C=O) of the amide group CONHR [secondary amide] and the vibration of the protonated amine group. The limited peak at 515 cm-1 correlates to oscillating of the
saccharide structure of chitosan [25].
X-ray fluorescence analysis
The mineralogical composition of pure chitosan and investigated adsorbents were depicted in Table 1. The major constituents detected by the XRF of pure chitosan and the Jojoba leaves are mainly Si, Fe, Al, and Ca. After the coating process, the percentage of these elements increased. Therefore, these findings were quite surprising and suggest the possibility that chitosan could be successfully cross-linked on the surface of Jojoba leaves.
Fig 2. SEM image of (a) JL and (b) CJL
Amina Abdel Meguid Attia et al.
Fig 3. FTIR spectra of (a) JL and (b) CJL
Table 1. Chemical composition of chitosan, Jojoba leaves and coated jojoba leaves
Main Constituents (wt.%) Chitosan JL CJL
Si 1.373 0.079 0.134
Al 0.106 0.024 0.036
Fe 0.091 0.061 0.092
Mn 0.016 ND 0.008
Zn ND 0.007 0.005
Sr ND 0.002 0.003
Mg ND 0.127 0.096
Ca 66.260 0.233 0.282
K ND 0.495 0.480
Na ND 0.049 0.044
Nd ND ND 0.024
P ND 0.249 0.277
S ND 0.346 0.353
Cl ND 0.136 0.173
LO 67.846 98.190 97.990
ND = not detected
Amina Abdel Meguid Attia et al.
Fig 4. Effect of initial dye concentration on breakthrough curve for fixed-bed adsorption of CR by (a) JL and (b) CJL
Table 2. Column parameters of raw Jojoba leaves for CR adsorption at different initial concentration, bed height, and
flow rate
ttotal (min) qtotal (mg) qexp (mg/g) Mtotal (g) % Removal
Initial concentration
50 mg/L 200 13 0.004 30 57
100 mg/L 150 26 0.008 45 43
Bed height
3 cm 150 20 0.003 45 46
4 cm 211 40 0.009 63 57
Flow rate
3 mL/min 150 21 0.003 45 57
5 mL/min 120 14 0.004 50 29
Table 3. Column parameters of coated Jojoba leaves for CR adsorption at different initial concentration, bed height,
and flow rate
ttotal (min) qtotal (mg) qexp (mg/g) Mtotal (g) % Removal
Initial concentration
50 mg/L 222 18 0.006 33 69
100 mg/L 185 35 0.014 56 56
Bed height
3 cm 185 35 0.014 56 56
4 cm 350 73 0.020 105 69
Flow rate
3 mL/min 185 35 0.014 56 69
5 mL/min 150 26 0.008 75 35
Fixed-Bed Adsorption Studies
Effect of initial dye concentration
The performance of the breakthrough curves is illustrated in Fig. 4 by using different dye concentrations. From this figure, it was obvious that the breakthrough occurred in a short period of time for high dye concentration, while the breakthrough occurred latterly for low dye inlet concentration and the surface of the adsorbents was saturated after a long period of time. Therefore, at a lower concentration, the breakthrough was planer due to lower mass transfer in the adsorption process, on the contrary, at high inlet dye concentration the profile of breakthrough were sharp implying an
Amina Abdel Meguid Attia et al.
Fig 5. Effect of flow rate on breakthrough curve for fixed bed adsorption of CR by (a) JL and (b) CJL
Fig 6. Effect of bed depth on breakthrough curve for fixed bed adsorption of CR by (a) JL and (b) CJL
while the percentage removal decreased for both JL and CJL. However, the amount of CJL showed the highest removal.
Effect of flow rate
The flow rate is an essential factor for predicting the proficiency of adsorbent. The breakthrough curves at various flow rates are presented in Fig. 5. This figure displays that breakthrough curves mostly occurred faster at a higher flow rate which may be correlated with the availability of reaction sites able to capture dye molecules inside or around the adsorbents, so the removal efficiency became ineffective. Additionally, the column was capable to accumulate CR dye after the occurring of breakthrough curve. It has been depicted that increasing the flow rate was accompanied by a decrease in dye removal. This interpretation was based on the fact that the residence time of CR dye was not sufficient to reach adsorption equilibrium at that flow rate. This can be explained on the basis that there is not enough contact time between the dye and the adsorbent resulting in less diffusion of liquid present in the column.
This induces a lower distribution of the solute through the adsorbent [27]. The column parameters obtained from the effect of flow rate are listed in Table 2 and 3. As can be seen, the total amount of CR dye adsorbed increased, while the percentage removal decreased.
Effect of bed depth
The quantity of adsorbent inside the column greatly affects the accumulation of adsorbate in the fixed-bed column. Fig. 6 presents the effect of bed height on simulated breakthrough curves. It was revealed from this figure, that by increasing the bed height, this allows the solute to have enough time to diffuse into both adsorbents and permits high removal efficiency. The slope of the breakthrough curve decreased with an increase in the bed height which derived in a broadened mass transfer zone. This was owed to a large surface area of adsorbents leading to more binding sites for adsorption [28-29]. The column parameters for both adsorbents obtained from the effect of bed height are given in Table 2 and 3.
Amina Abdel Meguid Attia et al.
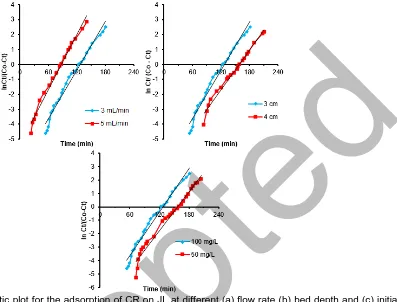
Fig 7. Thomas kinetic plot for the adsorption of CR on JL at different (a) flow rate (b) bed depth and (c) initial
concentration
All Tables display that the removal capacity of CR by coated jojoba leaves showed higher values over that of raw Jojoba. Based on these results, it can be ascribed that the adsorption process is an electrostatic process between the anionic dye (CR) and the amino groups of the chitosan. In aqueous solutions, CR dye is ionized into anionic dye with sulphonate groups and the amino groups were protonated which makes it positively charge. Thus, the removal of CR with chitosan is mainly due to the electrostatic reaction between the amino groups of chitosan (NH3+) and the sulphonate group of
the anionic dye (SO3-).
Breakthrough Curve Modeling
Several mathematical models have been advanced for analyzing column performance and to scale it up for industrial utilization. In this research, Thomas and Yoon-Nelson models were applied to identify the best model for predicting the dynamic behavior of the column.
Thomas model
The column data were fitted to the Thomas model to determine the constants KTH and qo which were
calculated from the slope and intercept of a linear plot of ln (Co/Ct – 1) versus time under different adsorption
parameters (flow rate, dye concentration, and bed height) for both adsorbents. The prediction of breakthrough curves for JL and CJL conferring to Thomas model is represented in Fig. 7 and 8. The obtained Thomas model parameters and experimental values of qo are provided in Table 4. According to the
determined coefficient (R2), Thomas model was
applicable to the experimental data. In addition, the consistent values of qo and qoexp displayed the
suitability of this model. Increasing the influent concentration led to an increase in the value of KTH and
a decrease in the value of qo. This is attributed to the
driving force of adsorption between the dye existed on both adsorbents and the dye present in the solution [30-31]. However, qo increased and KTH decreased with
Amina Abdel Meguid Attia et al.
Fig 8. Thomas kinetic plot for the adsorption of CR on CJL at different (a) flow rate (b) bed depth and (c) initial
concentration
Table 4. Column kinetic parameters for the adsorption of CR using Thomas and Yoon - Nelson Models
Thomas Model Yoon - Nelson Model
KTH(mL/min/mg) qo (mg/g) R2 KYN(min-1) τ R2
Adsorbents Flow rate (mL)
JL 3 0.030 5.90 0.99 0.042 130 0.97
5 0.040 3.10 0.98 0.056 75 0.98
CJL 3 0.014 3.08 0.97 0.016 255 0.99
5 0.025 1.78 0.98 0.025 105 0.97
Adsorbents Initial conc. (mg/L)
JL 50 0.047 4.60 0.97 0.020 150 0.96
100 0.030 5.90 0.99 0.042 130 0.97
CJL 50 0.020 2.50 0.95 0.011 290 0.96
100 0.014 3.08 0.97 0.016 255 0.99
Adsorbents Bed Height (g)
JL 3 0.030 5.90 0.99 0.042 130 0.97
4 0.025 6.50 0.98 0.037 150 0.99
CJL 3 0.014 3.08 0.97 0.016 255 0.99
4 0.009 4.40 0.98 0.009 360 0.98
the increase in bed height. This might be attributed to the increase in mass-transport resistance with increasing bed height in columns. Furthermore, with increasing the flow rate, the value of qo decreased but the value of KTH
increased. This is due to that at higher flow rate there is a deficient residence time of the solution inside the column and migration on of the solute into the pores of both adsorbents which leads to lower adsorption
capacity and thus the solute leaves the column before equilibrium occurs [32]. Accordingly, with lower flow rate, lower initial dye concentration and higher bed depth would increase the adsorption of CR on both adsorbents column. The experimental data were fitted with the linear form of the Thomas model indicates the absence of axial dispersion where the exterior and interior diffusion is not the limiting step.
Amina Abdel Meguid Attia et al.
Fig 9. Yoon - Nelson kinetic plot for the adsorption of CR on JL at different (a) flow rate (b) bed depth and (c) initial
concentration
Fig 10. Yoon - Nelson kinetic plot for the adsorption of CR on CJL at different (a) flow rate (b) bed depth and (c)
initial concentration
Amina Abdel Meguid Attia et al.
Yoon-Nelson model
Yoon-Nelson Model was applied to predict the adsorption technique and the breakthrough curves. The values of τ and KYN were calculated from the linear plots
of ln (Ct/Co – Ct) versus time (min) at different flow rates,
bed heights and initial dye concentrations for the adsorption of CR onto JL and CJL (Fig. 9 and 10) and their values are listed in Table 4. It is obviously shown that as the initial dye concentration and flow rate increased for both adsorbents, the value of τ decreased and KYN increased. This is owing to the minor residence
time of solute in the column. Additionally, the force controlling the mass transfer in liquid phase could clarify the increase in KYN. This led to a prolonged time for the
bed to get saturated. However, increasing the bed height led to a decrease in the in the rate constant KYN and τ
increased. This result is ascribed to the availability of more adsorption sites [33-34]. It can be seen according to the values of correlation coefficient (R2) that
Yoon-Nelson model adequately describes the adsorption of CR on both adsorbents to the experimental data. Accordingly, to these findings the coated Jojoba leaves displayed more appropriate adsorption performance than raw Jojoba leaves.
CONCLUSION
This study validated that the raw Jojoba leaves and the modified chitosan were effective adsorbents for the uptake of CR in fixed-bed column studies. FTIR analysis illustrates that chitosan was successfully loaded onto jojoba leaves. Results revealed that the adsorption capacity of the modified leaves was higher than that for jojoba leaves. The dynamic dye adsorption data was studied under varying conditions including initial dye concentration, flow rate, and bed height. From the outcome of our investigation, it is possible to conclude that the percentage dye removal was found to increase by increasing the bed height, while decreased with the increase in flow rate and initial dye concentration. However, increasing bed height resulted in an increase in the breakthrough time while decreased by increasing the dye concentration and flow rate. The revelation of breakthrough curves and the determination of the kinetic column parameters were studied by using the Thomas and Yoon-Nelson models. The high values of correlation coefficients (R2) indicated the applicability of both
models.
REFERENCES
[1] Mohan, N., Balasubamanian, N., and Basha, C.A., 2007, Electrochemical oxidation of textile wastewater and its reuse, J. Hazard. Mater., 147 (1-2), 644–651.
[2] Sharma, M.K., and Sobti, R.C., 2000, Rec effect of certain textile dyes in Bacillus subtillis, Mutat. Res. Genet. Toxicol. Environ. Mutagen., 465 (1-2), 27– 38.
[3] Shen, D., Fan, J., Zhow, W., Gao, B., Yue, Q., and Kang, Q., 2009, Adsorption kinetics and isotherms of anionic dyes onto organo-bentonite from single and multisolute systems, J. Hazard. Mater., 172 (1), 99–107.
[4] Lee, J.W., Choi, S.P., Thiruvenkatachari, R., Shim, W.G., and Moon, H., 2006, Evaluation of the performance of adsorption and coagulation processes for the maximum removal of reactive dyes, Dyes Pigm., 69 (3), 196–203.
[5] Salleh, M.A.M., Mahmoud, D.K., Karim, W.A.W.A., and Idris, A., 2011, Cationic and anionic dye adsorption by agricultural solid wastes: A comprehensive review, Desalination, 280 (1-3), 1– 13.
[6] Aroua, M.K., Leong, S.P.P., Teo, L.Y., Yin, C.Y., and Duad, W.M.A.W., 2008, Real-time determination of kinetics of adsorption of lead(II) onto palm shell-based activated carbon using selective electrode, Bioresour. Technol., 99 (13), 5786–5792.
[7] Reddy, M.C., Savaramakrishna, L., and Reddy, A.V., 2012, The use of an agricultural waste material, Jujuba seeds for the removal of anionic dye (Congo red) from aqueous medium, J. Hazard. Mater., 203-204, 118–127.
[8] Budnyak, T.M., Pylypchuk, L.V., Tertykh, V.A., Yanovska, E.S., and Kolodynska, D., 2015, Synthesis and adsorption properties of chitosan-silica nanocomposite prepared by sol-gel method, Nanoscale. Res. Lett., 10 (87), 1–10.
[9] Li, N., Ren, J., Zao, L., and Wang, Z., 2013, Fixed bed adsorption study on phosphate removal using nanosized FeOOH-modified anion resin, J. Nanomater., 736275, 1–5.
[10] Nguyen, V.C., and Pho, Q.H., 2014, Preparation of chitosan coated magnetic hydroxyapatite nanoparticles and application for adsorption of reactive blue 19 and Ni2+ ions, Sci. World J.,
27308, 1–9.
[11] Dragostin, O.M., Samal, S.K., Dash, M., Lupascu, F., Pânzariu, A., Tuchilus, C., Ghetu, N., Danciu, M., Dubruel, P., Pieptu, D., Vasile, C., Tatia, R., and Profire, L., 2016, New antimicrobial chitosan derivatives for wound dressing applications, Carbohydr. Polym., 141, 28–40.
[12] Sakkayawong, N., Thiravetyan, P., and Nakbanpote, W., 2005, Adsorption mechanism of synthetic reactive dye wastewater by chitosan, J. Colloid Interface Sci., 286 (1), 36–42.
Amina Abdel Meguid Attia et al.
[13] Kousha, M., Daneshuar, E., Sohrabi, M.S., Jokar, M., and Bhatnagar, A., 2012, Adsorption of acid orange I) dye by raw and chemically modified brown marcragla Staechospermun marginatum, Chem. Eng. J., 192, 67–76.
[14] Albroomi H.I., Elsayed, M.A., Baraka, A., and Abdelmaged, M.A., 2016, Batch and fixed-bed adsorption of tartrazine azo-dye onto activated carbon prepared from apricot stones, Appl. Water Sci., 7 (4), 2063–2074.
[15] Low, W.L., Teng, T.T., Morad, N., and Azhari, B., 2014, Optimization of the column studies into the adsorption of basic dye using tartaric acid treated bagasse, Desalin. Water Treat., 52 (31-33), 6194– 6205.
[16] Zheng, P., Bai, B., Guan, W., Wang, H., and Sao, Y., 2016, Fixed bed column studies for the removal of anionic dye from aqueous solution using TiO2@glucose carbon composites and bed
regeneration study, J. Mater. Sci. - Mater. Electron., 27 (1), 867–877.
[17] Chowdhury, Z.Z., Zain, S.M., Rashid, A.K., Rafique R.F., and Khalid, K., 2013, Breakthrough curve analysis for column dynamics sorption of Mn(II) ions from wastewater by using Mangostana garcinia peel-based granular-activated carbon, J. Chem., 959761, 1–8.
[18] Kulkarni, S.J., and Kaware, J.P., 2015, Analysis of packed adsorption column with low cost adsorbent for cadmium removal, Int. J. Therm. Environ. Eng., 9 (1), 17–24.
[19] Lekić, B.M., Marković, D.D., Rajaković-Ognjanović,
V.N., Đukić, A.R., and Rajaković, L.V., 2013,
Arsenic removal from water using industrial by-products, J. Chem., 121024, 1–9.
[20] Foroughi-dahr, M., Esmaieli, M., Abolghasemi, H., Shojamoradi, A., and Pouya, E.S., 2016, Continuous adsorption study of Congo red using tea waste in a fixed-bed column, Desalin. Water Treat., 57 (18), 8437–8446.
[21] Zhao, B., Xiao, W., Shang, Y., Zhu, H., and Han, R., 2017, Adsorption of light green anionic dye using cationic surfactant-modified peanut husk in batch mode, Arabian J. Chem., 10 (Suppl. 2), 3595–3602. [22] Yagub, M.T., Sen, T.K., Afroze, S., and Ang, H.M.,
2014, Fixed-bed dynamic column adsorption study of methylene blue (MB) onto pine cone, Desalin. Water Treat., 55 (4), 1026–1039.
[23] Sharififard, H., Ashtiani, F.Z., and Soleimani, M., 2013, Adsorption of palladium and platinum from aqueous solutions by chitosan and activated carbon coated with chitosan, Asia-Pac. J. Chem. Eng., 8 (3), 384–395.
[24] Auta, M., and Hameed, B.H., 2013, Coalesced chitosan activated carbon composite for batch and
fixed-bed adsorption of cationic and anionic dyes, Colloids Surf., B, 105, 199–206.
[25] Paluszkiewicz, C., Stodolak, E., Hasik, M., and Blazewicz, M., 2011, FT-IR study of montmorillonite-chitosan nanocomposite materials, Spectrochim. Acta, Part A, 79 (4), 784–788. [26] Afroze, S., Sen, T.K., and Ang, M., 2015,
Adsorption performance of continuous fixed bed column for the removal of methylene blue (MB) dye using Eucalyptus sheathiana bark biomass, Res. Chem. Intermed., 42 (3), 2343–2364.
[27] Gong, J.L., Zhang, Y.L., Jiang, Y., Zeng, G.M., Cui, Z.H., Liu, K., Deng, C.H., Niu, Q.Y., Deng, J.H., and Huan, S.Y., 2015, Continuous adsorption of Pb(II) and methylene blue by engineered graphite oxide coated sand in fixed-bed column, Appl. Surf. Sci., 330, 148–157.
[28] Chowdhury, S., and Saha, P.D., 2013, Artificial neural network (ANN) modeling of adsorption of methylene blue by NaOH-modified rice husk in a fixed-bed column system, Environ Sci. Pollut. Res., 20 (2), 1050–1058.
[29] Chen, N., Zhang, Z., Feng, C., Lia, M., Chen, R., and Sugiura, N., 2011, Investigations on the batch and fixed-bed column performance of fluoride adsorption by Kanuma mud, Desalination, 268 (1-3), 76–82.
[30] Han, R., Ding, D., Xu, Y., Zou, W., Wang, Y., Li, Y., and Zou, L., 2008, Use of rice husk for the adsorption of Congo red from aqueous solution in column mode, Bioresour. Technol., 99 (8), 2939– 2946.
[31] Lin, X., Li, R., Wen, Q., Wu, J., Fan, J., Jin, X., Qian, W., Liu, D., Chen, X., Chen, Y., Xie, J., Bai, J., and Ying, H., 2013, Experimental and modeling studies on the sorption breakthrough behaviors of butanol from aqueous solution in a fixed-bed of KA-I resin, Biotechnol. Bioprocess Eng., 18 (2), 223–233.
[32] Ponnusami, V., Vikram, S., and Srivastawa, S.N., 2008, Guava (Psiduim guajava) leaf powder novel adsorbent for removal of methylene blue from aqueous solutions, J. Hazard. Mater., 152 (1), 276–286.
[33] López-Cervantes, J., Sànchez-Machado, D.I., Sànchez–Duarte, R.G., and Correa-Murrieta M.A., 2017, Study of a fixed-bed column in the adsorption of an azo dye from aqueous medium using a chitosan-glutaraldehyde biosorbent, Adsorpt. Sci. Technol., 1–18.
[34] Han, R., Wang, Y., Zho, X., Wang, Y., Xie, F., Cheng, J., and Tang, M., 2009, Adsorption of methylene blue by pheonix tree leaf powder in a fixed-bed column: experiments and prediction of breakthrough curves, Desalination, 245 (1-3), 284–297.
![SYNTHESIS OF POLYPROPYLCALIX[6]ARENE FROM p- t -BUTYLPHENOL AS ADSORBENT FOR Cr(III) METAL ION | Prabawati | Indonesian Journal of Chemistry 21417 40503 1 PB](data:image/gif;base64,R0lGODlhAQABAIAAAP///wAAACH5BAEAAAAALAAAAAABAAEAAAICRAEAOw==)