Rainwater Management Model Development for Agriculture in
the Savu Island Semi-Arid Region
Susilawati, C.L.1
Abstract: Savu Island is a semiarid region with few rainfalls. The meager annual rainfall of about 1,000-1,500 mm that lasts for three to five months tends to cause draught. To cope with this situation, the Author tries to develop a rainwater management model located in Daieko village. This model constitutes an infrastructure that consists of check dam series which are constructed by simulating a computerized model of decision supporting system called “Rainwater Management for Agriculture Decision Support System (RMA-DSS) model” in the research location of Daieko village. Employing a simulated RMA-DSS model; the locations for check-dam series, and dug-wells can be determined, the size of potential irrigable lands can be determined based on water balance analysis of water samples taken from simulated check dams and inundated lands. Through this model the sufficiency of water supply for agricultural purposes and the land size for cultivation area can be predicted with a high degree of certainty.
Keywords: rainwater management, agriculture, check-dam series, decision support system, dug-wells.
Introduction
Savu Island (Figure 1), more known as a cluster of Savu and Raijua islands – so, Savu-Raijua, is one of the small outer islands in the eastern part of Indonesia with a size of 424.15 square kilometers. This cluster of islands has recently become new regency by the name of Savu-Raijua regency in East Nusa Tenggara Province.
– –
Savu – Raijua Islands Timor Flores
Sumba
Figure 1. Savu and Raijua Islands between Timor– Sumba–Flores Islands [1]
1 Civil Engineering Department, Widya Mandira Catholic
Univer-sity, Kupang, West Timor, East Nusa Tenggara, INDONESIA. Email: [email protected]
Note: Discussion is expected before June, 1st 2012, and will be
published in the “Civil Engineering Dimension” volume 14, number
2, September 2012.
Received 10 May 2011; revised 11 January 2012; accepted 03 February 2012.
This area is basically a semiarid region with few rainfalls that last for three to five months. The cumulative annual rainfall is about 1,000-1,500 mm. In the Savu Island itself, the average annual rainfall is around 1,200 mm, with four months of wet season and eight months of dry season. This low rainfall has time again resulted in draught disaster as once happened in 2004 [2].
Topographically, this island consists of lowland area with the elevation of 0-100 meters above sea level, and upland area with the elevation of 100-350 meters above sea level. The lowland area is located in the North-East and part of South-West while the upland area is situated in the central part of the island, sloping southward [3, 4].
Development of Rainwater Management
Model for Agriculture
The development of rainwater management model for agricultural purposes in Daieko village is an effort to develop an infrastructure that consists of check-dam series which locations are determined by simulating a computerized model of RMA-DSS. This infrastructure serves to inhibit runoffs that flow through natural drainage gullies in order to prevent them from being wasted into the sea. This construc-tion model is designed as a structure that consists of check-dam series placed at the natural drainage gullies.
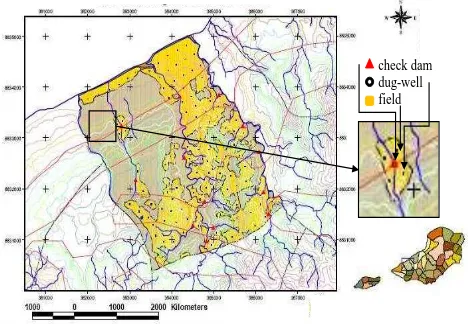
From the field data on water levels that have been collected from several dug wells in Savu island, the Author can estimate the ground water level contour in Savu Island. The contour of ground-water is very important to determine the directions of water-flow in the ground, so that the locations of wells to be dug, from which the water can be taken to irrigate the cultivated lands, can be determined. All of these are done prior to the construction of rainwater manage-ment structure (Figure 2).
The development of this model takes place in Daieko village that has an area of 1,272 hectares bordering in the North with Savu Sea, Pederro village in the South, Raedewa and Djadu villages in the East and Molie and Tanadjawa villages in the West.
Geogra-phically, Daieko village is located between two rivers (or brook to be precise), namely Loko Liputaga in the West and Loko Kabila in the East. Within the village itself there are two brooks, namely Loko Ujula and Loko Roalie. Loko Ujula has catchment area of 852 hectares, 67.5 percent of which is located in Daieko village (45 percent of the Daieko village area), and the rest, 32.5 percent, in Pederro village (92.2 percent of the Pederro village size). Loko Roalie has catchment area of 151 hectares which are all situated in Daieko village [7].
To develop rainwater management model in the location, the Author has to develop beforehand a computerized rainwater management model for agriculture decision supporting system (RMA-DSS). Further, by simulating this model, it can be deter-mined where the check-dam structures can be con-structed on correct natural drainage gullies.
RMA Model Planning Simulation by the
RMA-DSS Model
Data needed in this RMA planning model simulation by RMA-DSS model are climate, daily rainfall, soil data, topographical map, land use and geology map. The rainfall data in this simulation is obtained from Daieko rainfall station that was installed on July 31, 2007 and started operating on August 1, 2007. This data was collected from August 2007 to July 2010 [8]. The climate data were taken from Tardamu-Seba Climate Station for the years 2007 to 2010 [2].
- 5 m
- 10 m
- 15 m
- 20 m
- 25 m Geologi_sa bu_ utm .shp
Aluvium BatuG amping K oral For masi Bisane For masi Noele For masi Ofu Kompleks B obona ro Adm _sabu_ line_utm .sh Prakiraan Kontur Muka Air Tanah
360000
Ground water level contour Administration Sabu Line
Ground water level contour Administration Savu Line
Limestone coral reef
Ofu Formation Bobonaro Formation
The climate data consist of maximum and minimum temperature, humidity, wind speed, and duration of sunshine. These data are analyzed by a computer program called Cropwat model which was developed by FAO [9] to find out the value of evapotranspira-tion (ETo). This value is then entered into the evaporation database in RMA-DSS model [5]. ETo will be the basis for crop evapotranspiration calcula-tion (ETc), or the amount of water requirement for crops if the specific crop data (Kc) is in hand.
From the spatial analysis of topographical map, land use and geology map, can be found: the value of runoff coefficient [10], percolation coefficient and water potential that can percolate into the soil as recharge for groundwater that can be used for crop irrigation [11]. Further, the curve relation between the area and the volume of water stored in the pond can be obtained. This relation is very helpful for detecting the water availability for irrigation in the dry season, which is followed up by digging wells in the field if it is needed.
The agricultural data system that consists of crop data, planting methods, irrigation system and soil cultivation system determine the need of water for the plants. The crops to be planted consist of sorghum, green bean, peanut and corn. By calculating the ETc, one can determine the planting pattern, the crop to be planted, and the planting date which must be adjusted to ground water supply and crop water management. Furthermore, it can also be found to what extent irrigation and drainage water is needed as it can be computed from the relation between the available water of effective rainfall and water neces-sity for the crops [12]. The positive difference bet-ween available and required water indicates the drainage water requirement, while the negative value indicates the irrigation water requirement.
The check dam pond water balance indicates the volume of spilled water, potential water to percolate into the soil, and the amount of water to be stored in the pond. The volume of water that percolates into the soil as ground water becomes the available water supply and an indicator of effective rainfall. Later, an optimized analysis is performed to find out the potential area for agricultural field in which the water management system can be realized. This potential area is compared to the planning of area that results in the safety factor for the development of this system.
Several steps in the RMA-DSS model simulation [13]:
1. Complete the needed data i.e. rainfall data and evapotranspiration data.
2. Complete the data worksheets on soil, catchment
area, runoff coefficient, infiltration coefficient, percolation coefficient and agricultural field area. These data are taken from spatial model of RMA-DSS [5].
3. To find the data above, one has to run the spatial program that has been linked to Excel program by clicking the rainfall icon. It will show river catchment area of Indonesian map, Savu island map, and Daieko map. By clicking the location of check-dam, it will display the catchment area completed with other information on the area, runoff coefficient, percolation coefficient, etc. After this, a puddle analysis can be performed on the check-dam pond and on the relation between the area and the volume of puddle water. The infor-mation about the agricultural field can be found in the spatial program.
4. From the completed data on spatiality and balance analysis of water in the simulated check-dam pond, and by comparing it to the result of water balance analysis of ground water from the field, one can determine the exact location of the check dam.
Construction Plan of Water Infrastructure
The initial steps prior to the construction plan of water infrastructure are as follows:
1. Study the land-use map of Daieko village, and concentrate especially on the land-use that can be converted into agricultural field. The bush is to be allocated for conservation with possible conver-sion into forest area that may serve as soil and water conservation area. For the rainfed paddy-field there can be options either for rice intensi-fication program of two or three times harvests per year or for vegetable cultivation. The agricul-tural conservation system to be applied in the agricultural land can be in the form of mixed crops planting system with bunds and gullies for drainages.
flowing directly into the sea, and to infiltrate it into subsoil. The defining of check-dam series location will be repeated again by Daieko RMA-DSS model considering especially the water balance in the check-dam pond and in the field in order for the researcher to define the best agricultural field that can be irrigated by these constructions.
Plot and draw the location of dug-wells that has to be adjusted to the location of check-dam series, direc-tion of groundwater flow and agricultural field – all that has to be taken into consideration when the RMA is to be constructed. The number of dug-wells is based on the practical reason as already practiced by farmers, which is for one hectare of cultivated area they dig two wells. The dug-wells also serve as storage of drainage water, that in turn to be drawn out to water the plants that in the dry season grow on unsaturated soil. Groundwater increases the soil moisture, not only below the water table but also within the capillary zone, above the water table [10]. This dug well is shown in Figure 3.
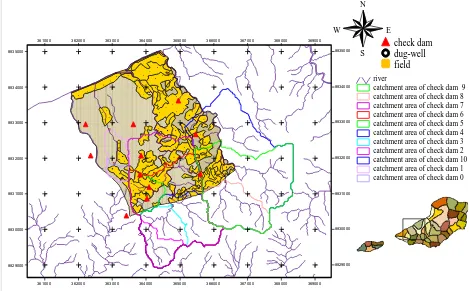
Sketch of Daieko-RMA Planning Model as illus-trated in Figure 4 consists of 13 check-dam series, natural drainage gullies and several field ponds.
The hole for drainage water
Figure 3. The Dug-well in the field
Discussion and Conclusion
The simulated location of check dam series that has been planned in the initial planning, has to be corrected because of the height of the dam that can reach 15 meters, which is too high, and the catch-ment area becomes too wide. As a result the volume of water that has been intercepted and retained in the ponds creates such a big puddle that decreases the agricultural area. The simulated position of the check dam in the gullies of Loko Roalie brook is situated among the agricultural areas. As such, it has to be moved upstream of the brook of the agricultural field, so that the penetrating water can
Ground water level contour Administration Sabu Line
check dam
dug-well
field
be taken through wells dug downstream. Correction of position has also to be made against the position of check-dam in gullies of Loko Ujula, it must be shifted upstream. The location of water-trap (check dam series) that was previously planned to be placed at the fork of a gully is now moved to the prime gully to get enough water input. The number and the position of the check-dams in gullies of Loko Kabila brook which was initially 5 must be reduced to 3 for the reason of sufficiency (as detected from water balance in the field). Its location has to be shifted upstream of the agricultural field. The final plan of Daieko-RMA planning model is shown in Figure 5.
The water balance analysis in the check-dam series gives the calculation of potential water that can penetrate into underground as supplement for groundwater reservoir. This penetrating water constitutes the recharge of water available for crops beside the quantity of effective rainwater. The simulation of water balance analysis has been carried out in four phases. The first and the second phases are the simulation for check-dams 1 and 2. The volume of water that can be caught through water-trap 1 is 50,449 m3 per year and water-trap 2
is 92,550 m3 per year. The third phase, that is the
simulation for check-dams 3, 4, 5, 6, 7, and 8, produces a water volume that penetrates through these check-dams as big as 660,356 m3 per year. The
last phase, that is the simulation for the check-dams
9, 10, and 11, produces a water volume that penetrates through these check-dams, as big as 545,705 m3 per year.
The field water balance analysis is conducted under the condition of availability of groundwater that can be taken to fulfill the needs of agricultural requirement. From this analysis, the optimum size of irrigable land can be found. The simulation of analysis of field water balance is carried out in four phases. The first and second phases are the analyses of water balance in the gullies of Loko Roalie brook that produces an optimum size of agricultural area as big as 22.82 hectares for check-dam 1 and 41.84 hectares for check-dam 2. The agricultural area that has been planned for check-dam 1 is 10.97 hectares, or it means that the safety factor of RMA trade is 2.08. Check-dam 2, in the meantime, has been planned to serve an agricultural area as big as 40.14 hectares, or the safety factor for the RMA trade is 1.04. The simulation of water balance analysis in the third phase for check-dams 3, 4, 5, 6, 7, and 8, produces an optimum agricultural area with a size of 298.54 hectares whereas the planned agricultural area is 272.97 hectares. It means that the safety factor of RMA trade is 1.09. The fourth phase is the simulation for the check-dams 9, 10, and 11. This simulation produces an optimum cultivation area of 241.09 hectares. It means that the safety factor is
Rancangan Final Model PAHP - Daieko
361000
catchment area of check dam 9 catchment area of check dam 8 catchment area of check dam 7 catchment area of check dam 6 catchment area of check dam 5 catchment area of check dam 4 catchment area of check dam 3 catchment area of check dam 2 catchment area of check dam 10 catchment area of check dam 1 catchment area of check dam 0
By examining the two analyses above, we can establish the locations for the check-dams and dug-wells and the land size for cultivation and as such assuring the available supply of water for the crops.
References
1. Google Earth, Map of Savu-Raijua Islands, 2009. 2. BMG Lasiana Kupang, Data Iklim Station Iklim
Tardamu Seba Tahun 1980–2010. BMG– Kupang, 2011
3. Bakorsurtanal, Peta Digital Pulau Savu-Raijua, Bogor, 2006.
4. Rosidi, Suwitodirdjo, Tjokrosapoetro, Peta Geologi Lembar Kupang–Atambua, Timor. Pusat Pene-litian dan Pengembangan Geologi (P3G), Bandung, 1996.
5. Susilawati, C.L., and Tunggul, S., Model Develop-ment of Rainwater ManageDevelop-ment for Agriculture Decision Support System in Semi Arid Area.
Civil Engineering Dimension Journal of Civil Engineering Science and Application, 13(1), 2011, pp. 107-112.
6. Sucipto, Laporan Geologi Studi Kekeringan di Pulau Savu-Raijua. Bandung, 2006.
7. Sucipto, Iskandar Y, Susilawati, Advis Teknik Sumber Daya Air, Research Report, Bandung, 2007.
8. Lobo, B., Data Hujan Harian Stasiun Hujan Daieko. Laporan Pengamatan Stasiun Hujan Daieko, 2010.
9. Clarke, D., CropWat for Windows: User Guide, FAO Irrigation and Drainage Paper No. 46, Rome, 1998. http://www.fao.org:80/WAICENT/ FAOINFO/AGRICULT/AGL/aglw/CROPWAT.h tm
10.Ronald, M., The Decline of Soil Infiltration Capa-city Due to High Elevation Groundwater, Civil Engineering Dimension, Journal of Civil Engineering Science and Application, 10(1), 2008, pp. 35-39.
11.Mc Cuen, M., Tabulated Values of Rational Method of Runoff Coefficient, 2004. .http://www. utd.edu/~brikowi/Teaching/Applied_Modeling/Su rfaceWater/LectureNotes/Rational_Method/Run off_Coefficient.html.
12.Dastane, N.G., Effective Rainfall in Irrigated Agriculture,FAO Irrigation and Drainage Paper No. 25, Rome, 1978.http://www.fao.org/DOCREP/ X5560E/x5560e00.htm
![Figure 1.–Sumba Savu and Raijua Islands between Timor–– –Flores Islands [1]](https://thumb-ap.123doks.com/thumbv2/123dok/3672936.1469816/1.595.84.256.481.632/figure-sumba-savu-raijua-islands-timor-flores-islands.webp)
![Figure 2. The Ground Water Level Contour of the Savu Island [6]](https://thumb-ap.123doks.com/thumbv2/123dok/3672936.1469816/2.595.75.538.472.748/figure-ground-water-level-contour-savu-island.webp)