AUTOMATIC PEDESTRIAN CROSSING DETECTION AND IMPAIRMENT ANALYSIS
BASED ON MOBILE MAPPING SYSTEM
Xinyi Liu a, Yongjun Zhang a*, Qian Li b
a School of Remote Sensing and Information Engineering, Wuhan University, Hubei, China - (liuxy0319, zhangyj)@whu.edu.cn b Wuhan Zhongyuan Electronics Group Co., Ltd., Hubei, China - [email protected]
Commission II, WG II/1
KEY WORDS: Pedestrian Crossing, Feature Extraction, Impairment Analysis, Support Vector Machine, Mobile Mapping System
ABSTRACT:
Pedestrian crossing, as an important part of transportation infrastructures, serves to secure pedestrians’ lives and possessions and keep traffic flow in order. As a prominent feature in the street scene, detection of pedestrian crossing contributes to 3D road marking reconstruction and diminishing the adverse impact of outliers in 3D street scene reconstruction.Since pedestrian crossing is subject to wearing and tearing from heavy traffic flow, it is of great imperative to monitor its status quo. On this account, an approach of automatic pedestrian crossing detection using images from vehicle-based Mobile Mapping System is put forward and its defilement and impairment are analyzed in this paper. Firstly, pedestrian crossing classifier is trained with low recall rate. Then initial detections are refined by utilizing projection filtering, contour information analysis, and monocular vision. Finally, a pedestrian crossing detection and analysis system with high recall rate, precision and robustness will be achieved. This system works for pedestrian crossing detection under different situations and light conditions. It can recognize defiled and impaired crossings automatically in the meanwhile, which facilitates monitoring and maintenance of traffic facilities, so as to reduce potential traffic safety problems and secure lives and property.
1. INTRODUCTION
With the progress of urbanization, there has been a great increase in urban population density and traffic infrastructures. Pedestrian crossing, as an important part of transportation infrastructures, serves to secure lives and possessions and keep traffic flow in order. As a prominent feature in the street scene, detection of pedestrian crossing contributes to 3D road marking reconstruction (Soheilian, 2010) and diminishing the adverse impact of outliers in 3D street scene reconstruction (Zhang, 2015). For the need of automatic monitoring over traffic infrastructures, overdue repair and maintenance will produce potential perils of traffic safety. Therefore, an approach to automatic pedestrian crossing detection and the impairment analysis with low costs and high efficiency is called for to maintain constant monitoring over a large number of pedestrian crossings. An approach to automatically detect pedestrian crossing area from sequence image and recognize the impairment within the area will be able to facilitate the traffic administrative department to monitor those traffic facilities in bad status and make timely repair or maintenance, so as to reduce traffic safety hazards and safeguard lives and property.
Vehicle-based Mobile Mapping System (MMS), due to its low cost, high speed and great continence in repeatedly collecting urban traffic data, is able to provide images of rich details with high temporal and spatial resolution, which makes possible periodic supervision over pedestrian crossing and automatic analysis of impairment. Based on images from vehicle-based MMS, algorithms for pedestrian crossing automatic detection and analysis of defilement and impairment are put forward in this paper. The images were taken along the road so that the images were taken perpendicularly to the pedestrian crossing. Moreover, the algorithm for pedestrian crossing automatic detection is robust to data collected from different sources, since data may
* Corresponding author
come from less rigorous devices such as black box DVRs (Driving Video Recorder), traffic surveillance videos, and mobile phones.
In terms of pedestrian crossing detection, current approaches have been focused on that of a single crossing area from close-range images taken from a vehicular angle (Sichelschmidt, 2010), as well as in this paper, in which ANN model is employed. With rather good robustness for pedestrian crossing detection in various scenarios, their approach works perfectly with plentiful precise camera parameters and data of pedestrian crossing width, but not with images taken at any time by DVRs or mobile phones with unknown interior and exterior orientation. In the research conducted by (Boudet, 2009), the position of a pedestrian crossing is located, with data from traffic surveillance videos converged, by constantly monitoring pedestrians’ moving trails. Detection results via this approach are immune to occlusion or barriers but are subject to surveillance coverage and camera angles and unable to estimate pedestrian crossing scenarios. While in researches conducted by (Uddin, 2004, 2005b, 2005c) and (Shioyama, 2004), either a pedestrian perspective is adopted or the length of the pedestrian crossing is measured to assist blind people crossing a road. The studies conducted by (Ma, 2009), (Se, 2000), and (Uddin, 2005a, 2005c, 2005d) also adopt the approach of detecting a single pedestrian crossing using images taken from a pedestrian perspective. But all these studies aim to extract pedestrian crossing contours.
In general, most of the aforementioned studies aim to detect or extract pedestrian crossing contours from a pedestrian perspective so as to build a guiding system for blind people, usually unable to detect the defilement and impairment of pedestrian crossing. On account of existing research and based on AI and ANN, this paper develops an approach to
automatically detect pedestrian crossing and analyzing its impairment status, which will ensure a supervision over the completeness of pedestrian crossing and greatly facilitate discovering flaking paint, defilement and impairment of pedestrian crossing, reducing potential traffic safety hazards and safeguarding people’s lives and property.
The approach involved in this paper is bipartite: automatic recognition of pedestrian crossing in Section 2 and impairment analysis covered in Section 3. Since the analysis of defilement and impairment presupposes an algorithm that can provide stable recognition of pedestrian crossing with flakey paint, defilement or impairment, the parameters of the algorithm for automatic recognition should minimize the missing target number in the first place to improve recognition accuracy with subsequent processing methods. To this end, the approach will be subdivided into initial recognition algorithm in 2.1 and secondary false recognition elimination algorithm in 2.2. In Section 4, rigorous experiments and analyses are conducted in terms of recognition robustness, recognition performance indexing, and result assessment of impairment analysis. The performance of the proposed algorithm will be summarized in Section 5, as well as its merits and possible applications.
2. AUTOMATIC TARGET RECOGNITION OF PEDESTRIAN CROSSING
According to the criteria adopted by The Pattern Analysis, Statistical Modelling and Computational Learning Visual Object Classes Challenge (PASCAL VOC Challenge), the authoritative international competition in computer vision, the accuracy of an algorithm of recognition and detection is correlated with correct detection number ( ), false detection number ( ), correct negative number ( ), and false negative number ( ), then we can derive the following equations for Recall and Precision.
= �
�+� (1)
= �
�+� (2)
To ensure higher performance, it is common to apply strict constraints on detection, i.e. by increasing the time for repeated recognition of the same area, or limiting the length and width of target area, after which recognition results with high accuracy could be expected. However, the decrease of false detection number via this approach will inevitably lead to the increase of omission target number, while false detection still exist defi-nitely. To analyze the impairment status, it is significant to en-sure that a pedestrian crossing, even if highly defiled or impaired, could be automatically recognized. To this end, false negative number should be kept to a minimum at the initial recognition stage, so as to ensure a high Recall from the recognition results. Therefore, the algorithm is designed in the following logic of high Recall ensured by initial recognition results with loose limitations, followed by improvement of Precision by strict secondary false recognition elimination algorithm.
2.1 Classifier training strategy for recognition
This paper adopts the method of Haar-like (Lienhart, 2002) Adaboost classifier training (Viola, 2001) to obtain initial recognition results, with part of the data collected used for training set in classifier training and the rest for testing set. To ensure the impartiality in the assessment of this algorithm, data can be used either for training set or testing set. From data for the training set, images contain crossings are extracted as positive samples, while others as negative samples. To ensure the
robustness of the training, more than 1000 positive samples and nearly 5000 negative samples are used for classifier training.
Adaboost classifier, as a cascade classifier, is a series connection of various weak classifiers based on probably approximately correct learning (PAC learning) theory (Valiant, 1984; Kuchment, 2013 and Haussler, 1992), which enables rapid elimination of irrelevant area and focus on the target-similar area.
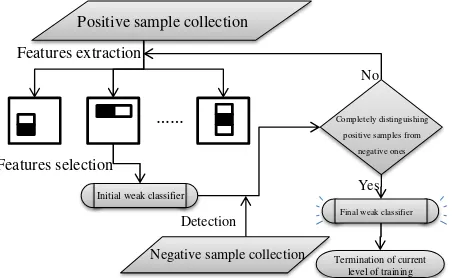
When every level of the weak classifier is trained, edge features are firstly extracted from positive samples via Haar-like feature template, then put into classifier together with negative samples, with conditions for training termination set up, i.e. when correctness greater than 99.9%. The training process is shown in the diagram in Figure 1.
Figure 1. Flow chart of every level of classifier training
Some features are extracted from positive samples to train initial crossing classifier, which will then be tested to check its correctness in distinguishing positive samples from negative ones. Otherwise, new features will be extracted from the database for further training and iteration until targeted result is achieved before the termination of the current stage.
After cascade classifier has been trained, images will be detected and the classifier will be put into the program for image recognition at the same time. There is no limit whatsoever in this process, in the hope of obtaining initial recognition results with high Recall of nearly no omission target at the cost of Precision regardless of the increase of false detection number. The initial recognition consists of hundreds of rectangular detection results, each of which cannot depict the complete crossing area but a part of a crossing.
To obtain a complete image of a crossing area, reduce false detection number, and improve precision, initial results should be integrated and false detection should be eliminated at the secondary stage.
2.2 Algorithm for false detection elimination
2.2.1 High-pass filtering of projection from images taken at a higher position: As mentioned before, images used in this algorithm for automatic crossing detection are taken along the road which is perpendicular to the pedestrian crossing, as demonstrated in Figure 2.
Data collected from traffic surveillance videos and vehicular cameras meet the requirement. Based on this characteristic, recognition of crossing detection appears to be a horizontal belt distribution with certain width on an image.
……
Figure 2. Photographic Model
Due to the above features, the right-aligned projection of initial recognition will be filtered along the height of images. Since loose restriction is applied to initial recognition, there might be hundreds of results recognized from a 1600*1200 image via crossing classifier. Those results seem to be messy, but following results can be found after been projected along the vertical edge of images.
Figure 3. Projection of initial recognition
As shown in Figure 3, the blue rectangular areas represent initial recognition results, and the red area represents the solid curve of the projection of rectangular area along axis y of the image.
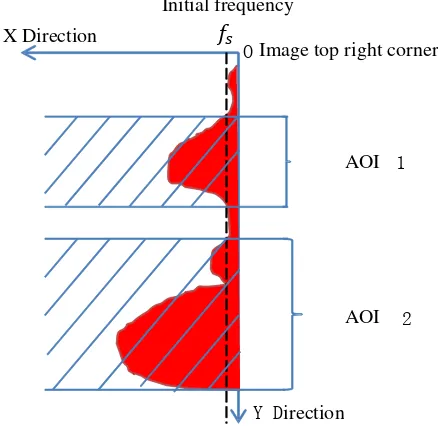
Figure 4. Sketch map of obtaining AOI via high-pass filtering
As demonstrated by the projective statistical curve, if crossing exists in an image, an obvious peak will appear in y range where the crossing locates. Based on high-pass filtering, we set up a rather small initial frequency , and set value y area higher than as Area of Interest (AOI), as shown in Figure 4. In this way, irrelevant recognition results with low frequency of recurrence
can be eliminated to obtain y range which suggests a highly possible existence of a crossing, namely, AOI.
According to a large number of conducted experiments, the aforementioned filtering method proves to be effective in eliminating most of non-target objects, but subject to the interruption of various traffic marker lines on the ground. Due to the bottleneck of edge features based classifiers in recognition, the classification model built on edge features is very sensitive to ground objects with distinct edge features, easily misled by various strip lines. Therefore it is difficult to distinguish various traffic marker lines with distinct edge features. Figure 5 represents several common AOIs after high-pass filtering.
Figure 5. Common AOIs obtained after high-pass filtering
It can be seen that there is no crossing but other types of traffic market lines in some of the AOIs. To remove the interruption of irrelevant traffic lines, we put forward a false detection elimination method based on edge features.
2.2.2 Elimination of false detection based on count of crossing strip: According to projective theorem, a crossing in the distance appears short in an image, while a nearby one appears long. Since the sensor platform is at work constantly with moving process, the same crossing will appear in several images, with its width becoming longer as shooting distance becoming shorter. To ensure the clarity of contour to be extracted, the system will make automatic filtering of AOIs (in the way similar to that described in 3.3); images taken 2-3m away from a crossing will be selected, and contour information based false detection elimination method will be applied to AOIs with wide side length on axis y. This will partially eliminate the effect of different visions on strip number difference in AOIs.
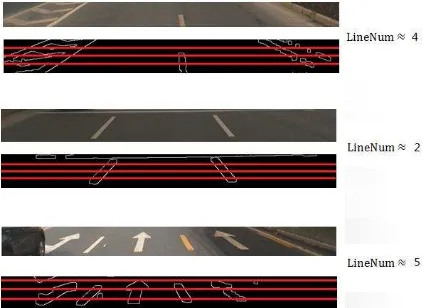
Then graying and edge extraction will be conducted to AOIs thus selected to produce a contour map of the ground object in AOI image. k horizontal lines, a.k.a. crossing lines, are drawn along
y-direction, and from the count of these lines crossing the contour we can figure out the number n of strips passed through by the crossing lines as well as the LineNum of strip lines in the AOI. The equation is as follows:
�= � (3)
= ∑��= �∙ � (4)
where k represents the total number of crossing lines, and �, � represent the number of the crossing line passing through the contour and the number of strip lines it passes through respectively. � is the weight relevant to the location of a crossing line. In terms of �, the coordinate of the crossing line on , the closer it gets to coordinate in AOI center, the larger the weight becomes. Figure 6 represents the original image, contour image and 3 crossing lines of a crossing AOI with sub-clarity, serious impairment respectively, as well as the value of respective
LineNum. Street direction
Image taking direction
Image taking direction
Y Direction X Direction
OImage top right corner Initial frequency
AOI 1
AOI 2
Figure 6. AOI map, contour map, crossing line map of a crossing with sub-clarity, as well as strip number calculated
Figure 7. AOI map, contour map, crossing line map of a serious impaired crossing, with strip number calculated
A large number of experiments proved what demonstrates in Figure 7, namely, the impairment condition of a crossing has limited effect on the value of LineNum. Even if a crossing is seriously defiled or impaired, a rather precise but still rough number of strips is still achievable with sufficient number of crossing lines. Figure 8 reveals the crossing line results of non-crossing AOI.
Figure 8. AOI map, crossing line map of a non-crossing area, as well as strip number calculated
It can be seen that, since strip density of a crossing is far larger than that of any other traffic marker lines, the LineNum value of a non-crossing AOI is usually smaller than that of a crossing AOI. Therefore, most non-crossing traffic marker lines can be eliminated according to strip LineNum value.
Apart from false detection elimination method based on contour information, the method based on monocular vision is employed to further reduce false detection number and improve Precision.
2.2.3 Elimination of false detection based on monocular vision: With false detection elimination method based on monocular vision (Haralick, 1989), a detection area is evaluated by the specifications for crossing dimensions combined with simple parameters of the censor’s posture. According to China’s specifications for traffic marker lines, the width of a crossing strip is fixed 40cm or 45cm, with interval of 60cm generally or 80cm, maximum; the width of a crossing ranges from 3m to 8m, widened by the unit of 1m; the width of a crossing ranges from 4m-6m on secondary roads, to 3m on bypasses. With the specifications above, actual length and width of known objects, as well as the height and focus of a camera, the width and location of crossing in an image can be roughly calculated based on monocular vision.
Figure 9. Interpretation of M’N’ and O’N’ in an image
Figure 10. Auxiliary chart of photographic light relations
In Figure 9, M’N’ represents the width of the crossing in the image, O’ the principal point, and N’O’ the vertical distance from the crossing to principal point. The length of line N’O’ can be used to locate the position of a crossing in an image. According to monocular vision, different visions may lead to different lengths of the crossing strip in an image, but when the direction of a crossing is perpendicular to image shooting direction, crossing strips share the same projective length in y-direction, which theoretically equals to M’N’, the length of the strip in an image center. Therefore, a strip-like AOI can be decided as a crossing or not, by comparing the width of AOI area with the calculated theoretical length of M’N’, and the location of AOI with vertical distance N’O’ to the image principle point. As shown in Figure 10, line KJ is the width of the crossing strip, line MN the length of the strip in the image center, line K’J’ the
O’
N’
M’
projection of line KJ on image plane, line M’N’ that of line MN,
O the projection center, OO’ perpendicular to the image plane,
OL, MP to the ground, and P a point in line ON. Plane OLN is perpendicular both to the ground and to the image plane.
Assuming that the image plane is perpendicular to the ground, then OM’, OM, OO’and ML are the height of triangle OK’J’,
OKJ, M’N’O and MPO, respectively. According to similarity relationship between the triangles:
′ ′ = ′ = ′ = ′ ′
(5)
= (6) ′ ′= ′ (7)
The length of OO’ equals to the focus f of the camera, and KJ is the strip width of the crossing. Based on the length specifications for crossings, the approximate width of KJ is known, which is assumed as ��, and the width of K’J’ equals to �, its projective length in the image. Moreover, the average strip width � can be worked out based on the total width of contour line and number of strips. Therefore, the length of ML can be written as:
= ′∙′ ′ = ∙��
�� (8)
Since the actual length � of the crossing, namely, the length of line MN, is already known, and the length of line OL, the distance of the camera from the ground, can also be measured, the theoretical length of M’N’, the image projection of crossing length MN at the image center can also be worked out by combing the above equations:
′ ′= ’∙ ∙ =��
��∙
�∙� (9)
Then the theoretical length of vertical distance N’O’ from the crossing upper brim on the image plane to the principal point is:
′ ′ = ∙� (10)
The ratio of the width to the location of the crossing in the image can be deduced as
= ′ ′′ ′=��
��∙
� (11)
Based on the perspective model of image plane perpendicular to the ground, the section has deduced the equation of R, the ratio of projective length M’N’ to location N’O’ of a crossing in the image. After a suspect crossing is recognized, the theoretical ratio of its projective length to its location in the image can be worked out by equation R; if the detection result is beyond the scope, then the suspect crossing can be regarded as a false one and therefore eliminated.
3. DEFILEMENT AND IMPAIRMENT ANALYSIS Since crossings are painted in the middle of a road, continuous vehicle rolling and exposure to outdoor circumstance may lead to flakey paint, gradual defilement or impairment, blurring and reduction of clarity and visibility, which increases discomfort and disadvantage to road crossing and the street conditions. Moreover, with the variety of the traffic and environment, crossings on different roads within the same region may be impaired in different ways, which makes it difficult for traffic administration to make economical and efficient repair and maintenance to crossings. To achieve an automatic monitoring
over crossings, we put forward an ANN based analysis method for the impairment condition of crossings. The method adopted in the previous section aims to automatically detect the area where a crossing locates from images, and extract relevant features from the area. With ANN model, these features can be analyzed so as to properly classify the defilement and impairment of the crossing in that area.
As long as photo captured direction is perpendicular to the crossing direction, the algorithm for crossing detection described in previous section can be applied to various images from different data sources. However, the analysis method for the impairment requires that respective ANN model should be trained according to images from different date sources. All data for experimental purpose adopted in this section to describe the analysis method for defilement and impairment come from visible light CCD images collected from vehicle-based MMS.
3.1 Mapping of detection intensity histogram based on recognition results
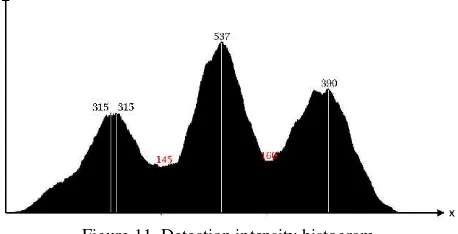
The algorithm for automatic crossing detection adopted in Section 2 may produce various detection results centering on crossing areas (as shown with the blue rectangle area in Figure 3). Based on different abscissas of these rectangular detection, the pixels contained by every detection result are accumulated to obtain N(i) the number of pixel with abscissa of i being recognized as a crossing. Then serial number of the pixel is set as the value of histogram abscissa, and the value of N(i) as the value of histogram ordinate, with which a detection intensity histogram is mapped. It can be understood on a macroscopic level as: the lateral axis of intensity histogram represents abscissa values, and the vertical axis of intensity histogram the number of the pixel recognized as a crossing, namely, the sum number of every pixel with an abscissa of i being contained by rectangular detection.
Figure 11. Detection intensity histogram
Calculation equations are as follows:
= ∑ ∑� , ,
� =
�
�= (12)
, , = { , = ≤ �, ≤ ≤ , ≤ ≤ , ℎ
= , = + (13)
= , = ℎ +
N(i) represents the value of vertical axis when abscissa equals i
in the histogram; � represents the number of rectangular detection; RecNO is the index number of rectangular detection. and are the height of rectangular detection with serial number RecNO and y coordinate values of left top angular point respectively; W and H are the width and height of the image respectively. The detection intensity histogram is mapped in Figure 11.
3.2 Extracting crossing features for training based on histogram
Features extracted from histogram generally include , total number of pixel (the sum total of every abscissas being recognized as a crossing), peak value, valid date width � valid date height �, Ratio R of total area of detection results within valid area to valid area , and support vector used in ANN model training.
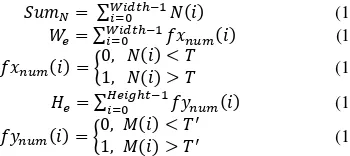
For example, for a pixel with image width as Width and AOI height as Height, N(i) (i ∈ (0, Width - 1)) represents the ordinate value when abscissa is i in histogram projected in x-direction, and M(i) (i ∈(0, Height - 1)) represents the abscissa value when ordinate is i in histogram projected in y-direction. Therefore the sum of pixels , valid data width�, and valid date height
� are expressed in the following equations:
= ∑�� ℎ−
�= (14)
� = ∑�� ℎ− �= (15)
= { , , <> (16)
� = ∑� � ℎ −�= (17)
= { ,, <> ′′ (18)
where and ′ are noise thresholds, which are usually set as small constants. And valid area , total area of detection results , and their ratio are expressed as: = � × � (19)
= ∑� �= (20)
=� �� � �� (21)
where represents the number i detection result and the area of overlapping parts in valid detection area, and Recnum
represents the number of detection result area.
The above feature vector calculation is then conducted to every AOI. Calculation results are put into support vector machine for training, and a mature ANN model for impairment analysis will be obtained.
3.3 Automatic selection of appropriate images for defile-ment and impairdefile-ment analysis
Images used for defilement and impairment analysis must meet two requirements: there exists a crossing area in the image, and there should be no interruption from any vehicle or pedestrian in the crossing area. Moreover, it is recommended to select for analysis images taken 2-4m away from a crossing and ones which reveal rather big and clear strips as much as possible. In order to automatically select target images which meet the above requirements, vehicles and pedestrians automatic detection methods must be combined to process sequence image.
After crossing AOIs have been recognized by crossing classifier, HOG based pedestrian detection (Dalal, 2005) and Haar-like vehicle detection (Ponsa, 2005 and Kim, 2012) have to be conducted to AOIs. In terms of the detection result of the number
j AOI, if pedestrians or vehicles are detected, then mark U(j) as 0; otherwise as 1, with the valid height � of the AOI on image y axis as W(j). Since AOI with interruptions are excluded defilement and impairment analysis, multiply U(j) by W(j) will produce a valid height line chart of non-interrupted AOI.
The abscissas in the following charts are serial numbers of consecutive sequence image; the ordinate in Chart 12(a) is W(j), namely, the side length of AOI; the ordinate in Chart 12(b) is U(j), and the ordinate in Chart 12(c) is the value of W j •U j. The progressive increase and then sharp decrease of the ordinate in Chart 12(a) lie in that, in sequence image, the width of a crossing in images progressive increases as it becomes closer, and sharply decreases until it disappears.
(a) (b)
(c)
Figure 12. Broken line graph of side length and interruption of AOI in sequence images
According to the peak value of function W j •U j, and with the given minimum threshold of , the system will automati-cally select images appropriate for impairment analysis.
4. EXPERIMENT AND ANALYSIS
The training of feature based crossing classifier is a one-off act; once trained, the classifier can be applied to detect any targets similar to training samples. The algorithm for target detection is achieved by Visual C ++ programming through Machine learning library of OpenCV. And SVM ANN model is achieved by Visual C ++ programming through LibSVM developed by (Lin, 2014) in Taiwan. The test platform is a personal computer with a CPU of Inter Core2 Quad 2.33GHz, 2G memory, and Windows 7 system. It took 2 days to finish the training process. After the classifier has been trained, it took about 0.3s to test and analyze every image with a pixel of 1600*1200.
4.1 Robustness test of detection method
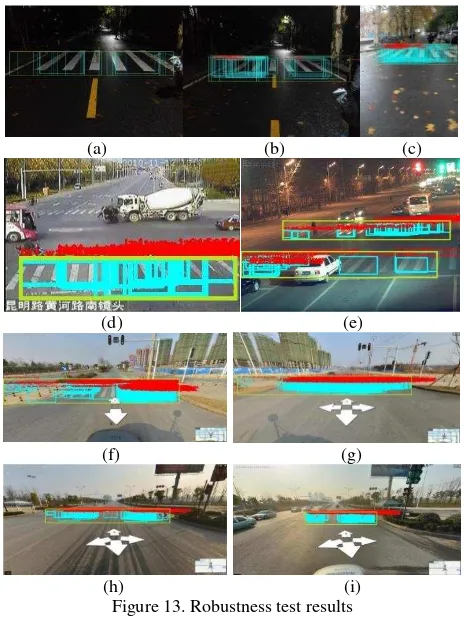
In order to test the reliability of the automatic crossing detection method in extracting targets from different sources of images, robustness experiment are conducted with panoramic images, traffic surveillance videos, and mobile phone images of different cities, under all weathers, with different resolutions and light conditions, either shaky or stable, shot or downloaded from the internet. Nine representative images were selected from test results in Figure 13, with aqua rectangular detection as initial detection result and big lime-green rectangular detection as crossing AOIs.
In Figure 13, image (a), (b), and (c) were taken in Wuhan University with a Hongmi Note mobile phone with the pixel of 3120*4108. Figure 13(a) and 13(b) were taken on a winter night after rain only with street light illumination, while Figure 13(c) was taken during rapid movement with obvious blurring in the image. Figure 13(d) and 13(e) were traffic surveillance video images randomly downloaded from the internet, among which Figure 13(d) is only of 300*179, and Figure 13(e) was taken at night with an obvious angle between the shooting direction and
road direction as well as vehicles and pedestrians interruption. Figure 13(f), 13(g), 13(h) and 13(i) were screen shot from a street image taken by a panorama camera posted on Tencent street view website, with a pixel of about 1600*700 and considerable shapelessness; the crossing strip in aqua rectangular detection on top left corner of Figure 13(g) was rather deformed; the crossing in Figure 13(f) was segregated by a safety island; Figure 13(h) was taken after a sprinkler sprinkled water on the road with a mottled road surface and seriously flaky paint; Figure 13(i) was taken against the light with road surface reflecting light.
(a) (b) (c)
(d) (e)
(f) (g)
(h) (i) Figure 13. Robustness test results
Test results with the above images reveal that, the algorithm in this study only failed to detect the distant crossing in Figure 13(d), probably because of the large angle between the crossing direction and shooting direction, as well as poor image reso-lution. However, the algorithm, in general, demonstrated a rather good robustness when dealing with images under different light conditions, of certain angle and different resolutions, with defile-ment, impairdefile-ment, interruption, camera vibration and blurry shape, as well as sensor images.
4.2 Defilement and impairment analysis
The system is able to automatically detect crossing area from sequence images, and analyze flaky paint, defilement and impairment of crossing. The statues of crossings are separated into three classes: seriously impairment, partially impairment, and clear which printed on figures in red, yellow and green respectively. The blue scripts mean that the crossings are too close or too far to analyze. The intensity histograms of each crossing are also printed on figures with red lines.
Figure 14 shows the analysis results of pedestrian crossings. Figure 14(b) and Figure 14(d) contain two crossings so two detection intensity histograms are printed above the image where the upper one represents the further crossing. The further one will be ignored and marked as too far to detect with blue script
because of the bad imaging and loss of detail. Applied the proposed analysis method, impairment analysis can be conducted correctly and automatically.
(a) Seriously impairment (b) Clear
(c) Seriously impairment (d) Partially impairment Figure 14. Defilement and impairment analysis results
4.3 Algorithm performance analysis
To evaluate various indices of the proposed algorithm, we have conducted tests with 56620 sequence images from vehicle-based MMS taken in the urban area of Wuhan. Those images, with the pixel of 1600*1200, were taken by a single-CCD camera mounted on the top of a vehicle, with an exposure interval of 0.5s. The test area stretches for 127 km, covering 610 crossings, among which 243 were seriously impaired.
The time-consuming of the classifier training varies considerably depending on the classifier class and the rigor of the training end condition, which takes about 80 hours when hierarchical learning classifier of level 17 is used. And the detection of the crossing takes about 9 hours. According to equations (1) and (2), the Recall of the detection is 93.4%, and Precision is 91.1%.
Based on the detection result, 322 non-interrupted crossings were automatically selected from 1845 AOIs to conduct impairment analysis. With visual interpretation, 146 out of 322 were seriously impaired, 85 were partially impaired and 87 were clear strips; while with the automatic analysis results, the figures were 144, 98 and 81 respectively. But among the 144 crossings detected as seriously impaired by the proposed algorithm, 4 crossings are false detection without crossing and 7 are partially impaired. Among the 81 crossings detected as clear, 13 are actually partially impaired. The false detection is partly caused by the failure of the detection algorithm, and partly by the subjective uncertainty to separate the serious impairment and slight impairment.
tp fp fn tn Recall Prec.
Seriously im. 133 11 13 165 91.1% 92.4% Partially im. 78 20 7 217 91.8% 79.6% clear 68 13 19 222 78.2% 84.0% Table 1. Recall and Precision of the impairment analysis for three status, seriously impaired, partially impaired and clear
Intermediate results of the impairment analysis are listed in Table 1. The statistic shows that the algorithm guaranteed that the more serious impairment status be recognized with high Recall and high Precision.
Compared to the crossing detection which uses all the 56220 images, the impairment analysis uses only 322 images so that it only takes 4.8s. The detection progress wastes most of the time on the detection in the non-AOIs, which can be improved by strategies of course selection of AOI in the future.
5. CONCLUSION
The automatic crossing detection for defilement and impairment developed in this paper proves to be able to automatically detect crossing area from sequence image, and analyze flaky paint, defilement and impairment of crossing. The approach consists of crossing detection and defilement and impairment analysis. The detection algorithm demonstrates robustness, high Recall, and Precision. It is rather automatic, without the need of users’ interference, and is applicable to images taken by various sensors along road direction. The algorithm for impairment analysis requires data from the fixed camera, with rapid analysis and great potential for further development. Test data for defilement and impairment analysis comes from mobile photogrammetry equip-ment, the advantage of which lies in its rapidness, convenience, and inexpensiveness in obtaining massive images. With the assistance of vehicle-based Mobile Mapping System, the proposed algorithm of automatic crossing detection and the analysis of defilement and impairment can contribute to the 3D street scene reconstruction, so as to the timely maintenance of the impaired traffic facilities.
ACKNOWLEDGEMENTS
This work was supported in part by the National Natural Science Foundation of China with project number 41571434 and 41322010. We are very grateful also for the comments and contributions of the anonymous reviewers and members of the editorial team.
REFERENCES
Boudet, L. and Midenet, S., 2009. Pedestrian crossing detection based on evidential fusion of video-sensors. Transportation re-search part C: emerging technologies 17(5), pp. 484-497.
Dalal, N. and Triggs, B., 2005. Histograms of oriented gradients for human detection. In: Computer Vision and Pattern Recogni-tion, 2005. CVPR 2005. IEEE Computer Society Conference on, Vol. 1, IEEE, pp. 886-893.
Haralick, R. M., 1989. Monocular vision using inverse perspec-tive projection geometry: analytic relations. In: Computer Vision and Pattern Recognition, 1989. Proceedings CVPR'89., IEEE Computer Society Conference on, IEEE, pp. 370-378.
Haussler, D., 1992. Overview of the probably approximately correct (pac) learning framework. Information and Computation
100(1), pp.78-150.
Kim, S., Park, S., Lee, S., et al., 2012. Design of high-performance pedestrian and vehicle detection circuit using Haar-like features. In: TENCON 2012-2012 IEEE Region 10 Conference, IEEE, pp. 1-5.
Kuchment, A., 2013. Probably Approximately Correct: Nature's Algorithms for Learning and Prospering in a Complex World.
Scientific American, Incorporated, pp. 88.
Lienhart, R. and Maydt, J., 2002. An extended set of Haar-like features for rapid object detection. In: Image Processing. 2002.
Proceedings. 2012 International Conference on, Vol. 1, IEEE, pp. I-I.
Lin, C., 2014. http://www.csie.ntu.edu.tw/~cjlin/index.html.
Ma,G., Yao, J. and Yang, X., 2009. Prediction of the Position of Pedestrian Crossing Road Section Based on Kalman Predictor. In: Measuring Technology and Mechatronics Automation, 2009.
International Conference on, Vol. 3, IEEE, pp. 541-544.
Ponsa, D., López, A., Lumbreras, F., et al., 2005. 3D vehicle sensor based on monocular vision. In: Intelligent Transportation Systems, 2005. Proceedings, 2005 IEEE, IEEE, pp. 1096-1101.
Se, S, 2000. Zebra-crossing detection for the partially sighted. In: Computer Vision and Pattern Recognition, 2000. Proceed-ings. IEEE Conference on, vol. 2, IEEE, pp. 211-217.
Shioyama, T. and Uddin, M. S., 2004. Detection of pedestrian crossings with projective invariants from image data. Measure-ment Science and Technology 15(12), pp. 2400-2405.
Sichelschmidt, S., Haselhoff, A., Kummert, A., et al., 2010. Pedestrian crossing detecting as a part of an urban pedestrian safety system. In: Intelligent Vehicles Symposium (Ⅳ), 2010 IEEE, IEEE, pp. 840-844.
Soheilian, B., Paparoditis, N. and Boldo, D., 2010. 3d road mark-ing reconstruction from street-level calibrated stereo pairs.
ISPRS Journal of Photogrammetry and Remote Sensing 65(4), pp. 347-359.
Uddin, M. S. and Shioyama, T., 2004. Measurement of the length of pedestrian crossings-a navigational aid for blind people. In:
Intelligent transportation systems, 2004. Proceedings. The 7th International IEEE Conference on, IEEE, pp. 690-695.
Uddin, M. S. and Shioyama, T., 2005a. Bipolarity and projective invariant-based zebra-crossing detection for the visually im-paired. In: Computer Vision and Pattern Recognition-Workshops, 2005. CVPR Workshops. IEEE Computer Society Conference on, IEEE, pp. 22-22.
Uddin, M. S. and Shioyama, T., 2005b. Detection of pedestrian crossing and measurement of crossing length-an image-based navigational aid for blind people. In: Intelligent Transportation Systems, 2005.Proceedings. 2005 IEEE, IEEE, pp. 331-336.
Uddin, M. S. and Shioyama, T., 2005c. Detection of pedestrian crossing using bipolarity feature-an image-based technique.
IEEE Transactions on Intelligent transportation systems 6(4), pp. 439-445.
Uddin, M. S. and Shioyama, T., 2005d. Robust zebra-crossing detection using bipolarity and projective invariant. In: ISSPA, pp. 571-574.
Valiant, L., 1984. A theory of the learnable. Communications of the ACM 27(11), pp. 1134-1142.
Viola, P. and Jones, M., 2001. Rapid object detection using a boosted cascade of simple features. In: Computer Vision and Pattern Recognition, 2001. CVPR 2001. Proceedings of the 2001 IEEE Computer Society Conference on, Vol. 1, IEEE, pp. I-I.
Zhang, Y., Li, Q., Lu, H., et al, 2015. Optimized 3D Street Scene Reconstruction from Driving Recorder Images. Remote Sensing, 7(7), pp. 9091-9121.