A STUDY OF UNSUPERVISED CHANGE DETECTION BASED ON TEST STATISTIC
AND GAUSSIAN MIXTURE MODEL USING POLSAR SAR DATA
Yang Yuxina, Liu Wensongb*
a Middle School Affiliated to Central China Normal University , 430079 Wuhan, China- [email protected] b The State Key Laboratory of Information Engineering in Surveying, Mapping and Remote Sensing, Wuhan University, 430079
Wuhan, China- [email protected]
Commission III, WG III/6
KEY WORDS: PolSAR, change detection, test statistic, GMM, flood disaster in Wuhan city
ABSTRACT:
To solve the problems of existing method of change detection using fully polarimetric SAR which not takes full advantage of polarimetric information and the result of false alarm rate of which is high, a method is proposed based on test statistic and Gaussian mixture model in this paper. In the case of the flood disaster in Wuhan city in 2016, difference image is obtained by the likelihood-ratio parameter which is built using coherency matrix C3 or covariance matrix T3 of fully polarimetric SAR based on test statistic, and it becomes a reality that the change information is automatic extracted by the parameter of Gaussian mixture model (GMM) of difference image based on the expectation maximization (EM) iterative algorithm. The experimental results show that the overall accuracy of change detection results can be improved and false alarm rate can be reduced using this method by comparison with traditional constant false alarm rate (CFAR) method. Thus the validity and feasibility of the method is demonstrated.
* Corresponding author:[email protected] 1. INTRODUCTION
Accurate and timely change detection of Earth’s surface features
is extremely important for understanding relationships and interactions between people and natural phenomena. It has been widely recognized in the scientific community as a key element in a variety of applications, such as environmental impact assessment (Almeida, 2007; Chavez, 1994; Engeset,2002), ecological monitoring (Cihlar, 1992; Zhu, 2006), global change monitoring (Bruzzone , 1997), state and local planning (Hame , 1998; Lu, Sader , 2001), and regulatory policy development (Ridd, 1998; Zhang, 2001). Due to its all-weather mapping capability independently of, for instance, cloud cover, change detection of polarimetric synthetic aperture radar (PolSAR) plays an important role in many application domains (Grover, 1999; Rignot, 1993; Stramondo, 2006). Meanwhile, unsupervised change detection techniques do not need to explicitly identify the types of land cover or land use transitions that have taken place in the region of concern (Qiu, 2003). Hence, these techniques are suitable for many applications.
However, existing method of unsupervised change detection using fully polarimetric SAR which not takes full advantage of polarimetric information and the result of false alarm rate of which is high (Bovolo, 2006). To solve the problems of existing method of change detection using fully polarimetric SAR which not takes full advantage of polarimetric information and the result of false alarm rate of which is high, a method is proposed based on test statistic and Gaussian mixture model in this paper.
In section 2, the proposed change-detection methodology is derived, and the method of similarity measure and Gaussian mixture model are introduced. Section 3 reports the results of
the proposed approach on the multi-temporal SAR data over WuHan. Finally, conclusions are drawn in section 4.
2. METHODOLOGY
Let us consider two full PolSAR images both follow a complex
Wishart distribution (Gong, 2014),
i.e.XW q n( , ,x)Y W q m ( , ,y)
If m=n, Eq.(1) is changed as below.
(2 2 )
InQn qIn In X In Y In XY (4)
where lnQ describes the similarity of corresponding features and its range is (-∞,0], the more lnQ close to 0, the more similar of the corresponding features, which means less likely it is to change and vice versa. Hence, similarity parameter lnQ criticizes the similarity of two covariance matrixes and judges
that change happens or not (Seto, 2003). We selected
Meanwhile, The data distribution P(xd) of feature vectors can be modeled as a weighted sum of two distributions representing the
‘‘changed’’ class and ‘‘unchanged’’ class data distributions
(Celik , 2011), i.e.,
p n is the nth component density modeled with Gaussian density function.
The data distribution modeled with Eq. (7) can be separated into two distributions representing the data distributions of
‘‘changed’’ and ‘‘unchanged’’ classes. Each pixel at the
The optimum combination with index m0 is obtained by finding an intermediate change detection mask CM m0 for which the
It is worth to note that the EM-based algorithm (Sader, 2001) is a special case of GMM algorithm when feature vector for each pixel is constructed with no contextual information, i.e. w = 1,
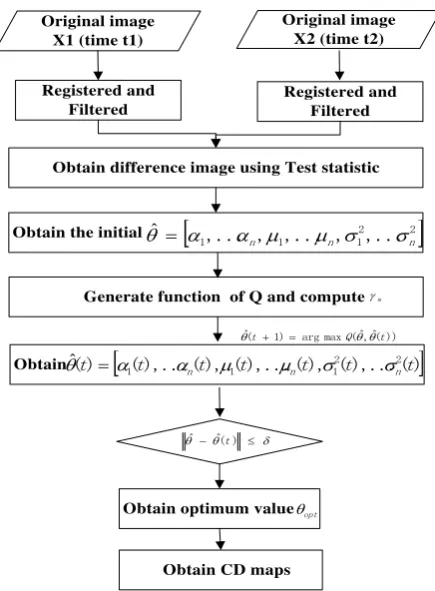
and two components (N = 2) are used for GMM representation (Lu, 2005). Figure 1 shows the study procedure of the Gaussian mixture model.
Obtain difference image using Test statistic
Obtain the initial
2 2
Obtain optimum value opt
Obtain CD maps
Figure 1. The procedure of this study
The basic processing flow of the proposed method (Figure 1) consists of data preprocessing, likelihood-ratio parameter construction, change information automatic extraction with Gaussian mixture model algorithm and precision evaluation. First, speckle noise is removed by Refined_Lee filtering for the two registered fully polarimetric SAR images. As the coherency matrix C3 or covariance matrix T3 of fully polarimetric SAR data follows a complex Wishart distribution. The likelihood-ratio parameter is built by a test statistic based on Wishart distribution to represent change features and the difference image also is obtained. Then the data distribution of the difference image computed from satellite images of the same scene acquired at different time instances is modeled by using the expectation maximization (EM) iterative algorithm and Gaussian mixture model algorithm and it also becomes a reality that the change information is automatic extracted. Finally, the precision of change detection result is evaluated.
3. RESULT AND ANALYSES 3.1 Description of the image datasets
(a) The Pauil-RGB images of June 25, 2015
(b) The Pauil-RGB images of July 6, 2016 Figure 2. The Pauil-RGB images of datasets used in experiments: (a) Radarsat-2 SAR image acquired on June
25, 2015; (b) Radarsat-2 SAR image acquired on July 6, 2016.
The two red boxes labeled regions are used to give a detailed assessment in Figure 2 (b). All those regions have a common characteristic that are regions of water. Region 1 is YanDong Lake (Figure 3), and region 2 is LiangZi Lake (Figure 4).
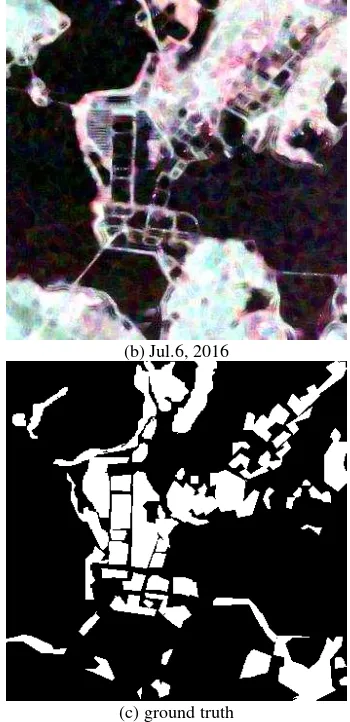
(a) June 25, 2015
(b) Jul.6, 2016
(c) ground truth
Figure 3. The Pauil-RGB images of YanDong Lake on (a) Jun.25, 2015; (b) Jul.6, 2016; (c) ground truth
The bi-temporal PolSAR images shown in Figure 3 (a) (b) were acquired on Jun.25, 2015, and Jul.6, 2016, respectively. The image size is 400*400 pixels. The detailed assessments of area is located in YanDong Lake of Wuhan include some grassland, city and water bodies. The main changes occurred in the water area, because of continuing rain.
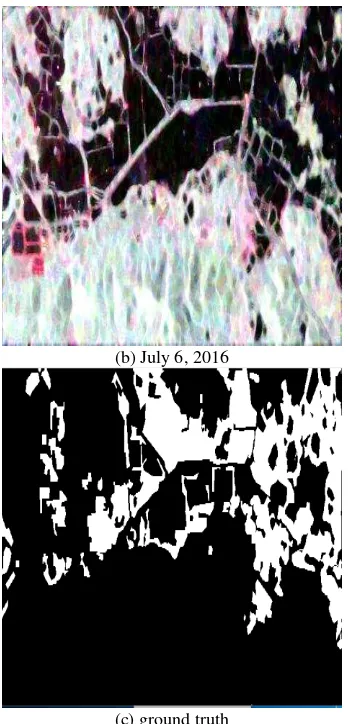
(b) July 6, 2016
(c) ground truth
Figure 4. The Pauil-RGB images of Liangzi Lake on (a) Jun.25, 2015; (b) Jul.6, 2016; (c) ground truth
The bi-temporal PolSAR images shown in Figure 4 (a) (b) were acquired on Jun.25, 2015, and Jul.6, 2016, respectively. The image size is 300*500 pixels. The detailed assessments of area is located in LiangZi Lake of Wuhan include some grassland, city and water bodies. The main changes occurred in the water area, because of continuing rain.
3.2 Implementation of change detection algorithms Change detection algorithms which are based on statistical data modeling are utilized to test the performance of GMM algorithm and EM-based algorithm (Ridd, 1998).In the implementation of test statistic and GMM algorithm, the initial estimate of the number of components (N) for the GMM is set as N = 10 which is automatically adjusted by annihilating components that are not supported by the data. Furthermore, in order to make fair comparisons with EM-based algorithm, the parameter w = 1 is used to consider only single pixel information. However, the effect of parameter w on GMM algorithm is separately investigated.
3.3 Experiments and Results
The intersection of the two Gaussian distributions representing
‘‘changed’’ and ‘‘unchanged’’ class data distributions separates
the difference image data into two clusters. The intersection point determines a threshold value that segments the difference
image data into two regions representing ‘‘changed’’ and ‘‘unchanged’’ classes. As shown in Fig. 3, GMM algorithm
performs better in fitting model to difference image data and in
estimating data distributions of ‘‘changed’’ and ‘‘unchanged’’
classes than constant false alarm rate(CFAR) algorithm.
Because of better data modeling, it can separate ‘‘changed’’ and ‘‘unchanged’’ classes more efficiently.
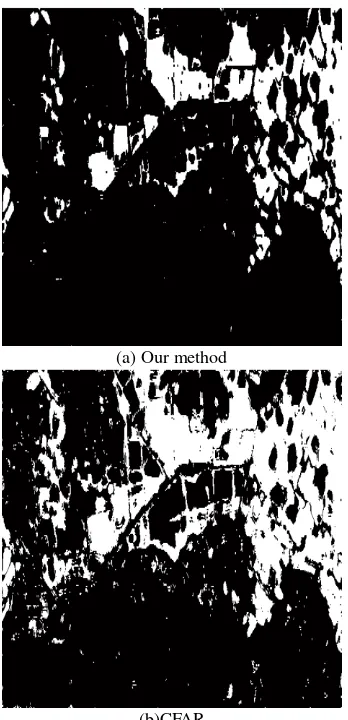
(a) Our method
(b) CFAR
Figure 5. Change detection results of Our method on SAR image dataset with different regions
Method Overall
Accuracy
False Alarm Rate
CFAR 89.02% 6.29%
Our method 91.84% 2.03%
(a)Our method
(b)CFAR
Figure 6.Change detection results ofOur method on SAR image dataset with different regions
Method Overall
Accuracy
False Alarm Rate
CFAR 88.61% 8.56%
Our method 92.24% 1.13%
Table 2. Performance Evaluation of change detection Over LiangZi Lake
The experimental results (as shown in Figure 5, Table 1 and Figure 6, Table 2) show that the overall accuracy of change detection results can be improved and false alarm rate can be reduced using this method by comparison with some traditional methods, such as constant false alarm rate (CFAR) method.
4. CONCLUSIONS
Unsupervised change detection based on test statistic and Gaussian mixture model algorithm for multi-temporal PolSAR images is proposed. As GMM algorithm can also adequately handle different types of spatial sampling. The data distribution of the difference image computed from satellite images of the same scene acquired at different time instances is modeled by using GMM algorithm. Consequently, the results show clearly that the test statistic and Gaussian mixture model improved change detection capability for fully polarimetric SAR data. Furthermore, the increase in the initial value of the number of mixture components N will also increase the computational complexity of GMM algorithm.
ACKNOWLEDGEMENTS
The authors would like to thanks the National Natural Science Foundation of China, No. 91438203, No. 61371199, No. 41501382, No.41601355; Public Welfare Project of Surveying and Mapping Interest (201412002); Hubei Provincial Natural Science Foundation (No. 2015CFB328, No.2016CFB246); National Basic Technology Program of Surveying and Mapping (No. 2016KJ0103); Technology of target recognition based on GF-3(No. 03-Y20A10-9001-15/16).
REFERENCES
Almeida R., 2007. Detecting deforestation with multitemporal L
‐band SAR imagery: A case study in western Brazilian Amazonia. International Journal of Remote Sensing, 28(6), pp. 1383-1390.
Bovolo F., 2006. A Novel Theoretical Framework for Unsupervised Change Detection Based on CVA in Polar Domain //Geoscience and Remote Sensing Symposium, IGARSS 2006. IEEE International Conference on. IEEE, pp.379-382.
Bruzzone L., 1997. An iterative technique for the detection of land-cover transitions in multitemporal remote-sensing images.
IEEE Transactions on Geoscience and Remote Sensing, 35(4), pp. 858-867.
Celik T., 2011. Multitemporal image change detection using undecimated discrete wavelet transform and active contours.
IEEE Transactions on Geoscience and Remote Sensing, 49(2), pp.706-716.
Chavez S., 1994. Automatic detection of vegetation changes in the southwestern United States using remotely sensed images.
Photogrammetric engineering and remote sensing, 60(5), pp. 147-156.
Cihlar J., 1992. Change detection with synthetic aperture radar.
International Journal of Remote Sensing, 13(3), pp. 401-414.
Engeset V., 2002. Change detection and monitoring of glacier mass balance and facies using ERS SAR winter images over Svalbard. International Journal of Remote Sensing, 23(10), pp. 2023-2050.
Goodman R., 1963. Statistical analysis based on a certain multivariate complex Gaussian distribution (an introduction).
The Annals of mathematical statistics, 34(1), pp. 152-177.
Gong M., 2014. Fuzzy clustering with a modified MRF energy function for change detection in synthetic aperture radar images.
IEEE Transactions on Fuzzy Systems, 22(1), pp. 98-109.
Grover K., 1999. Quantitative estimation of tropical forest cover by SAR. IEEE Transactions on Geoscience and Remote Sensing, 37(1), pp. 479-490.
Hame T., 1998. An unsupervised change detection and recognition system for forestry. International journal of remote sensing, 19(6), pp. 1079-1099.
study. International Journal of Remote Sensing, 26(1), pp. 101-114.
Qiu B., 2003. Multi-block PCA method for image change detection//Image Analysis and Processing, Proceedings. pp. 385-390.
Ridd K., 1998.A comparison of four algorithms for change detection in an urban environment. Remote sensing of environment, 63(2), pp. 95-100.
Rignot E., 1993. Change detection techniques for ERS-1 SAR data. IEEE Transactions on Geoscience and Remote sensing, 31(4), pp. 896-906.
Sader A., 2001. Forest change monitoring of a remote biosphere reserve. International Journal of Remote Sensing, 22(10), pp. 1937-1950.
Seto K., 2003. Comparing ARTMAP neural network with the maximum-likelihood classifier for detecting urban change.
Photogrammetric Engineering & Remote Sensing, 69(9), pp. 981-990.
Stramondo S., 2006. Satellite radar and optical remote sensing for earthquake damage detection: results from different case studies. International Journal of Remote Sensing, 27(20), pp. 4433-4447.
Zhao J., 2016. An Unsupervised Change Detection Based on Test Statistic and KI from Multi-Temporal and Full Polarimetric SAR Images. ISPRS-International Archives of the Photogrammetry, Remote Sensing and Spatial Information Sciences, pp.611-615.
Zhang Q., 2002. Urban built-up land change detection with road density and spectral information from multi-temporal Landsat TM data. International Journal of Remote Sensing, 23(15), pp. 3057-3078.
Zhang Y., 2001. Detection of urban housing development by fusing multisensor satellite data and performing spatial feature post-classification. International Journal of Remote Sensing, 22(17), pp. 3339-3355.
Zhu L., 2006. Fusion of multisensor multitemporal satellite data for land cover mapping. International Journal of Remote Sensing, 27(05), pp. 903-918.