The in
fl
uence of catchment morphology, lithology and land use on soil
organic carbon export in a Mediterranean mountain region
Elisabet Nadeu
a,⁎
, Juan M. Quiñonero-Rubio
b, Joris de Vente
a, Carolina Boix-Fayos
aaSoil and Water Conservation Department, Centro de Edafología y Biología Aplicada del Segura (CEBAS-CSIC), Campus Universitario de Espinardo, 30100 Murcia, Spain bDepartamento de Geografía, Universidad de Murcia, Campus de la Merced, 30001 Murcia, Spain
a b s t r a c t
a r t i c l e
i n f o
Article history:
Received 5 December 2013
Received in revised form 6 November 2014 Accepted 11 November 2014
Available online xxxx
Keywords:
Soil organic carbon Soil erosion Enrichment ratio Land use Geomorphology Topography
Soil erosion processes play an important role in the redistribution of soil organic carbon over the landscape. The factors controlling this carbon (C) redistribution have been thoroughly studied at the plot scale, but knowledge at the landscape level is still limited. In this study, we explore the role of different factors on C export at the ment scale. We measured the C concentration in sediment deposited behind check-dams at the outlet of catch-ments ranging between 7 ha and 438 ha and combined it with specific sediment yield rates (SSY, Mg ha−1y−1) to estimate catchment specific C yields (SCY, g m−2y−1). Correlation analysis between C concentration, SCY and morphological, lithological and land use data derived from GIS analysis and interpretation of ortophotoimages was conducted. The results showed a close relationship between SCY rates and catchment morphometric prop-erties such as catchment area, slope gradient and lithology, while C concentration in sediments was correlated to the percentage of forest cover in a catchment. In addition, it is suggested that morphological properties such as average slope gradient, drainage area and drainage density could have implications for the fate and stability of C stored at depositional sites through changes in the in-depth variability of C concentration in sediments and in the concentration of two measured C fractions. Further research is needed in this direction.
© 2014 Elsevier B.V. All rights reserved.
1. Introduction
Soil organic carbon redistribution by soil erosion processes and its transport into the aquatic system can play a significant role in the bio-geochemical cycling of carbon (C) (Battin et al., 2009; Berhe et al., 2007; Quinton et al., 2010; Stallard, 1998). Recent estimates of organic C loads transported and buried with sediments in large rivers have stressed the importance of catchment-derived Cfluxes in total C bud-gets (Ran et al., 2014; Aufdenkampe et al., 2011). However, since only a very small percentage of eroded C is exported from catchments (Chaplot et al., 2005; Smith et al., 2005), the re-mobilization (continu-ous detachment and deposition) of eroded C (Rumpel et al., 2014) and the environmental conditions (e.g. temperature, humidity) during transport and deposition within catchment boundaries will have a strong impact on its fate (Gregorich et al., 1998).
Understanding changes in the fate of eroded soil organic carbon dur-ing the erosion process demands for increased knowledge on the factors involved along its different phases of detachment, transport and deposi-tion. Over the last decades, several studies have shown how C export from soils and its concentration in sediments depend on a number of factors, including: rainfall characteristics, soil texture, slope gradient
and length, geomorphological factors or land use and management (e.g.Owens et al., 2002; Polyakov and Lal, 2004; Schiettecatte et al., 2008). Nevertheless, most of these studies have been plot-based, con-sidering the controlling factors separately and focused mainly on interill erosion, thus limiting their applicability at the catchment scale where a large number of factors and erosion processes interact.
More recently, and fulfilling the need of broader scale studies and quantification of catchment scale C budgets, a shift from plot to full slope or catchment scale approaches has been observed. These new studies identified topography, and consequently geomorphic pro-cesses (e.g.Chaplot et al., 2010; Guo et al., 2010; Hoffmann et al., 2014; Yoo et al., 2006) as well as differences in the stability of SOC between landform positions (Berhe et al., 2008; Chaplot and Poesen, 2012; Doetterl et al., 2012; Hancock et al., 2010) as impor-tant variables to explain soil organic carbon (SOC) spatial distribu-tion. In addition, it has also been reported how changes in land cover can modify the amount of C exported by erosion by changing SOC stocks at source sites by changing potential runoff rates (Chaplot et al., 2009; Molina et al., 2007; Sitaula et al., 2004; Thothong et al., 2011). Despite an increase in the number of landscape scale studies, many aspects of how transport and selectivity during the redistribution of SOC may affect carbon dynamics are unknown (Kirkels et al., 2014) and it is still difficult tofind studies that integrate and assess the effect of multiple factors potentially controlling C redistribution at the land-scape level.
⁎ Corresponding author at: Earth and Life Institute—TECLIM, Université catholique de Louvain, 1348 Louvain-la-Neuve, Belgium. Tel.: +32 10472455.
E-mail address:[email protected](E. Nadeu).
http://dx.doi.org/10.1016/j.catena.2014.11.006 0341-8162/© 2014 Elsevier B.V. All rights reserved.
Contents lists available atScienceDirect
Catena
port of particulate (non-dissolved) C particles has been described to closely follow sediment dynamics (Starr et al., 2000). Therefore, like sediment, C redistribution can be expected to be influenced by lithology (Bellin et al., 2011; Romero-Diaz et al., 2007), land use type and pattern (Fiener et al., 2011; Van Rompaey et al., 2002), topography ( Romero-Diaz et al., 2007), and sediment connectivity (Sougnez et al., 2011). In addition, the immediate fate of transported C, whether deposited close to the source soil or exported to the aquatic system, will depend on the size and stability of the transported aggregates (Starr et al., 2000). Notwithstanding, organic particles may also behave differently than mineral particles due to their inherent characteristics (Walling, 1983), being affected by additional processes that can alter the C concentration and characteristics in sediments. For instance, the loss of C through min-eralization during transport or after deposition (Lal, 2003), the propor-tion of fracpropor-tions of C with different turnover rates and its transformapropor-tion along the landscape (Berhe and Kleber, 2013; Rumpel et al., 2014), changes physical and chemical protection mechanisms of eroded parti-cles (Berhe et al., 2008; Doetterl et al., 2012; Wang et al., 2014) and also the accumulation of C in deposited sediments through the input of au-tochthonous organic matter (Stallard, 1998).
The transfer of C from soils to streams and catchment boundaries is, therefore, complex and the few studies that have investigated the rela-tionships between C export and different factors at the catchment scale have mainly focused on dissolved or suspended C in agricultural catch-ments and their relationship with hydrological catchment properties (Oeurng et al., 2011). In the Mediterranean region, where high soil ero-sion rates reduce the fertility of soils with already low SOC concentra-tions (Cantón et al., 2012), very little emphasis has been placed on the study and quantification of the catchment scale transport and export of eroded C. Increased knowledge on its controlling factors could help in the development of more precise numerical models and improve catchment management to preserve soil fertility and avoid large C ex-ports into the aquatic system. Against this background, the objective of this study is to explore the relationships between a range of catch-ment properties (morphometric, soils, lithology and land use) and the C concentration in sediments and catchment scale C export by soil ero-sion processes.
2. Materials and methods
2.1. Site description
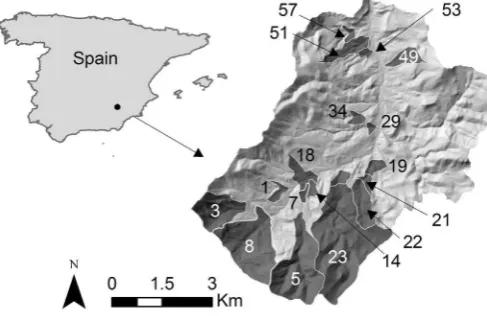
The study was conducted in a 50 km2watershed located within the
province of Murcia, SE Spain (Fig. 1). The average altitude of the study area is 1403 m and it is characterized by a dry–subhumid Mediterra-nean climate, belonging to the supramediterraMediterra-nean bioclimatic zone. Mean annual precipitation and temperature are 583 mm and 13.3 °C
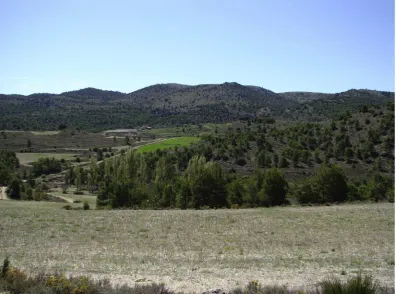
neous and consists mainly of limestone, marls and sandstone from the Mesozoic and Cenozoic (IGME, 1978). Dolomites and limestones occupy the highest elevations in the catchment, often visible in the form of small cliffs, while more marls and sandstones are found in the highly dissected valleyfloors. While dolomites and limestones are considered hard erosion resistant lithologies, marls and sandstones are unconsoli-dated erodible material (Romero-Díaz, 2003). Soils are mainly classified as Calcaric Regosols and Calcaric Lithosols, although Cambisols and Mollisols can also be found in certain slopes under forest cover (Alías et al., 1991). Vegetation consists of a mixture of conifer forests, shrub-land, pastures and dryland agriculture (Fig. 2). Rills and gullies are com-mon features on both agricultural and naturally vegetated hillslopes, while bank and channel erosion are active along the whole drainage network. To address the problems arising from on-site and off-site effects of soil erosion, the regional Government promoted hydrological correction works involving afforestation and the construction of check-dams. The impacts of afforestation, construction of check-dams and land use changes on geomorphological processes and sediment yield in the catchment have been explored in detail in previous works (Boix-Fayos et al., 2007, 2008; Nadeu et al., 2012; Quiñonero-Rubio et al., 2014). These check-dams have divided the catchment into smaller subunits (catchments), 18 of which were used in this study (Fig. 1and
Table 1) with average altitudes ranging between 1146 m and 1714 m.
2.2. Field sampling
Sediment samples were taken from the sediment wedges created behind each check-dam. Sediment deposition at these sites is often event-based (Boix-Fayos et al., 2008) and size dependent; with a large fraction offine particles reaching the front of the wedge and coarser particles mainly settling at the back (Nadeu et al., 2012). Deposition in the sediment wedges can be regarded as a mixture of suspended sediment (mostly reaching the front of the wedge) and bedload transported sediment (preferably deposited in the back) (Nadeu et al., 2012). For this study, sediments were sampled at the front of the wedge, assuming them to be representative of potentially exported sediment out of the catchment during the study period. The sediment wedges were dry at the time of sampling, and only become saturated and temporarily covered by a shallow water later after rainfall events lasting over several days, a situation which occurs very seldom throughout the year during autumn and spring. An auger was used to sample in depth in 5 cm increments until bedrock was reached with an average of 84 ± 7 cm and a maximum of 150 cm in one of the catchments. In addition to the depth profile, two sample replicates were taken in 15 cm increments. Data from total sediment volume for each sediment wedge was taken from a previous study (Boix-Fayos et al., 2008). Soil sampling was carried out on a land-use based strategy, taking samples from at least 2 locations per LULC class (seeSection 2.4) and catchment based on the 2008 land use distribution. The topsoil, 0– 10 cm, was sampled to characterize the material most likely to be mobi-lized by soil erosion processes. The sampling of soils and sediments was done during severalfield campaigns over three years: 2004, 2009 and 2010.
2.3. Soil and sediment analyses
combined wet sieving and laser diffractometry technique. Fine earth, b2 mm, of soil and sediment samples was dry-sieved at 63μm obtaining
two fractions. The two fractions,fine and coarse, were chemically dis-persed using a mixture of sodium hexametaphosphate and sodium car-bonate anhydrous for 18–24 h. Particle size was then measured on the dispersed samples through wet sieving for the sand fraction (N63μm)
and through a laser diffractometry technique for the silt and clay frac-tions (b63μm) using a Coulter LS200 (Miami, USA). Two different
tech-niques were applied to analyze organic carbon content: for samples collected until 2009 the wet oxidation method was used, for which sam-ples were preheated using a mixture of potassium dichromate and con-centrated sulphuric acid to 170 °C (30 min) to ensure a complete combustion (Yeomans and Bremner, 1988). For those samples taken
from 2010 onwards, C content was determined by dry combustion in an elemental analyzer (FLASH EA 1112 Series Thermo). Because these two techniques may lead to slightly different results, the difference be-tween the data obtained through the two methods was tested on some of the samples taken in 2010 (n = 17). The linear regression obtained (r2= 0.94) showed no signi
ficant differences between average values of sample replicates (paired t-test, pN0.05). Thus, no correction factor between methods was applied.
In addition, for 12 of the catchments, organic carbon content was measured on two size fractions which were obtained through a physical separation by wet sieving conducted after shaking for 18 h 10 g offine earth with 50 ml of sodium hexametaphosphate (Cambardella and Elliot, 1992). The two obtained fractions were defined as particulate Fig. 2.Fragmented landscape of Rogativa catchment (fallow land in front and different densities of forest cover, cerealfields and shrubland in the back).
Table 1
Main characteristics of the study catchments.
Catchment ID Dominant soils Dominant lithology Area (ha) Dominant LULC (1981)a SY (Mg y−1)b Average slope (±sd) (%)
1 Calcaric regosols Marls 17.7 Agr 32.3 16 ± 8
3 Lithosols Quaternary, limestone 118.0 Pas 77.1 40 ± 16
5 Lithosols Limestone 241.1 Pas, LF 79.4 47 ± 16
7 Calcaric regosols Marls 11.1 LF 8.8 15 ± 7
8 Lithosols, calcaric regosols Quaternary, marls, limestone 253.7 Shr, LF 95.9 34 ± 18
14 Calcaric regosols Marls 12.3 LF 43.3 21 ± 11
18 Calcaric regosols Marls 41.0 Shr 510.6 18 ± 8
19 Calcaric regosols Marls, Limestone 20.6 LF, S 51.7 24 ± 10
21 Calcaric regosols Marls 13.4 Shr 46.2 26 ± 9
22 Calcaric regosols Limestone 66.8 LF 32.3 26 ± 10
23 Lithosols, CR Limestone 437.7 LF 190.8 34 ± 16
24 Calcaric regosols Marls 17.8 Shr, LF 38.5 30 ± 12
29 Calcaric regosols Marls 7.4 LF 132.6 23 ± 7
34 Calcaric regosols Marls 15.4 LF 94.9 20 ± 7
49 Lithosols, calcaric regosols Limestone, marls 37.2 Shr, LF 121.8 32 ± 16
51 Calcaric regosols Marls 48.4 Pas 46.8 25 ± 12
53 Calcaric regosols Marls 9.7 LF 71.7 19 ± 8
57 Calcaric regosols Marls 10.7 LF 78.5 24 ± 10
(MOC) (b53μm) and their C content analyzed using the techniques
mentioned above. For these samples, total organic carbon was then as-sumed to be the sum of POC and MOC sample content.
2.4. Land use and land cover (LULC) and digital elevation model
Catchment morphometric properties were derived from a digital el-evation model obtained from airborne LiDAR data (from the Natmur08 Project of the General Directorate of Natural Heritage and Biodiversity, Region of Murcia). A 20 m resolution resampled digital elevation model was used to calculate the catchment hydrological properties (Table 2) using the Spatial Analyst tools in ArcMap 10 (ESRI).
Ortophotoimages from two years: 1981 (General Directorate of Landscape Planning, Region of Murcia, spatial resolution 1 m) and 2008 (Natmur-08 Project of the General Directorate of Natural Heritage and Biodiversity, Region of Murcia, spatial resolution 0.45 m) were used as a basis to digitize land use and land cover (LULC) in the catchments. The 1981 image captured the LULC during the period of check-dam con-struction and afforestation, while the image of 2008 represents the present LULC patterns. Five LULC classes were defined: high density for-est (HF), low density forfor-est (LF), shrubland (Shr), pastures (Pas) and agriculture (Agr). Agriculture included fruit tree plantations (walnut and almonds), irrigated vineyards as well as rainfed crops. HF and LF de-rived from both afforestations and natural vegetation succession. Land use change analysis was done by comparing the LULC maps between 2008 and 1981. From these analyses, land use change ratios were calcu-lated as follows (Eq.(1)):
A0881¼Agricultural area in 2008=Agricultural area in 1981: ð1Þ
The distribution of LULC classes was uneven among lithological types. A higher percentage of forests and pastures was located on
were found mainly on marls (Table 3).
2.5. Estimation of specific C yield (SCY) and C enrichment ratios
Specific carbon yield is defined as the amount of eroded C per unit area (g m−2y−1) measured at the catchment's outlet (Eq.(2)). It was estimated by combining the average C concentration in sediment sam-ples (Csed) (%) and the specific sediment yield (SSY; g m−2y−1)
calcu-lated by Boix-Fayos et al. (2008) from the volume of sediments deposited behind check-dams corrected for the check-dam sediment trapping efficiency. Due to a lack of data on C concentration for exported sediment at our study site, we considered the C concentration of exported sediments to be equal to that measured for sediments retained behind the check-dams, since we were interested in the relative differ-ences between catchments and not absolute exported values. However, it must be taken into account that sediment trespassing the check-dams may have higher C concentration than those retained behind them (Fiener et al., 2005) and thus, that the values of exported C reported in this study could be generally underestimated.
SCY¼SSYCsed: ð2Þ
Carbon enrichment ratios are typically used to assess erosion selec-tivity by comparing the C concentration found in sediments with that of their source soils. Ratios above one indicate higher C concentration in sediments and vice versa. In order to determine a C enrichment ratio (ERC) for deposited sediments in each catchment, the average
soil organic carbon (SOC) concentration in the topsoil of the hillslopes wasfirst calculated based on the weighted SOC stocks by land use distri-bution in each catchment from the 1981 LULC map (Eq.(3)). Average SOC concentrations per land use type were: 3.2% for HF, 2.8% for LF, 1.7% for Shr, 1.5% for Pas and 1.0% for Agr (Nadeu, 2013).
SOC¼ð3:2RH FÞ þð2:8RL FÞ þð1:7RshrÞ þð1:5RPasÞ
þ1:0RAgr ð3Þ
where RHFis a ratio that represents the area occupied by HF relative to
the total area (thus, the sum of all LULC equals 1). Then, the C enrich-ment ratio (ERC) for each catchment was calculated by dividing the
mean carbon concentration in the sediment profile (Csed) by the SOCLULC
of the 1981 LULC map. The 1981 map was used to calculate SOC stocks and enrichment ratios because it was considered to be the most repre-sentative for the period between the construction of the check-dams and the sampling campaigns.
2.6. Topography and river morphology
Topography in the catchments was represented by the average slope gradient calculated for each based on the 20 m digital elevation model. Stream order was calculated based on the Strahler classification, which was used to derive a catchment drainage density (DD; km km−2) value forfirst order streams and a bifurcation ratio (BR) between thefirst and second order streams for each catchment. All these variables were cal-culated using the spatial analyst tools in ArcMap 10 (ESRI).
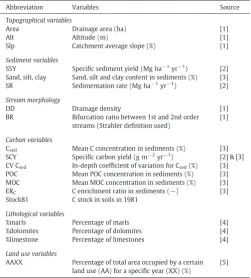
Table 2
Catchment properties used in the analyses.
Abbreviation Variables Source
Topographical variables
Area Drainage area (ha) [1]
Alt Altitude (m) [1]
Slp Catchment average slope (%) [1]
Sediment variables
SSY Specific sediment yield (Mg ha−1yr−1) [2] Sand, silt, clay Sand, silt and clay content in sediments (%) [3] SR Sedimentation rate (Mg ha−1yr−1) [2]
Stream morphology
DD Drainage density [1]
BR Bifurcation ratio between 1st and 2nd order streams (Strahler definition used)
[1]
Carbon variables
Csed Mean C concentration in sediments (%) [3] SCY Specific carbon yield (g m−2yr−1) [2] & [3] CV Csed In-depth coefficient of variation for Csed(%) [3] POC Mean POC concentration in sediments (%) [3] MOC Mean MOC concentration in sediments (%) [3] ERC C enrichment ratio in sediments (−) [3] Stock81 C stock in soils in 1981
Lithological variables
%marls Percentage of marls [4]
%dolomites Percentage of dolomites [4] %limestone Percentage of limestones [4]
Land use variables
AAXX Percentage of total area occupied by a certain land use (AA) for a specific year (XX) (%)
[5]
Source: [1] Calculated from DEM; [2] Data fromBoix-Fayos et al., 2008; [3] soil/sediment samples from this study; [4] (IGME, 1978); [5] Digital ortophotoimages (seeSection 2.4).
Table 3
Percentage of each LULC class in 1981 under the main lithological classes.
2.7. Data analyses
A set of explanatory variables was selected (Table 2) based on those found to be relevant for soil erosion and C redistribution in a preliminary literature review (Nadeu, 2013). Correlation analysis was performed between C related variables and catchment variables describing topogra-phy, river morphology, lithology, LULC and LULC change of each catch-ment. An initial screening was done to remove independent variables that were not correlated to any of the dependent study variables as well as topographical variables that showed high correlation between them (rN0.90, pb0.01). Further, a principal component analysis (PCA) was performed with the R open source software (R, 2011) on the selected variables to group them. All reported means are accompa-nied by their associated standard error unless otherwise specified.
3. Results
3.1. LULC and its change (1981–2008)
Important LULC changes were experienced in the area due to agri-culture abandonment and afforestations between 1956 and 1981, re-ducing the agricultural surface and increasing vegetation cover in 60% of the catchment area (Boix-Fayos et al., 2007). After the construction of check-dams and the main afforestations (1977–1978), we observed that LULC changes consisted basically in a greening where almost one half of the low density forest present in 1981 was reclassified as high density forest; more than half of the shrubland sites decreased in favor of both forest classes while one third of the pastures were convert-ed to low density forests. Agricultural area retainconvert-ed most of its spatial extent from 1981 to 2008 (Table 4). Over 90% of the high density forests and pastures were located in catchments with average altitudes above 1300 m.
3.2. Specific carbon yield (SCY; g m−2y−1) and C concentration
Average specific carbon yield (SCY) for all 18 catchments, estimated by combining specific sediment yield (SSY) values and C concentration in sediments (Csed), was 4.0 ± 1.1 g m−2y−1. Yet, with a median value
of 2.1 g m−2y−1the distribution was skewed to the lower values (Fig. 3). Csedaveraged 1.1 ± 0.3% for the 18 catchments, although a
high variability was found between catchments and even within sedi-ment profiles in depth, with coefficients of variation ranging between 10 and 78% (Table 5). This indicates that a high variability of Csedvalues
could be found within a single sediment wedge, but that the profile av-erage was not necessarily different between catchments. In the 13 catchments where it was measured, MOC represented 63 ± 7% of the C, while the rest was found in the form of POC (Table 5). Csedin marl
dominated catchments was 1.08 ± 0.16% while in limestone or dolo-mite dominated catchments it was 1.26 ± 0.26%, although differences between both were not significant. ER values were in all cases lower than unity with an average of 0.5 ± 0.1.
3.3. Correlation analysis and scatter plots
3.3.1. SCY, SSY
In general, SCY was lower in larger catchments and in those with higher slope gradients. SCY values were higher for those catchments with a higher percentage of marls and lower in catchments dominated by lithologies of limestones and dolomites (Fig. 4a). DD's were higher on marl dominated catchments than on those where limestones and do-lomites were prevalent (Mann–Whitney test, pb0.01), while a positive correlation between percentage of dolomites and average slope was found (r = 0.84, pb0.01). Despite the association of certain LULC clas-ses with lithology, and the correlations found between lithological types and SSY, no significant correlations were found between LULC and SCY or SSY. Additionally, SSY and SCY were significantly correlated to DD (Table 6).
3.3.2. Csed, enrichment ratio and C fractions
Concentration of C in sediments was negatively correlated to SSY and SCY, although not significant at a pb0.05 (Table 6). In fact, we did notfind significant (pb0.05) correlations between Csedand
catch-ment or channel morphological variables, although several trends could be observed for its coefficient of variation. For example, the variability of the Csedwithin the sediment profiles (CV of Csed) was
higher in catchments with low average slopes (Fig. 4b) and high DD (Table 6). Moreover, Csedwas positively correlated to the percentage
of high density forest cover for the two studied years and to that of pas-ture in 1981. The enrichment ratio was negatively correlated to the C stock in soils present in 1981, positively to the percentage of pasture cover in 1981, and it also had the highest positive correlation coefficient with sediment clay content (Table 6).
When looking at the C concentration by size fractions in sediment samples, significant correlations were found with the catchment and channel morphological properties (Table 6), especially in the case of MOC. Significant positive correlations between MOC concentration and drainage area (Fig. 4c), between MOC concentration and average slope gradient, and a negative correlation between MOC concentration and SSY and SCY were observed. POC concentration was negatively cor-related to SSY and DD and positively to average slope. However, MOC and POC concentrations were not significantly correlated to the per-centage of LULC extent for the three studied periods, or to their ratio of change.
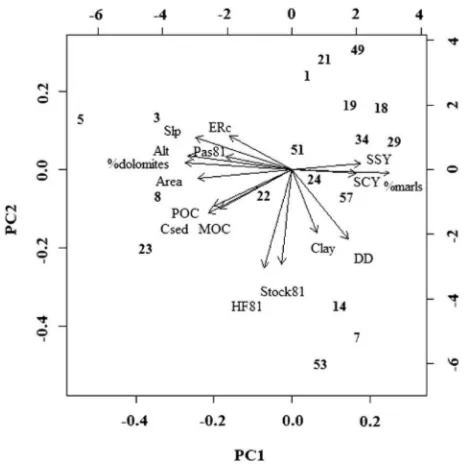
3.4. Classification of catchment-controlling factors for SCY
The results of the principal component analysis showed that the studied variables could be grouped into three major components explaining 74% of the variance or overall data variability, (43% by the first component and 60% the twofirst components), although correla-tion coefficients between components and variables were generally low (rb0.5). Thefirst component (Fig. 5) explained lithological and to-pographical properties of the catchments. The second component (Fig. 5) was negatively correlated to DD, clay content in sediments, car-bon stock in soils (in 1981) and the percentage of HF in 1981. The third component was badly correlated to catchment properties and mainly grouped sedimentological variables and carbon variables (SSY, SCY, Csed, ER and MOC).
Although the catchments in the PCA were located scattered around the biplot of the 1st and 2nd components, several of them appear to be differentiated from others. This is the case of catchments with large catchment areas and dominated by limestone lithology (ID's 3, 5, 8, 23), a group of catchments characterized by marl lithology, high DD, high HF cover and high C stocks in soils, (ID's 7, 14, 53), and a third group, more numerous and disperse, with marl lithology, large SSY values, and low C concentration in soils and sediments (ID's 1, 18, 19, 21, 29, 34, 49) (Fig. 5).
Table 4
Transition matrix between LULC classes for the period 1981–2008 (percentage of change). Rows indicate the original LULC class in 1981 and columns the LULC in 2008. LULC classes: high density forest (HF), low density forest (LF), shrubland (Shr), pasture (Pas) and agri-culture (Agr).
From/to HF LF Shr Pas Agr
HF 98 1 0 0 0
LF 46 53 1 0 0
Shr 20 37 41 1 2
Pas 6 33 8 53 0
4. Discussion
4.1. Factors controlling SCY and Csed
Among all studied variables, catchment area, average slope gradient and DD were significantly correlated to SCY. The association of lower SCY values with larger catchments can be partly due to the increased probability of deposition within larger catchments as is often described for SSY (de Vente and Poesen, 2005; van Noordwijk et al., 1997; Walling, 1983). Yet, deposition of C and its fate during transport and de-position phases is not only area dependent but, among other factors, also depends on the size and stability of the transported aggregates, with coarser particles depositingfirst (Slattery and Burt, 1997; Starr et al., 2000; Walling, 1983). MOC at the study site is associated with 250–20μm sized microaggregates (Nadeu et al., 2011) which may
ex-plain that higher MOC concentrations were found in sediments of larger catchments with longer transport distances and potentially a relatively
good protection of MOC against mineralization within those aggregates. In fact,Boix-Fayos et al. (2014), in a study at the same site, showed that sediments passing the check-dams and transported in runoff had a larger proportion of clay andfine silt particles relative to those deposit-ed behind the check-dams. Furthermore, given that Boix-Fayos et al. (2014)also showed that the distribution of microaggregates (b250μm) in the sediment wedges was not different from that in soils,
it can be assumed that either these sediments traveled short distances or re-aggregation occurred after deposition. On the other side, the nega-tive correlation between SCY, SSY and mean slope gradients, although previously reported in catchment scale studies (Bellin et al., 2011; Lü et al., 2012; Romero-Diaz et al., 2007), has not yet been satisfactorily ex-plained. At our study site this could be explained by high average slope gradients in catchments dominated by hard lithologies such as dolomites and limestones, leading to low SSY rates. Thus, as has been described in other studies (Molina et al., 2008; Romero-Diaz et al., 2007), lithology is an important factor determining sediment and carbon export.
Despite the fact that channel erosion processes often increase in importance with increasing catchment drainage areas (de Vente and Poesen, 2005), the relationship between catchment DD and catchment C export has received very little attention up to date. Sediment and C de-liveries measured in river systems have been found higher than those of hillslopes (Chaplot and Poesen, 2012) indicating the importance of con-sidering these processes when establishing regional sediment and C budgets. The high DD attributed to marl dominated catchments may indicate higher erodibility and the presence of concentrated erosion processes together with channel erosion. This would explain the lower Csedin marl dominated catchments and the negative correlation
be-tween SSY and Csed, which has already been observed in areas where
deep soil or the channel bed are important sources of sediment (Romero-Díaz et al., 2012). Therefore, the low ER values found for all catchments may indicate the importance of massive erosion processes transporting large sediment volumes with low C concentration (Nadeu et al., 2011). This is in opposition to results obtained from catch-ments where interill erosion dominates and a selective removal of C is observed leading to high ER values in sediments (Wang et al., 2010).
In addition to the lithological control, 80% of the total agricultural area (which is more prone to erosion) was located on marls, increasing sediment and C export values, while catchments dominated by Fig. 3.Histogram of SCY values.
Table 5
Average Csed, POC and MOC concentrations (%) and clay percentage in the sediments of the catchments. Standard deviation reported.
Catchment ID Csed CV Csed MOC% Clay
1 1.2 ± 0.3 26 61 16 ± 2
3 1.4 ± 0.1 10 – 26 ± 2
5 1.5 ± 0.2 11 54 16 ± 1
7 1.0 ± 0.7 78 62 13 ± 3
8 1.6 ± 0.4 22 73 18 ± 1
14 1.1 ± 0.2 22 – 15 ± 7
18 0.9 ± 0.2 23 72 15 ± 6
19 0.9 ± 0.2 19 69 16 ± 2
21 1.0 ± 0.2 14 61 15 ± 2
22 1.2 ± 0.2 12 58 21 ± 11
23 1.4 ± 0.3 23 58 11 ± 3
24 1.4 ± 0.3 19 59 12 ± 1
29 1.0 ± 0.4 38 – 18 ± 3
34 1.0 ± 0.3 26 66 16 ± 2
49 0.6 ± 0.2 28 – 15 ± 2
51 1.1 ± 0.1 11 72 13 ± 1
53 1.5 ± 0.7 49 – 15 ± 6
57 1.1 ± 0.3 16 51 12 ± 2
dolomites and limestones were mostly covered by shrubland or forest and had lower C export values. The significant land use changes that took place in the catchments during the last 50 years reduced sediment export and changed channel morphology (Boix-Fayos et al., 2007). Although, we did notfind significant correlations between land use changes and SCY, the positive correlations between Csedand the
per-centage of area occupied by pastures (for 1981) and by forest (HF) (for both 1981 and 2008) (Table 6) indicates that the increase in vege-tation cover increased SOC stocks and lead to an increase in Csed.
How-ever, given the negative correlation coefficient between HF percentage and SSY, reported as well in other studies (Lü et al., 2012), an increase in vegetation cover also reduces soil erodibility and the volume of exported sediment, and, consequently, SCY does not necessarily in-crease. The positive correlation found between Csedand BR could
indicate that efficient evacuation of water and sediments can result in a decreased opportunity for C mineralization during transport and a higher proportion of the eroded C reaching the sediment wedges. How-ever, since detailed hydrological factors and their impact on SOC export were not included in this study due to insufficient available data, this re-mains a hypothesis that needs to be further evaluated.
4.2. Implications for the fate of redistributed carbon
Resolving the uncertainties on the impact of soil erosion on the C cycle implies understanding how C dynamics are modified by soil redis-tribution at eroding and depositional sites and during transport (Van Oost et al., 2007). While aggregate breakdown and preferential mineral-ization of the more labile fraction of C have been associated with in-creased C release to the atmosphere (Lal, 2003), several studies have suggested that deposition can actually lead to increased C sequestration rates in terrestrial ecosystems by reducing C mineralization rates (Berhe et al., 2008; Wang et al., 2013). However, the sequestration potential of depositional sites could be lower than previously thought due to on-going mineralization at depositional sites (Van Oost et al., 2012) and
Fig. 4.Scatter plots representing: a) %marls versus SCY, b) average catchment slope versus CVCsed, c) logarithm of catchment area versus MOC concentration.
Table 6
Pearson correlation coefficients for selected variables.
lnSSY lnSCY lnCsed lnCVCsed ERC POC lnMOC
N (18) (18) (18) (18) (18) (13) (13)
lnsSSY 1 0.98⁎⁎ −0.45 0.36 −0.20 −0.56⁎ −0.68⁎ lnSCY 0.98⁎⁎ 1 −0.28 0.33 −0.08 −0.49 −0.60⁎ lnArea −0.77⁎⁎ −0.72⁎⁎ 0.42 −0.47⁎ 0.43 0.50 0.82⁎⁎ Slope −0.60⁎⁎ −0.55⁎ 0.35 −0.60⁎⁎ 0.35 0.71⁎⁎ 0.62⁎ DDa 0.50⁎ 0.51⁎
−0.33 0.49⁎ −0.23 −0.57⁎ −0.52 BRa
−0.46 −0.39 0.48⁎ −0.28 0.67⁎⁎ 0.06 0.64⁎⁎ lnClay −0.13 −0.10 0.15 −0.28 0.43 −0.14 0.28 Stock81 −0.14 −0.10 0.27 0.26 −0.50⁎ 0.23 −0.05 HF08a
−0.37 −0.30 0.57⁎ −0.18 −0.01 0.30 0.48 HF81a
−0.38 −0.33 0.53⁎ 0.12 −0.20 0.38 0.35 Pas81a
−0.29 −0.30 0.47⁎ −0.46 0.48⁎ 0.43 0.42 Significance levels marked as:
⁎ pb0.5. ⁎⁎ pb0.01.
aIndicates that spearman rank correlation coefficient was used because of a non-nor-mal distribution of the variable.
types in deposited sediments (Rumpel et al., 2014) and on the environ-mental conditions at depositional sites (e.g. soil humidity, temperature, burial depth) (Gregorich et al., 1998). The results from our study sug-gest that in the studied mountain catchment, land use and morphomet-ric properties such as slope, drainage area and drainage density could exert not only an influence on total redistributed C (through sediment redistribution) but also on C dynamics at depositional sites by control-ling the concentration of different C fractions and the variability of total C concentration in sediment profiles. Given the significance of hill-slope andfloodplain C storage for the C balance (Hoffmann et al., 2013a, 2013b; Ran et al., 2014), further research is needed combining data on the characteristics of redistributed C with information on mechanisms of C stability at depositional sites and the role of local environmental conditions. This would contribute towards constraining the value of the potential C mineralization at depositional settings, which remains a key uncertainty in the biogeochemical carbon cycling.
4.3. Considerations regarding the estimation of C export from catchments
The fact that no significant correlation between SCY and Csedwas
found can indicate that Csedcould have a smaller influence on C export
than the total sediment yield at the scale of this study. To further test this observation, and illustrate the risk of extrapolating regional obtain-ed values of C concentration or soil erosion rates, we comparobtain-ed the sum of our estimated total C export from the 18 catchments (25 Mg y−1) with values derived by using two different approaches: (i) a combina-tion of SSY and soil organic carbon (SOC) concentracombina-tions from the hillslopes, as used byDymond (2010), and (ii) taking a general SSY rate for catchments in SE Spain fromCantón et al. (2012)and our mea-sured values of Csedfor each catchment. From thefirst calculation we
obtained a total export of 59 Mg C y−1, while using the second approach we obtained a total export of 162 Mg C y−1, more than
five times the originally estimated value. These results indicate, on one hand, that the use of SOC concentrations instead of C concentration in sediments to derive mobilized C can overestimate C export to the river system when the ER is below unity, which is in agreement with observations byDymond (2010), while for ER values above unity C export would be underestimated. On the other, the second result exemplifies how the use of average regional soil erosion to calculate C export from catch-ments is not recommended.
5. Conclusions
Understanding the redistribution of soil organic carbon by soil ero-sion processes beyond plot level remains challenging. In this study, we evaluated the role of catchment morphology, lithology and land use characteristics, and found that large SCY rates were associated with low average slope gradients and marl lithologies. On the contrary, SCY was relatively low in catchments dominated by resistant lithologies and where the area covered by forest increased during the studied peri-od, although a higher extent of high density forest in the drainage areas was associated to higher C concentration in sediments. C concentration in sediments was in all cases lower than the average C concentration in the catchment's soils, mainly due to the presence of massive erosion processes, like channel and gully erosion, that transport large sediment volumes with low C concentrations. Overall the results suggest that in mountain catchments, morphometric properties such as slope, drainage area and drainage density could exert not only an influence on sediment transport but also on C dynamics at depositional sites by controlling the concentration of different C fractions and the variability of total C con-centration in sediment profiles. Further empirical research is needed to test this and the role of other variables related to catchment hydrol-ogy and local environmental characteristics.
This research was supported with funds from the former Spanish Ministry of Science and Innovation through the ERCO project (CGL-2007-62590/BTE) and with funds from the Regional Séneca Foundation through the ESUMA project (11859/P/09). E. Nadeu and J. de Vente ac-knowledge funding from the former Spanish Ministry of Science and In-novation through an FPI predoctoral fellowship (BES-2008-002379) and a‘Juan de la Cierva’research grant (JCI-2011-08941), respectively. We thank the members of the Soil Erosion and Conservation Group at the CEBAS-CSIC for their valuable help in thefield and laboratory work and two anonymous reviewers for their contribution to thefinal version of the manuscript.
References
Alías, L.J., Ortíz, R., Hernández, J., Martínez, J., Linares, P., Alcaraz, F., Sanchez A. Marín, P., 1991. Proyecto LUCDEME. Mapa de Suelos E = 1:100.000 (hoja Caravaca-910). Ministerio de Agricultura, Pesca y Alimentación, ICONA, Universidad de Murcia. Aufdenkampe, A.K., Mayorga, E., Raymond, P.A., Melack, J.M., Doney, S.C., Alin, S.R., Aalto,
R.E., Yoo, K., 2011.Riverine coupling of biogeochemical cycles between land, oceans, and atmosphere. Front. Ecol. Environ. 9, 53–60.
Bates, T.E., 1993.Soil handling and preparation. In: Carter, M.R. (Ed.), Soil Sampling and Methods of AnalysisCanadian Society of Soil Science. Lewis Publishers, pp. 19–24. Battin, T.J., Luyssaert, S., Kaplan, L.A., Aufdenkampe, A.K., Richter, A., Tranvik, L.J., 2009.The
boundless carbon cycle. Nat. Geosci. 2, 598–600.
Bellin, N., Vanacker, V., van Wesemael, B., Solé-Benet, A., Bakker, M.M., 2011.Natural and anthropogenic controls on soil erosion in the internal betic Cordillera (southeast Spain). Catena 87, 190–200.
Berhe, A.A., Kleber, M., 2013.Erosion, deposition, and the persistence of soil organic mat-ter: mechanistic considerations and problems with terminology. Earth Surf. Proc. Land. 38, 908–912.
Berhe, A.A., Harte, J., Harden, J.W., Torn, M.S., 2007.The significance of the erosion-induced terrestrial carbon sink. Bioscience 57, 337–346.
Berhe, A.A., Harden, J.W., Torn, M.S., Harte, J., 2008.Linking soil organic matter dynamics and erosion-induced terrestrial carbon sequestration at different landform positions. J. Geophys. Res. 113, G04039.
Boix-Fayos, C., Barberá, G.G., López-Bermúdez, F., Castillo, V.M., 2007.Effects of check dams, reforestation and land-use changes on river channel morphology: case study of the Rogativa catchment (Murcia, Spain). Geomorphology 91, 103–123. Boix-Fayos, C., de Vente, J., Martinez-Mena, M., Barbera, G.G., Castillo, V., 2008.The impact
of land use change and check-dams on catchment sediment yield. Hydrol. Process. 22, 4922–4935.
Boix-Fayos, C., Nadeu, E., Quiñonero, J.M., Martínez-Mena, M., Almagro, M., de Vente, J., 2014.Coupling sedimentflow-paths with organic carbon dynamics across a Mediter-ranean catchment. Hydrol. Earth Syst. Sci. Discuss. 11, 5007–5036.
Cambardella, C.A., Elliot, E.T., 1992.Particulate soil organic-matter changes across a grass-land cultivation sequence. Soil Sci. Soc. Am. J. 56, 777–783.
Cantón, Y., Solé-Benet, A., de Vente, J., Boix-Fayos, C., Calvo-Cases, A., Asensio, C., Puigdefábregas, J., 2012.A review of runoff generation and soil erosion across scales in semiarid south-eastern Spain. J. Arid Environ. 75, 1254–1261.
Chaplot, V., Poesen, J., 2012.Sediment, soil organic carbon and runoff delivery at various spatial scales. Catena 88, 46–56.
Chaplot, V., Rumpel, C., Valentin, C., 2005.Water erosion impact on soil and carbon redis-tributions within uplands of Mekong River. Glob. Biogeochem. Cycles 19, GB4004. Chaplot, V., Podwojewski, P., Phachomphon, K., Valentin, C., 2009.Soil erosion impact on
soil organic carbon spatial variability on steep tropical slopes. Soil Sci. Soc. Am. J. 73, 769–779.
Chaplot, V., Bouahom, B., Valentin, C., 2010.Soil organic carbon stocks in Laos: spatial var-iations and controlling factors. Glob. Change Biol. 16, 1380–1393.
de Vente, J., Poesen, J., 2005.Predicting soil erosion and sediment yield at the basin scale: scale issues and semi-quantitative models. Earth-Sci. Rev. 71, 95–125.
Doetterl, S., Six, J., Van Wesemael, B., Van Oost, K., 2012.Carbon cycling in eroding land-scapes: geomorphic controls on soil organic C pool composition and C stabilization. Glob. Change Biol. 18, 2218–2232.
Dymond, J.R., 2010.Soil erosion in New Zealand is a net sink of CO2. Earth Surf. Proc. Land. 35, 1763–1772.
Fiener, P., Auerswald, K., Weigand, S., 2005.Managing erosion and water quality in agri-cultural watersheds by small detention ponds. Agric. Ecosyst. Environ. 110, 132–142. Fiener, P., Auerswald, K., Van Oost, K., 2011.Spatio-temporal patterns in land use and management affecting surface runoff response of agricultural catchments—a review. Earth-Sci. Rev. 106, 92–104.
Gregorich, E.G., Greer, K.J., Anderson, D.W., Liang, B.C., 1998.Carbon distribution and losses: erosion and deposition effects. Soil Tillage Res. 47, 291–302.
Guo, S., Che, S., Liang, W., Yang, Q., 2010.SOC spatial distribution at small Wangdonggou wa-tershed in gully region of the Loess Plateau. Shengtai Xuebao/Acta Ecol. Sin. 30, 52–59. Hancock, G.R., Murphy, D., Evans, K.G., 2010.Hillslope and catchment scale soil organic carbon concentration: an assessment of the role of geomorphology and soil erosion in an undisturbed environment. Geoderma 155, 36–45.
and the missing C-sink: erosion and burial of soil carbon through time. Earth Surf. Dynam. 1, 45–52.
Hoffmann, T., Schlummer, M., Notebaert, B., Verstraeten, G., Korup, O., 2013b.Carbon burial in soil sediments from Holocene agricultural erosion, Central Europe. Glob. Biogeochem. Cycles 27, 828–835.
Hoffmann, U., Hoffmann, T., Jurasinski, G., Glatzel, S., Kuhn, N.J., 2014.Assessing the spatial variability of soil organic carbon stocks in an alpine setting (Grindelwald, Swiss Alps). Geoderma 232–234, 270–283.
IGME, 1978. Mapa Geológico de España 1:50000, Nerpio. Instituto Geológico y Minero de España.
Kirkels, F.M.S.A., Cammeraat, L.H., Kuhn, N.J., 2014.The fate of soil organic carbon upon erosion, transport and deposition in agricultural landscapes—a review of different concepts. Geomorphology 226, 94–105.
Lal, R., 2003.Soil erosion and the global carbon budget. Environ. Int. 29, 437–450. Lü, Y., Sun, R., Fu, B., Wang, Y., 2012.Carbon retention by check dams: regional scale
es-timation. Ecol. Eng. 44, 139–146.
Molina, A., Govers, G., Vanacker, V., Poesen, J., Zeelmaekers, E., Cisneros, F., 2007.Runoff generation in a degraded Andean ecosystem: interaction of vegetation cover and land use. Catena 71, 357–370.
Molina, A., Govers, G., Poesen, J., Van Hemelryck, H., De Bièvre, B., Vanacker, V., 2008. En-vironmental factors controlling spatial variation in sediment yield in a central Andean mountain area. Geomorphology 98, 176–186.
Nadeu, E., 2013. Soil erosion and organic carbon mobilization at the catchment scale: fac-tors, processes and impact on the carbon balance [online]. Faculty of Biology. Univer-sity of Murcia, (http://hdl.handle.net/10803/120510[20 October 2013]).
Nadeu, E., de Vente, J., Martínez-Mena, M., Boix-Fayos, C., 2011.Exploring particle size dis-tribution and organic carbon pools mobilized by different erosion processes at the catchment scale. J. Soil. Sediment. 11, 667–678.
Nadeu, E., Berhe, A.A., de Vente, J., Boix Fayos, C., 2012.Erosion, deposition and replace-ment of soil organic carbon in Mediterranean catchreplace-ments: a geomorphological, isoto-pic and land use change approach. Biogeosciences 9, 1099–1111.
Oeurng, C., Sauvage, S., Sánchez-Pérez, J.M., 2011.Assessment of hydrology, sediment and particulate organic carbon yield in a large agricultural catchment using the SWAT model. J. Hydrol. 401, 145–153.
Owens, L.B., Malone, R.W., Hothem, D.L., Starr, G.C., Lal, R., 2002.Sediment carbon concen-tration and transport from small watersheds under various conservation tillage prac-tices. Soil Tillage Res. 67, 65–73.
Polyakov, V.O., Lal, R., 2004.Soil erosion and carbon dynamics under simulated rainfall. Soil Sci. 169, 590–599.
Quiñonero-Rubio, J.M., Nadeu, E., Boix-Fayos, C., de Vente, J., 2014. Evaluation of the effec-tiveness of forest restoration and check-dams to reduce catchment sediment yield. Land Degrad. Dev.http://dx.doi.org/10.1002/ldr.2331.
Quinton, J.N., Govers, G., Van Oost, K., Bardgett, R.D., 2010.The impact of agricultural soil erosion on biogeochemical cycling. Nat. Geosci. 3, 311–314.
R, 2011.A language and environment for statistical computing. In: R.F.f.S. (Ed.), Comput-ing. R Development Core Team, Vienna, Austria.
Ran, L., Lu, X.X., Xin, Z., 2014.Erosion-induced massive organic carbon burial and carbon emission in the Yellow River basin, China. Biogeosciences 11, 945–959.
Romero-Diaz, A., 2003.Influencia de la litología en las consecuencias del abandono de tierras de cultivo en medios mediterraneos semiáridos. Papeles de Geografía 38, 151–165.
Romero-Diaz, A., Alonso-Sarria, F., Martinez-Lloris, M., 2007.Erosion rates obtained from check-dam sedimentation (SE Spain). A multi-method comparison. Catena 71, 172–178.
Romero-Díaz, A., Marín-Sanleandro, P., Ortiz-Silla, R., 2012.Loss of soil fertility estimated from sediment trapped in check dams. South-eastern Spain. Catena 99, 42–53. Rumpel, C., Chaplot, V., Ciais, P., Chabbi, A., Bouahom, B., Valentin, C., 2014.Composition
changes of eroded carbon at different spatial scales in a tropical watershed suggest enrichment of degraded material during transport. Biogeosciences 11, 3299–3305. Schiettecatte, W., Gabriels, D., Cornelis, W.M., Hofman, G., 2008.Enrichment of organic
carbon in sediment transport by interrill and rill erosion processes. Soil Sci. Soc. Am. J. 72, 50–55.
Sitaula, B.K., Bajracharya, R.M., Singh, B.R., Solberg, B., 2004.Factors affecting organic car-bon dynamics in soils of Nepal/Himalayan region—a review and analysis. Nutr. Cycl. Agroecosyst. 70, 215–229.
Slattery, M.C., Burt, T.P., 1997.Particle size characteristics of suspended sediment in hill-slope runoff and streamflow. Earth Surf. Proc. Land. 22, 705–719.
Smith, S.V., Sleezer, R.O., Renwick, W.H., Buddemeier, R., 2005.Fates of eroded soil organic carbon: Mississippi basin case study. Ecol. Appl. 15, 1929–1940.
Sougnez, N., van Wesemael, B., Vanacker, V., 2011.Low erosion rates measured for steep, sparsely vegetated catchments in southeast Spain. Catena 84, 1–11.
Stallard, R.F., 1998.Terrestrial sedimentation and the carbon cycle: coupling weathering and erosion to carbon burial. Glob. Biogeochem. Cycles 12, 231–257.
Starr, G.C., Lal, R., Malone, R., Hothem, D., Owens, L., Kimble, J., 2000.Modeling soil carbon transported by water erosion processes. Land Degrad. Dev. 11, 83–91.
Thothong, W., Huon, S., Janeau, J.-L., Boonsaner, A., de Rouw, A., Planchon, O., Bardoux, G., Parkpian, P., 2011.Impact of land use change and rainfall on sediment and carbon accu-mulation in a water reservoir of North Thailand. Agric. Ecosyst. Environ. 140, 521–533. van Noordwijk, M., Cerri, C., Woomer, P.L., Nugroho, K., Bernoux, M., 1997.Soil carbon
dy-namics in the humid tropical forest zone. Geoderma 79, 187–225.
Van Oost, K., Quine, T.A., Govers, G., De Gryze, S., Six, J., Harden, J.W., Ritchie, J.C., McCarty, G.W., Heckrath, G., Kosmas, C., Giraldez, J.V., da Silva, J.R.M., Merckx, R., 2007.The im-pact of agricultural soil erosion on the global carbon cycle. Science 318, 626–629. Van Oost, K., Verstraeten, G., Doetterl, S., Notebaert, B., Wiaux, F., Broothaerts, N., Six, J.,
2012.Legacy of human-induced C erosion and burial on soil–atmosphere C exchange. Proc. Natl. Acad. Sci. U. S. A. 109, 19492–19497.
Van Rompaey, A.J.J., Govers, G., Puttemans, C., 2002.Modelling land use changes and their impact on soil erosion and sediment supply to rivers. Earth Surf. Proc. Land. 27, 481–494.
Walling, D.E., 1983.The sediment delivery problem. J. Hydrol. 65, 209–237.
Wang, Z., Govers, G., Steegen, A., Clymans, W., Van den Putte, A., Langhans, C., Merckx, R., Van Oost, K., 2010.Catchment-scale carbon redistribution and delivery by water ero-sion in an intensively cultivated area. Geomorphology 124, 65–74.
Wang, X., Cammeraat, L.H., Wang, Z., Zhou, J., Govers, G., Kalbitz, K., 2013.Stability of or-ganic matter in soils of the Belgian loess belt upon erosion and deposition. Eur. J. Soil Sci. 64, 219–228.
Wang, X., Cammeraat, E.L.H., Cerli, C., Kalbitz, K., 2014.Soil aggregation and the stabilization of organic carbon as affected by erosion and deposition. Soil Biol. Biochem. 72, 55–65. Yeomans, J.C., Bremner, J.M., 1988.A rapid and precise method for routine determination
of organic carbon in soil. Commun. Soil Sci. Plant Anal. 19, 1467–1476.